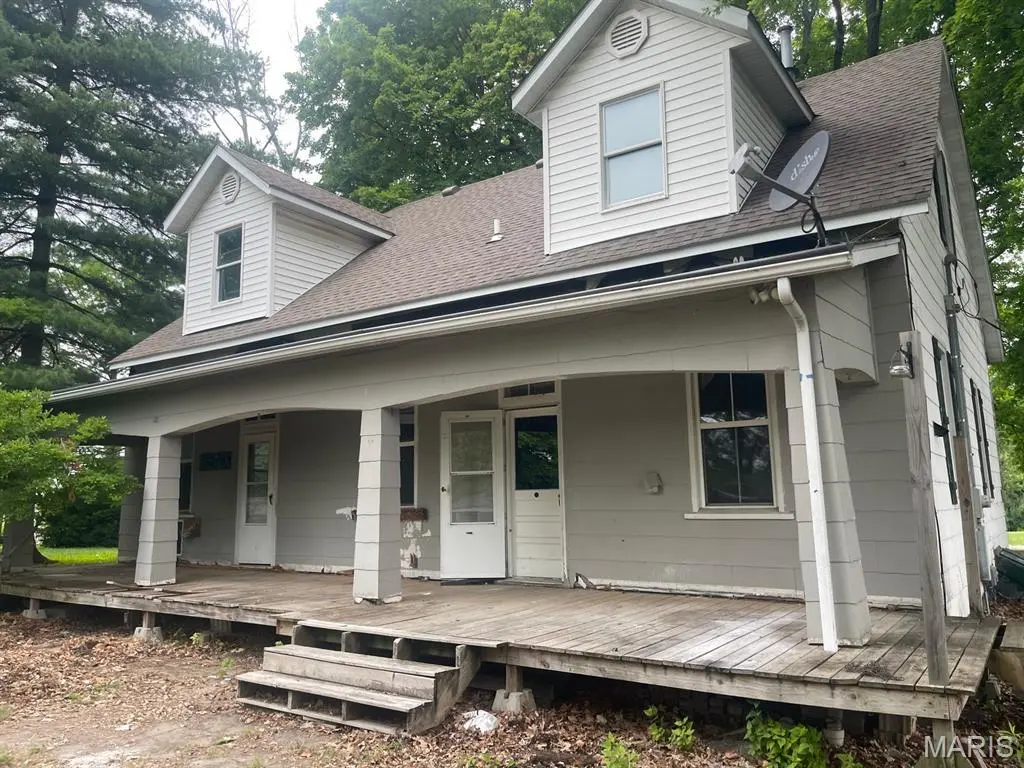
704 Eiler Rd · Belleville, IL
Flood risk 1/10 · Minimal
- FEMA flood zone
- —
- Chance of flooding over 30 yrs
- 0.0%
- Est. flood insurance / yr
- —
Fire risk 1/10 · Minimal
- Est. fire insurance / yr
- $804 – $1,492
Heat risk 5/10 · Moderate
- Hot days now (above 107°F)
- 7 days/yr
- Hot days in 30 yrs
- 21 days/yr
Wind risk 2/10 · Minimal
- Chance of severe wind over 30 yrs
- 1.0%
Air-quality risk 3/10 · Minor
- Unhealthy air days now
- 2 days/yr
- Unhealthy air days in 30 yrs
- 3 days/yr
Risk factors via First Street. Map © Google.
Why this score? — see what drove the C+ grade
The composite is a weighted blend of 9 inputs, each scored 0–100. Each bar is that input's sub-score; the figure is the points it added to the 100-point composite (weight × sub-score).
- Cash flow +17.3/30.0
- ARV discount +12.6/15.0
- Appreciation +9.8/10.0
- 1% rule +6.0/10.0
- DSCR +5.4/10.0
- Livability +3.9/5.0
- Rent growth +2.5/5.0
- Condition / age +2.5/5.0
- Schools +2.2/10.0
$149,900
🖨 Deal sheet (PDF) 📄 Offer letter ✓ Due diligence
Listing remarks
Opportunity awaits at 704 Eiler Rd in Belleville! Situated on approximately 1 acre, this spacious property offers over 2,200 square feet of living space with 4 bedrooms and 2 bathrooms, providing plenty of room to bring your vision to life. Whether you're looking for an investment opportunity, renovation project, or future dream home, this property offers endless potential with its generous lot size and established setting. Conveniently located in Belleville, you'll enjoy easy access to local shopping, dining, parks, schools, and major commuter routes. Residents appreciate the area's friendly atmosphere, community events, and proximity to downtown Belleville's restaurants, entertainment, an
Key facts
- Approximately 1 acre
- Generous lot size
- 1.01 acre lot
Tags
Neighborhood map
What this means for you Summary
Snapshot
- This is a 4-bed/3.0-bath single-family listed at $150k.
Deal economics
- At list price, monthly cash flow is $111 ($1k/yr) — positive.
- The deal already cash-flows at list — no discount required.
- Meets the 1% rule at list price ($2k rent vs $150k).
- Recommended offer: $148k (1.5% below list) — sets the bar for market timing.
- Cap rate 7.2% vs local median 5.6% in Belleville — meaningfully above typical; check what's discounted (condition, days-on-market, listing class) to confirm the premium yield is real.
Location & tenants
- Location reads 78/100 on livability (#142 in IL, #2,604 nationally) — a middle-class / working-renter tenant base. Strengths: commute A+, cost of living A+, housing A+; Watch: crime F, amenities D-.
- Belleville Twp Hsd 201 (suburban): math 21% / reading 28% proficiency, ranked #308 of 620 in IL (top 50%) — low school quality limits family demand, transient renter base, plan for 1-2y turnover.
- Zoned schools: Ellis Elem School (math 34% / reading 34%, grade F, #517 of 2,056 statewide, top 28%, 358 students, 0% FRL); Harmony Intermediate Center (math 11% / reading 18%, grade F, #517 of 665 statewide, top 79%, 227 students, 0% FRL); Belleville High School-West (math 19% / reading 26%, grade F, #317 of 693 statewide, top 46%, 2,234 students, 0% FRL).
- Market conditions: 102 active listings in the ZIP; 783 units permitted in St. Clair County in 2024 (378 in 5+ unit buildings).
Forward outlook
- In year one you build about $15k of equity ($1k loan paydown + $14k appreciation (9.5% local appreciation)).
- St. Clair County population projected at -23% by 2050 — secular population decline; favor cash flow + early exit over multi-decade hold.
- At projected returns (9.5% appreciation + 3.0% rent growth), your $42k cash investment doubles in ~3 years — after that, you're playing with house money.
- By year 3, paydown + projected appreciation supports a ~$39k cash-out refi (75% LTV) — recoverable capital for the next deal without selling this one.
Negotiation context
- It's been on market 21 days — a 2% lower offer ($148k) is reasonable based on typical stale-listing flexibility.
Risks & watch-outs
- Watch-outs: property tax is 2.8% of price; built in 1900 — expect roof / HVAC / electrical / plumbing capex.
- Climate carrying-cost: extreme-heat days projected 7→21/yr by 2055 (HVAC capex compounding) — expect insurance premiums to compound above CPI over the hold.
Questions for the listing agent
- Built in 1900 — when were the roof, HVAC, electrical panel, plumbing, and water heater last replaced?
- Property tax is high relative to price — has the assessment been appealed recently, and will the sale trigger a re-assessment?
- Is there a deadline driving the sale (1031 exchange, divorce, estate, relocation)? That informs how much negotiation room exists.
- Crime grade is F in this area — have there been break-ins, vandalism, or insurance claims at this property in the last 3 years? What carrier currently insures it and at what premium?
- What's the average days-on-market for RENTAL listings here right now (not sales)? A rising rental-DOM trend means longer vacancies and softer asking-rent achievability than the comps imply.
- What's the recent tenant-quality profile in this submarket — average credit score on applications, eviction rate, late-payment / NSF rate, and stable-employment percentage? A property-management company in the area should have these aggregated.
- How much new for-sale + rental construction is in the pipeline within 1–3 miles? Heavy new supply typically softens prices + rents 12–24 months out; constrained supply supports both.
Investment metrics
- 1% rule
- 1.10% ✓
- Cap rate
- 7.18%
- Cash-on-cash
- 3.17%
- DSCR
- 1.14
- GRM
- 7.6
CMA / ARV
- ARV (on-the-fly)
- $168,960
- Comps found
- 12
Show comp detail 12 sales within ~0.75 mi
| Address | Dist | Beds/Ba | Sqft | Sold | Price | $/sf | Match |
|---|---|---|---|---|---|---|---|
| 2 Dottie Dr | 0.10mi | 3/2.0 (-1) | 1,506 (+7%) | 7mo | $175,000 | $116 | 69 |
| 524 Ardmore Dr | 0.30mi | 3/2.0 (-1) | 1,375 (-2%) | 11mo | $110,000 | $80 | 64 |
| 5 Dunn Dr | 0.27mi | 3/1.5 (-1) | 1,363 (-3%) | 11mo | $245,000 | $180 | 62 |
| 621 Eiler Rd | 0.08mi | 3/1.0 (-1) | 1,272 (-10%) | 7mo | $176,900 | $139 | 62 |
| 613 Sunnyhill Dr | 0.17mi | 4/1.5 | 1,612 (+14%) | 4mo | $130,000 | $81 | 58 |
| 29 Dunn Dr | 0.34mi | 3/2.0 (-1) | 1,485 (+6%) | 22mo | $223,900 | $151 | 48 |
| 510 Fern Dr | 0.52mi | 3/2.0 (-1) | 1,540 (+9%) | 7mo | $125,000 | $81 | 45 |
| 409 Edgewood Dr | 0.50mi | 3/2.0 (-1) | 1,564 (+11%) | 9mo | $169,000 | $108 | 42 |
| 520 Pembroke Dr | 0.36mi | 3/1.0 (-1) | 1,248 (-11%) | 21mo | $149,900 | $120 | 34 |
| 19 Cascade Dr | 0.50mi | 3/2.0 (-1) | 1,236 (-12%) | 18mo | $184,900 | $150 | 32 |
| 19 Howard Dr | 0.67mi | 4/2.0 | 1,248 (-11%) | 22mo | $149,900 | $120 | 27 |
| 9790 Old Saint Louis Rd | 0.70mi | 3/1.0 (-1) | 1,280 (-9%) | 18mo | $115,000 | $90 | 24 |
Match score weights: distance 35% · size 25% · config 20% · recency 20%. Top-matched comps best support the ARV.
Projected returns pro-forma
9.5% appreciation · 3.0% rent growth · sell at horizon
- IRR
- 25.6%
- Equity multiple
- 2.99×
- Total profit
- $83,707
- Equity at exit
- $129,605
- IRR
- 22.6%
- Equity multiple
- 6.72×
- Total profit
- $239,970
- Equity at exit
- $273,907
Cash invested: $41,972 (down + closing). Projections, not guarantees.
Landlord ↔ Tenant lean methodology
- Overall (STATE)
- 43 Moderately Tenant-Leaning
- State Illinois
- 43 Moderately Tenant-Leaning · D+7
- County
- — inherits STATE
- City
- — inherits STATE
ZIP-level market 62223
- Home prices YoY
- 3.8%
- Active inventory
- 102
- Price-to-rent
- 7.6×
Monthly cashflow live
- Estimated rent
- $1,651 medium interval (Pro) →
- Mortgage (P&I)
- −$786
- Tax from tax record
- −$345 /mo · $4,138/yr
- Insurance
- −$62
- HOA
- −$0
- Lot rent
- −$0
- Vacancy / Maint / Mgmt
- −$347
- Net cashflow
- $111
Break-even live
Sensitivity live
| Price | -10% $196 | -5% $153 | +0% $111 | +5% $68 | +10% $26 |
|---|---|---|---|---|---|
| Rent | -10% $-20 | -5% $46 | +0% $111 | +5% $176 | +10% $241 |
| Rate | -1.0pp $186 | -0.5pp $149 | base $111 | +0.5pp $72 | +1.0pp $32 |
UW: 25.0% down · 7.5% · 30yr · 1.5% tax · 5.0% vac · 8.0% maint · 8.0% mgmt
Financing live
Cash to close
- Down payment
- $37,475
- Closing costs
- $4,497
- Reserves months
- —
- Total cash needed
- —
Loan-product check · same deal, 3 products live
Conventional
25% down · 7.5% · 30yr
- Down + closing
- —
- Monthly P&I
- —
- Monthly cashflow
- —
- DSCR
- —
- Eligible?
- —
Personal DTI + credit; lowest rate.
DSCR
20% down · 8.5% · 30yr
- Down + closing
- —
- Monthly P&I
- —
- Monthly cashflow
- —
- DSCR
- —
- Eligible?
- —
No personal income docs; deal must DSCR.
Hard money
10% down · 12.0% · 12mo
- Down + closing
- —
- Monthly P&I
- —
- Monthly cashflow
- —
- DSCR
- —
- Eligible?
- —
Short-term bridge; refi at stabilization.
Listing history 13 events
-
2026-06-22days on market $149,900 Active 21 DOM
-
2026-06-21days on market $149,900 Active 20 DOM
-
2026-06-18days on market $149,900 Active 17 DOM
-
2026-06-17days on market $149,900 Active 16 DOM
-
2026-06-16days on market $149,900 Active 15 DOM
-
2026-06-15days on market $149,900 Active 14 DOM
-
2026-06-13days on market $149,900 Active 12 DOM
-
2026-06-09days on market $149,900 Active 8 DOM
-
2026-06-08days on market $149,900 Active 7 DOM
-
2026-06-07days on market $149,900 Active 6 DOM
-
2026-06-03days on market $149,900 Active 2 DOM
-
2026-06-02remarks 699-char remark
-
2026-06-02$149,900 Active 1 DOM
ⓘ Source: listings_history table (triggers on properties + properties_extension) + one-shot
backfill from property_details.listing_events for pre-trigger history.
Tax reassessment forecast IL · Partial reset (capped growth)
- Current annual tax
- $4,138 · $345/mo
- Projected year-2 tax
- $4,138 · $345/mo
- Expected delta
- $0/yr ($0/mo · 0.0%)
ⓘ Screening estimate from a state-policy table — verify with the county assessor before closing.
Climate risk First Street
- Flood 1/10 Low 0% chance over 30 yrs
- Wildfire 1/10 Low
- Heat 5/10 Major 7 d/yr ≥107°F today · 21 d/yr by 30 yrs out
- Wind 2/10 Low 100% chance of damaging wind over 30 yrs
- Air quality 3/10 Moderate 2 unhealthy d/yr today · 3 by 30 yrs out
Nearby sold comps map
Loading sold comps map…
Walkable amenities ~0.75 mi
Loading nearby amenities…
Taxation est. · year 1
- Rental income
- $19,811
- − Mortgage interest
- −$8,397
- − Property taxes
- −$4,138
- − Insurance
- −$750
- − Repairs & maintenance
- −$1,585
- − Management
- −$1,585
- − Depreciation
- −$4,361
- Taxable loss
- −$1,004
- Est. tax savings @ 24.0%
- +$241
- After-tax cash flow
- $1,571/yr
For passive investors: Depreciation is non-cash, so a rental often shows a tax loss while cash-flowing — sheltering income. Rental losses are passive: they offset passive income freely, and up to $25,000/yr can offset ordinary (W-2) income if you actively participate and your MAGI is under $100k (phasing out to $0 by $150k); unused losses carry forward. On sale, claimed depreciation is recaptured at up to 25%, and gains may owe capital-gains tax (a 1031 exchange can defer both). Figures are a year-1 estimate at your 24.0% rate — not tax advice; consult a CPA.
Schools (NCES district)
- District
- Belleville Twp Hsd 201
- NCES district ID
- 1705640
- Math proficiency
- 21% ▼ -8.00%
- Reading proficiency
- 28% ▼ -3.00%
- Median HH income
- $58,064
- Composite
- 22.39/100
- National rank
- #8115
- State rank
- #308 of 620 in IL
Livability — Belleville
- Score
- 78/100
- State rank
- #142
- US rank
- #2604
Category grades
Schools grade is shown separately in the Schools card above.
Census & demographics
- County
- Saint Clair County · 169,691 people
- City population
- 47,407
- Metro
- St. Louis, MO-IL
- Population (ZIP)
- 16,269
- Household income
- $73,700
- Rent vs Own
- Severe rent burden
- 656.0
Population outlook (St. Clair County) Hauer SSP2
- Today (2025)
- 250,366 people
- By 2030
- 240,511 · -3.9%
- By 2040
- 217,391 · -13.2%
- By 2050
- 192,699 · -23.0%
- By 2075
- 140,637 · -43.8%
- By 2100
- 100,499 · -59.9%
Race, ethnicity, and origin ACS 2023
- Neighborhood character
- Majority White (62%)
- Race & ethnicity
- White 62% Black 27% Two or more races 9% Hispanic / Latino 4%
- Common ancestry
- Romanian 3% Lithuanian 3% Slovak 2%
- Foreign-born
- 2% · Canada, Guatemala
- Languages at home
- 96% English-only · Spanish 2%
Political lean MEDSL · St. Clair
- 2024 margin
- Lean D (+7.9) · D 53.0% · R 45.1% · Other 1.8%
- 2008→2024 swing
- -14.6pp toward R · 2008: 22.4pp · 2024: 7.9pp
- All cycles
- 2024: D+7.9 2020: D+8.7 2016: D+5.6 2012: D+14.5 2008: D+22.4
Not yet ingested
- Civics
- —
Market trends
- HPI YoY
- ▲ 9.50%
- Current HPI
- 259.15
- Rent YoY
- —
- Metro
- St. Louis, MO-IL
- State GDP YoY
- ▲ 1.59%
- F500 in state
- 60
Industry mix (Fortune 500 HQ in IL)
| Industry | F500 HQs | Revenue |
|---|---|---|
| Insurance | 4 | $201B |
|
||
| Consumer Goods | 4 | $87B |
|
||
| Industrial Machinery | 3 | $64B |
|
||
| Healthcare | 2 | $55B |
|
||
| Retail / Pharmacy | 1 | $148B |
|
||
| Agriculture / Food | 1 | $86B |
|
||
Price history
+5.6% since first listed2 events — show timeline
- 2026-06-01 Listed $149,900 MARIS as Distributed by MLS Grid
- 2005-09-01 Sold (Public Records) $142,000 Public Records
Property tax history
+3.2%/yrLatest (2024): $4,138 · +8.6% YoY. Source: county tax records.
Cash-flow waterfall
monthlySold comps — $/sqft
last 12 mo · ≤1 miLoading sold comps…