1400 Rosemary Ln · Naples, FL
Flood risk 7/10 · Major
- FEMA flood zone
- X (shaded)
- Chance of flooding over 30 yrs
- 0.75%
- Est. flood insurance / yr
- $507 – $1,088
Fire risk 1/10 · Minimal
- Est. fire insurance / yr
- $947 – $1,759
Heat risk 10/10 · Severe
- Hot days now (above 107°F)
- 7 days/yr
- Hot days in 30 yrs
- 27 days/yr
Wind risk 10/10 · Severe
- Chance of severe wind over 30 yrs
- 99.0%
Air-quality risk 2/10 · Minimal
- Unhealthy air days now
- 2 days/yr
- Unhealthy air days in 30 yrs
- 2 days/yr
Risk factors via First Street. Map © Google.
Why this score? — see what drove the B- grade
The composite is a weighted blend of 9 inputs, each scored 0–100. Each bar is that input's sub-score; the figure is the points it added to the 100-point composite (weight × sub-score).
- Cash flow +26.6/30.0
- DSCR +9.1/10.0
- ARV discount +7.5/15.0
- 1% rule +6.3/10.0
- Rent growth +5.0/5.0
- Schools +5.0/10.0
- Livability +4.0/5.0
- Condition / age +2.5/5.0
- Appreciation +0.0/10.0
$825,000
🖨 Deal sheet 📄 Offer letter ✓ Due diligence
Listing remarks
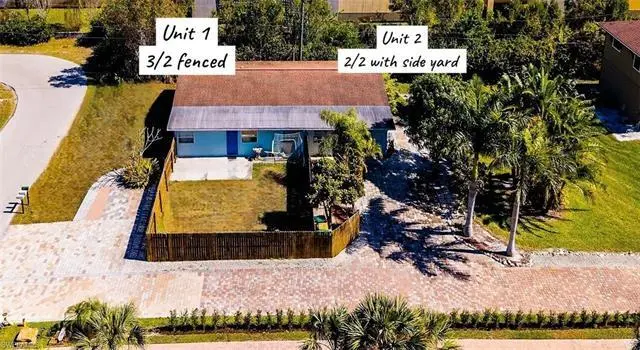
Exceptional duplex opportunity in a rapidly growing Naples location, offering immediate income potential and long-term flexibility. This well-positioned property features two distinct units: a spacious 3-bedroom, 2-bath residence with central A/C and a private fenced yard, alongside a 2-bedroom, 1-bath unit with a generously sized side yard, providing desirable outdoor space for both residences. (more photos to come) Both units are tenant-occupied, creating established rental income from day one, making this an attractive option for investors or those seeking a property with supplemental income potential. The neighboring property includes a single-family home with a guest house, bringing
Key facts
- Private fenced yard
- Duplex opportunity
- Strong rental appeal
Tags
Property features AI
Finance
- Other: Lot size approximately 0.34 acres; Lot dimensions approx. 100' x 150' (see remarks); County maintained road; Irrigation: central; Subdivision: Rosemary Heights
- HOA & community: Community/amenities: see remarks
Exterior
- Utilities: Central water; Central sewer; Cable available
- Home design: Residential income property; Duplex; 1 building with 2 units; 1 story / ranch; End unit; Located in Rosemary Heights development
- Construction: Concrete block construction; Built in 1970; Foundation details: See remarks
- Exterior features: Fenced yard; Single-hung windows; Stucco exterior; Shingle roof
Interior
- Flooring: Tile
- Bathrooms: 3 full bathrooms
- Heating & cooling: Central electric heat; Ceiling fans; Central electric cooling; Wall unit (cooling); See remarks for additional heat/cooling details
- Interior features: Tile flooring
Neighborhood map
What this means for you Summary
Snapshot
- This is a 5-bed/3.0-bath other listed at $825k.
Deal economics
- At list price, monthly cash flow is $2k ($26k/yr) — positive.
- The deal already cash-flows at list — no discount required.
- Meets the 1% rule at list price ($9k rent vs $825k).
- Recommended offer: $776k (6.0% below list) — sets the bar for market timing.
Location & tenants
- Location reads 80/100 on livability (#126 in FL, #1,903 nationally) — a professional / high-income tenant draw. Strengths: crime A+, amenities A+, employment A+; Watch: commute D+, cost of living F.
- Collier (suburban): math 60% / reading 56% proficiency, ranked #16 of 73 in FL (top 22%) — acceptable for families but not a draw, mixed tenant base, ~2y average lease.
- Market conditions: Rents rising fast (+14.6%/yr); 479 active listings in the ZIP; 5 comparable units currently listed for rent nearby; rentals at typical pace (median 23d on market — plan ~3-4 weeks tenant-placement turnaround); high-income renter base; 3,520 units permitted in Collier County in 2024 (959 in 5+ unit buildings).
- At $9,322/mo this rent would consume 96% of the median local household income ($117k/yr) (locally 311% of renters already pay >50% of income on rent) — very limited rent-growth headroom before tenants either downsize or default.
Forward outlook
- Local home prices are declining (-3.0%/yr); year-one equity from $6k of loan paydown is wiped out by about $25k of value loss. Plan a longer hold.
- Collier County population projected at +30% by 2050 — long-run rental-demand tailwind backs the buy-and-hold thesis.
- At projected returns (-3.0% appreciation + 8.0% rent growth), your $231k cash investment doubles in ~7 years — after that, you're playing with house money.
Negotiation context
- It's been on market 65 days — a 6% lower offer ($776k) is reasonable based on typical stale-listing flexibility.
- Current owner paid $305k; list at $825k implies a 170% gain — meaningful room to come down on a strong offer.
Risks & watch-outs
- Watch-outs: flood insurance adds $66/mo.
- Climate carrying-cost: major flood risk; severe wind risk, 99% chance of damaging wind over 30y; extreme-heat days projected 7→27/yr by 2055 (HVAC capex compounding) — expect insurance premiums to compound above CPI over the hold.
Questions for the listing agent
- It's been on market 65 days. Have you received any prior offers? Is the seller open to a 6% concession, seller financing, or rate buy-down credit?
- Built in 1970 — when were the roof, HVAC, electrical panel, plumbing, and water heater last replaced?
- What's the actual annual flood-insurance premium (NFIP or private), and is the property in a SFHA with mandatory coverage?
- Why hasn't it sold? Are there any deal-killer items the seller is aware of (foundation, flood, title, zoning, code violations)?
- Is there a deadline driving the sale (1031 exchange, divorce, estate, relocation)? That informs how much negotiation room exists.
- Schools are B-rated — typically a magnet for longer-tenancy family renters. What's the average tenant stay here, and is there a school-zone premium baked into asking?
- What's the average days-on-market for RENTAL listings here right now (not sales)? A rising rental-DOM trend means longer vacancies and softer asking-rent achievability than the comps imply.
- What's the recent tenant-quality profile in this submarket — average credit score on applications, eviction rate, late-payment / NSF rate, and stable-employment percentage? A property-management company in the area should have these aggregated.
- How much new for-sale + rental construction is in the pipeline within 1–3 miles? Heavy new supply typically softens prices + rents 12–24 months out; constrained supply supports both.
Investment metrics
- 1% rule
- 1.13% ✓
- Cap rate
- 9.51%
- Cash-on-cash
- 11.48%
- DSCR
- 1.51
- GRM
- 7.4
CMA / ARV
No comps found within radius.
Projected returns pro-forma
-3.0% appreciation · 8.0% rent growth · sell at horizon
- IRR
- 5.5%
- Equity multiple
- 1.22×
- Total profit
- $51,898
- Equity at exit
- $123,010
- IRR
- 18.8%
- Equity multiple
- 2.92×
- Total profit
- $444,523
- Equity at exit
- $71,331
Cash invested: $231,000 (down + closing). Projections, not guarantees.
Landlord ↔ Tenant lean methodology
- Overall (STATE)
- 87 Strongly Landlord-Friendly
- State Florida
- 87 Strongly Landlord-Friendly · R+3
- County
- — inherits STATE
- City
- — inherits STATE
ZIP-level market 34103
- Rents YoY
- 14.6%
- Active inventory
- 479
- Price-to-rent
- 7.4×
Monthly cashflow live
- Estimated rent
- $9,322 high interval (Pro) →
- Mortgage (P&I)
- −$4,326
- Tax from tax record
- −$485 /mo · $5,823/yr
- Insurance
- −$344
- Flood insurance flood zone
- −$66 /mo · $798/yr
- HOA
- −$0
- Vacancy / Maint / Mgmt
- −$1,958
- Net cashflow
- $2,143
Break-even live
UW: 25.0% down · 7.5% · 30yr · 1.5% tax · 5.0% vac · 8.0% maint · 8.0% mgmt
Financing live
Cash to close
- Down payment
- $206,250
- Closing costs
- $24,750
- Reserves months
- —
- Total cash needed
- —
Loan-product check · same deal, 3 products live
Conventional
25% down · 7.5% · 30yr
- Down + closing
- —
- Monthly P&I
- —
- Monthly cashflow
- —
- DSCR
- —
- Eligible?
- —
Personal DTI + credit; lowest rate.
DSCR
20% down · 8.5% · 30yr
- Down + closing
- —
- Monthly P&I
- —
- Monthly cashflow
- —
- DSCR
- —
- Eligible?
- —
No personal income docs; deal must DSCR.
Hard money
10% down · 12.0% · 12mo
- Down + closing
- —
- Monthly P&I
- —
- Monthly cashflow
- —
- DSCR
- —
- Eligible?
- —
Short-term bridge; refi at stabilization.
Rent comps 5 comps
| Address | Beds | Baths | Sqft | Rent | $/sqft | DOM | Units | Dist |
|---|---|---|---|---|---|---|---|---|
| 1281 Diana Ave Naples, FL | 5.0 | 3.5 | 2205 | $6,000 | $2.72 | 23d | 1 | 0.53mi |
| 1097 Frank Whiteman Blvd Naples, FL | 4.0 | 3.0 | 1590 | $10,900 | $6.86 | 23d | 1 | 0.54mi |
| 2261 11th St N Naples, FL | 4.0 | 2.0 | 1428 | $6,400 | $4.48 | 23d | 1 | 0.67mi |
| 3511 Santiago Way Naples, FL | 4.0 | 2.0 | 1800 | $6,500 | $3.61 | 23d | 1 | 1.17mi |
| 1281 10th St N Naples, FL | 4.0 | 2.0 | 1580 | $7,000 | $4.43 | 23d | 1 | 1.46mi |
Listing history 17 events
-
2026-06-18days on market $825,000 Active 65 DOM
-
2026-06-17days on market $825,000 Active 64 DOM
-
2026-06-16days on market $825,000 Active 63 DOM
-
2026-06-15days on market $825,000 Active 62 DOM
-
2026-06-14days on market $825,000 Active 60 DOM
-
2026-06-10days on market $825,000 Active 57 DOM
-
2026-06-09days on market $825,000 Active 56 DOM
-
2026-06-08days on market $825,000 Active 55 DOM
-
2026-06-07days on market $825,000 Active 54 DOM
-
2026-06-03days on market $825,000 Active 50 DOM
-
2026-06-02days on market $825,000 Active 49 DOM
-
2026-06-01days on market $825,000 Active 48 DOM
-
2026-05-31days on market $825,000 Active 47 DOM
-
2026-05-30days on market $825,000 Active 46 DOM
-
2026-04-14$825,000 Active
-
2004-12-20soldstatus $305,000
-
1990-01-01soldstatus $90,000
ⓘ Source: listings_history table (triggers on properties + properties_extension) + one-shot
backfill from property_details.listing_events for pre-trigger history.
Tax reassessment forecast FL · Resets to sale price
- Current annual tax
- $5,823 · $485/mo
- Projected year-2 tax
- $6,848 · $571/mo
- Expected delta
- +$1,025/yr (+$85/mo · 17.6%)
ⓘ Screening estimate from a state-policy table — verify with the county assessor before closing.
Climate risk First Street
- Flood 7/10 Severe FEMA zone X (shaded) · 75% chance over 30 yrs
- Wildfire 1/10 Low
- Heat 10/10 Extreme 7 d/yr ≥107°F today · 27 d/yr by 30 yrs out
- Wind 10/10 Extreme 99% chance of damaging wind over 30 yrs
- Air quality 2/10 Low 2 unhealthy d/yr today · 2 by 30 yrs out
Nearby sold comps map
Loading sold comps map…
Walkable amenities ~0.75 mi
Loading nearby amenities…
Taxation est. · year 1
- Rental income
- $111,867
- − Mortgage interest
- −$46,213
- − Property taxes
- −$5,823
- − Insurance
- −$4,922
- − Repairs & maintenance
- −$8,949
- − Management
- −$8,949
- − Depreciation
- −$24,000
- Taxable income
- $13,010
- Est. tax owed @ 24.0%
- −$3,122
- After-tax cash flow
- $22,590/yr
For passive investors: Depreciation is non-cash, so a rental often shows a tax loss while cash-flowing — sheltering income. Rental losses are passive: they offset passive income freely, and up to $25,000/yr can offset ordinary (W-2) income if you actively participate and your MAGI is under $100k (phasing out to $0 by $150k); unused losses carry forward. On sale, claimed depreciation is recaptured at up to 25%, and gains may owe capital-gains tax (a 1031 exchange can defer both). Figures are a year-1 estimate at your 24.0% rate — not tax advice; consult a CPA.
Schools (NCES district)
- District
- Collier
- NCES district ID
- 1200330
- Math proficiency
- 60% ▼ -4.00%
- Reading proficiency
- 56% ▼ -2.00%
- Median HH income
- $58,275
- Composite
- 50.23/100
- National rank
- #1892
- State rank
- #16 of 73 in FL
Livability — Naples
- Score
- 80/100
- State rank
- #126
- US rank
- #1903
Category grades
Schools grade is shown separately in the Schools card above.
Census & demographics
- County
- Collier County · 396,295 people
- City population
- 344,941
- Metro
- Naples-Marco Island, FL
- Population (ZIP)
- 11,299
- Household income
- $116,875
- Rent vs Own
- Severe rent burden
- 311.0
Population outlook (Collier County) Hauer SSP2
- Today (2025)
- 420,858 people
- By 2030
- 450,054 · +6.9%
- By 2040
- 502,232 · +19.3%
- By 2050
- 544,932 · +29.5%
- By 2075
- 627,203 · +49.0%
- By 2100
- 659,015 · +56.6%
Race, ethnicity, and origin ACS 2023
- Neighborhood character
- Predominantly White (87%)
- Race & ethnicity
- White 87% Hispanic / Latino 10% Two or more races 8% Asian 1%
- Hispanic origin (detail)
- Common ancestry
- Romanian 4% Lithuanian 2% Portuguese 2%
- Foreign-born
- 13% · Canada
- Languages at home
- 87% English-only · Spanish 9% Other Indo-European 2% German/W. Germanic 1%
Political lean MEDSL · Collier
- 2024 margin
- Solid R (+33.1) · D 33.1% · R 66.2%
- 2008→2024 swing
- -10.6pp toward R · 2008: -22.5pp · 2024: -33.1pp
- All cycles
- 2024: R+33.1 2020: R+24.7 2016: R+26.0 2012: R+30.1 2008: R+22.5
Not yet ingested
- Civics
- —
Market trends
- HPI YoY
- ▼ -327.53%
- Current HPI
- 315.1396
- Rent YoY
- ▲ 14.55%
- Metro
- Naples-Marco Island, FL
- State GDP YoY
- ▲ 3.28%
- F500 in state
- 36
Industry mix (Fortune 500 HQ in FL)
| Industry | F500 HQs | Revenue |
|---|---|---|
| Industrial Technology | 2 | $29B |
|
||
| Insurance | 2 | $17B |
|
||
| Retail | 1 | $60B |
|
||
| Technology Distribution | 1 | $58B |
|
||
| Homebuilding | 1 | $35B |
|
||
| Technology Manufacturing | 1 | $35B |
|
||
Price history
+816.7% since first listed3 events — show timeline
- 2026-04-14 Listed $825,000 NAPLESMLS
- 2004-12-20 Sold (Public Records) $305,000 Public Records
- 1990-01-01 Sold (Public Records) $90,000 Public Records
Property tax history
+12.5%/yrLatest (2025): $5,823 · +27.8% YoY. Source: county tax records.
Cash-flow waterfall
monthlySold comps — $/sqft
last 12 mo · ≤1 miLoading sold comps…