 10-Plex
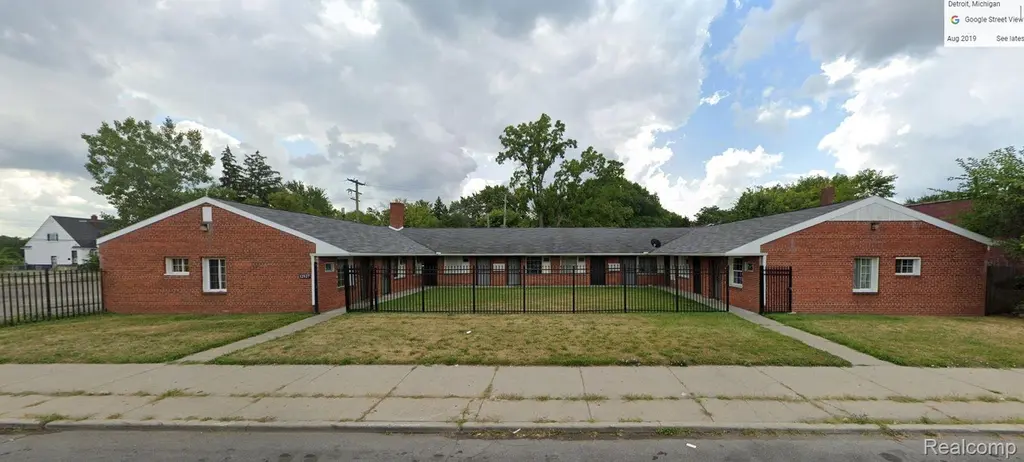
12927 Plymouth Rd · Detroit, MI
Flood risk 1/10 · Minimal
- FEMA flood zone
- X (unshaded)
- Chance of flooding over 30 yrs
- 0.0%
- Est. flood insurance / yr
- $507 – $1,088
Fire risk 1/10 · Minimal
- Est. fire insurance / yr
- $784 – $1,456
Heat risk 3/10 · Minor
- Hot days now (above 97°F)
- 7 days/yr
- Hot days in 30 yrs
- 15 days/yr
Wind risk 2/10 · Minimal
- Chance of severe wind over 30 yrs
- —
Air-quality risk 3/10 · Minor
- Unhealthy air days now
- 2 days/yr
- Unhealthy air days in 30 yrs
- 5 days/yr
Risk factors via First Street. Map © Google.
Why this score? — see what drove the B- grade
The composite is a weighted blend of 9 inputs, each scored 0–100. Each bar is that input's sub-score; the figure is the points it added to the 100-point composite (weight × sub-score).
- Cash flow +30.0/30.0
- 1% rule +10.0/10.0
- DSCR +10.0/10.0
- ARV discount +7.5/15.0
- Rent growth +3.9/5.0
- Livability +3.7/5.0
- Condition / age +2.5/5.0
- Schools +1.3/10.0
- Appreciation +0.0/10.0
$499,000
🖨 Deal sheet 📄 Offer letter ✓ Due diligence
Multi-family units
County records classify this as Multi-Family (5+ Unit). Listing-text estimate: 10 units. confirmed
5+ unit building — per-unit beds/baths from public records are typically unavailable; the breakdown below (if shown) is an estimate from the listing text.
Listing remarks MLS
INVESTORS: Cash-flow from day one with this high-performing 10-unit apartment building at 12927 Plymouth Rd, priced to move at $550,000! Currently fully leased and generating $6,000/month in actual rent, this asset delivers an impressive 8%+ Cap Rate with additional room to grow. This rare deal also includes two adjacent vacant parking lots, 12913 Plymouth Rd and 12901 Plymouth Rd ( Fenced parking lot ), offering massive value for tenant parking or future development . The property features a low-maintenance brick exterior and gated courtyard, making it a perfect addition to any portfolio. Tenants pay their own electric bills, including for the electric baseboard heat. Please do not disturb tenants. Buyer and buyer's agent to verify all information; room measurements are approximate. Property is being sold AS-IS. No virtual showings. All buyers must be accompanied by a licensed real estate agent. A signed NDA and POF/Pre-Approval Letter are required to receive the full Rent Roll.
Key facts
- Fully leased
- Gated courtyard
- 0.28 acre lot
Tags
Neighborhood map
What this means for you Summary
Snapshot
- This is a 10 × 1-bed/1-bath units multifamily listed at $499k.
Deal economics
- At list price, monthly cash flow is $4k ($49k/yr) — positive. Per door: $407/mo.
- The deal already cash-flows at list — no discount required.
- Meets the 1% rule at list price ($10k rent vs $499k).
- Recommended offer: $454k (9.0% below list) — sets the bar for market timing.
- Cap rate 16.1% vs local median 10.2% in Detroit — top-decile yield for the area; either an underpriced asset or a hidden risk that comps aren't pricing in. Stress-test before assuming the spread holds.
Location & tenants
- Location reads 73/100 on livability (#218 in MI) — a middle-class / working-renter tenant base. Strengths: amenities A+, commute A+, cost of living A+; Watch: schools F, crime F, employment F.
- Detroit Public Schools Community District (urban): math 10% / reading 24% proficiency, ranked #499 of 540 in MI (top 92%) — low school quality limits family demand, transient renter base, plan for 1-2y turnover; 90% free/reduced lunch — lower-income household profile, screen leases tightly.
- Market conditions: Rents rising fast (+5.6%/yr); 385 active listings in the ZIP; lower-income renter base — watch delinquency; 2,639 units permitted in Wayne County in 2024 (1,216 in 5+ unit buildings).
- At $9,515/mo this rent would consume 313% of the median local household income ($37k/yr) (locally 2371% of renters already pay >50% of income on rent) — very limited rent-growth headroom before tenants either downsize or default.
Forward outlook
- Local home prices are declining (-3.0%/yr); year-one equity from $3k of loan paydown is wiped out by about $15k of value loss. Plan a longer hold.
- Wayne County population projected at -17% by 2050 — secular population decline; favor cash flow + early exit over multi-decade hold.
- At projected returns (-3.0% appreciation + 5.6% rent growth), your $140k cash investment doubles in ~4 years — after that, you're playing with house money.
Negotiation context
- It's been on market 104 days — a 9% lower offer ($454k) is reasonable based on typical stale-listing flexibility.
- 14 sale attempts since 20y ago; this cycle's ask has dropped $51k (9%) from the opening price — seller is motivated, your offer sets the floor, not the list.
- Current owner paid $380k; 31% above their basis — modest negotiation headroom, anchor on the comps not their cost.
Risks & watch-outs
- Watch-outs: built in 1955 — expect roof / HVAC / electrical / plumbing capex.
Questions for the listing agent
- It's been on market 104 days. Have you received any prior offers? Is the seller open to a 9% concession, seller financing, or rate buy-down credit?
- Can we see the unit-by-unit rent roll, current vacancy, and any below-market leases? What's the average tenancy length?
- What capital expenditures (roof, boiler, parking lot, exteriors) have been made in the last 5 years, and what's planned in the next 2?
- Built in 1955 — when were the roof, HVAC, electrical panel, plumbing, and water heater last replaced?
- Why hasn't it sold? Are there any deal-killer items the seller is aware of (foundation, flood, title, zoning, code violations)?
- Is there a deadline driving the sale (1031 exchange, divorce, estate, relocation)? That informs how much negotiation room exists.
- Schools are F-rated, which usually means shorter tenancies and higher turnover. Who's the typical renter profile here, and what's been the actual vacancy rate?
- Crime grade is F in this area — have there been break-ins, vandalism, or insurance claims at this property in the last 3 years? What carrier currently insures it and at what premium?
- What's the average days-on-market for RENTAL listings here right now (not sales)? A rising rental-DOM trend means longer vacancies and softer asking-rent achievability than the comps imply.
- What's the recent tenant-quality profile in this submarket — average credit score on applications, eviction rate, late-payment / NSF rate, and stable-employment percentage? A property-management company in the area should have these aggregated.
- How much new apartment / multifamily construction is in the pipeline within 1–3 miles? Heavy new supply (>2% of stock underway) typically softens rents 12–24 months out; light construction supports rent growth.
Investment metrics
- 1% rule
- 1.91% ✓
- Cap rate
- 16.08%
- Cash-on-cash
- 34.94%
- DSCR
- 2.55
- GRM
- 4.4
CMA / ARV
- ARV (median comp)
- $220,364
- List price
- $499,000
- Delta
- 126.44%
- Verdict
- OVERPRICED
- Comps
- 3 within 1.0 mi
Projected returns pro-forma
-3.0% appreciation · 5.59% rent growth · sell at horizon
- IRR
- 33.4%
- Equity multiple
- 2.46×
- Total profit
- $203,838
- Equity at exit
- $74,403
- IRR
- 41.7%
- Equity multiple
- 5.45×
- Total profit
- $621,810
- Equity at exit
- $43,144
Cash invested: $139,720 (down + closing). Projections, not guarantees.
Landlord ↔ Tenant lean methodology
- Overall (STATE)
- 62 Landlord-Friendly
- State Michigan
- 62 Landlord-Friendly · EVEN
- County
- — inherits STATE
- City
- — inherits STATE
ZIP-level market 48227
- Rents YoY
- 5.6%
- Active inventory
- 385
- Price-to-rent
- 43.7×
Monthly cashflow live
- Estimated rent
- $9,515 medium interval (Pro) →
- Mortgage (P&I)
- −$2,617
- Tax est. 1.5%
- −$624 /mo · $7,485/yr
- Insurance
- −$208
- HOA
- −$0
- Vacancy / Maint / Mgmt
- −$1,998
- Net cashflow
- $4,068
Break-even live
10-unit breakdown (identical units grouped — click to expand)
| Units | Beds | Baths | Est. rent |
|---|---|---|---|
| 10× units | 1 | 1 | $9,520 |
| #1 | 1 | 1 | $952 |
| #2 | 1 | 1 | $952 |
| #3 | 1 | 1 | $952 |
| #4 | 1 | 1 | $952 |
| #5 | 1 | 1 | $952 |
| #6 | 1 | 1 | $952 |
| #7 | 1 | 1 | $952 |
| #8 | 1 | 1 | $952 |
| #9 | 1 | 1 | $952 |
| #10 | 1 | 1 | $952 |
| Total (10 units) | $9,515 | ||
UW: 25.0% down · 7.5% · 30yr · 1.5% tax · 5.0% vac · 8.0% maint · 8.0% mgmt
Financing live
Cash to close
- Down payment
- $124,750
- Closing costs
- $14,970
- Reserves months
- —
- Total cash needed
- —
Loan-product check · same deal, 3 products live
Conventional
25% down · 7.5% · 30yr
- Down + closing
- —
- Monthly P&I
- —
- Monthly cashflow
- —
- DSCR
- —
- Eligible?
- —
Personal DTI + credit; lowest rate.
DSCR
20% down · 8.5% · 30yr
- Down + closing
- —
- Monthly P&I
- —
- Monthly cashflow
- —
- DSCR
- —
- Eligible?
- —
No personal income docs; deal must DSCR.
Hard money
10% down · 12.0% · 12mo
- Down + closing
- —
- Monthly P&I
- —
- Monthly cashflow
- —
- DSCR
- —
- Eligible?
- —
Short-term bridge; refi at stabilization.
Listing history 49 events
-
2026-06-18days on market $499,000 Active 104 DOM
-
2026-06-17days on market $499,000 Active 103 DOM
-
2026-06-15days on market $499,000 Active 101 DOM
-
2026-06-13days on market $499,000 Active 99 DOM
-
2026-06-13days on market $499,000 Active 98 DOM
-
2026-06-09days on market $499,000 Active 95 DOM
-
2026-06-08days on market $499,000 Active 94 DOM
-
2026-06-07days on market $499,000 Active 93 DOM
-
2026-06-04days on market $499,000 Active 90 DOM
-
2026-06-03days on market $499,000 Active 89 DOM
-
2026-06-01days on market $499,000 Active 87 DOM
-
2026-05-31days on market $499,000 Active 86 DOM
-
2026-04-29price $499,000 994-char remark
Show marketing remark (994 chars)
INVESTORS: Cash-flow from day one with this high-performing 10-unit apartment building at 12927 Plymouth Rd, priced to move at $550,000! Currently fully leased and generating $6,000/month in actual rent, this asset delivers an impressive 8%+ Cap Rate with additional room to grow. This rare deal also includes two adjacent vacant parking lots, 12913 Plymouth Rd and 12901 Plymouth Rd ( Fenced parking lot ), offering massive value for tenant parking or future development . The property features a low-maintenance brick exterior and gated courtyard, making it a perfect addition to any portfolio. Tenants pay their own electric bills, including for the electric baseboard heat. Please do not disturb tenants. Buyer and buyer's agent to verify all information; room measurements are approximate. Property is being sold AS-IS. No virtual showings. All buyers must be accompanied by a licensed real estate agent. A signed NDA and POF/Pre-Approval Letter are required to receive the full Rent Roll.
-
2026-04-28price $499,000 1000-char remark
Show marketing remark (1000 chars)
INVESTORS: Cash-flow from day one with this high-performing 10-unit apartment building at 12927 Plymouth Rd, priced to move at $550,000! Currently fully leased and generating $6,000/month in actual rent, this asset delivers an impressive 8%+ Cap Rate with additional room to grow. This rare deal also includes two adjacent vacant parking lots, 12913 Plymouth Rd and 12901 Plymouth Rd ( Fenced parking lot ), offering massive value for tenant parking or future development . The property features a low-maintenance brick exterior and gated courtyard, making it a perfect addition to any portfolio. Tenants pay their own electric bills, including for the electric baseboard heat. Please do not disturb tenants. Buyer and buyer’s agent to verify all information; room measurements are approximate. Property is being sold AS-IS. No virtual showings. All buyers must be accompanied by a licensed real estate agent. A signed NDA and POF/Pre-Approval Letter are required to receive the full Rent Roll.
-
2026-03-06$550,000 Active 994-char remark
Show marketing remark (1000 chars)
INVESTORS: Cash-flow from day one with this high-performing 10-unit apartment building at 12927 Plymouth Rd, priced to move at $550,000! Currently fully leased and generating $6,000/month in actual rent, this asset delivers an impressive 8%+ Cap Rate with additional room to grow. This rare deal also includes two adjacent vacant parking lots, 12913 Plymouth Rd and 12901 Plymouth Rd ( Fenced parking lot ), offering massive value for tenant parking or future development . The property features a low-maintenance brick exterior and gated courtyard, making it a perfect addition to any portfolio. Tenants pay their own electric bills, including for the electric baseboard heat. Please do not disturb tenants. Buyer and buyer’s agent to verify all information; room measurements are approximate. Property is being sold AS-IS. No virtual showings. All buyers must be accompanied by a licensed real estate agent. A signed NDA and POF/Pre-Approval Letter are required to receive the full Rent Roll.
-
2026-03-06$550,000 Active 1000-char remark
Show marketing remark (1000 chars)
INVESTORS: Cash-flow from day one with this high-performing 10-unit apartment building at 12927 Plymouth Rd, priced to move at $550,000! Currently fully leased and generating $6,000/month in actual rent, this asset delivers an impressive 8%+ Cap Rate with additional room to grow. This rare deal also includes two adjacent vacant parking lots, 12913 Plymouth Rd and 12901 Plymouth Rd ( Fenced parking lot ), offering massive value for tenant parking or future development . The property features a low-maintenance brick exterior and gated courtyard, making it a perfect addition to any portfolio. Tenants pay their own electric bills, including for the electric baseboard heat. Please do not disturb tenants. Buyer and buyer’s agent to verify all information; room measurements are approximate. Property is being sold AS-IS. No virtual showings. All buyers must be accompanied by a licensed real estate agent. A signed NDA and POF/Pre-Approval Letter are required to receive the full Rent Roll.
-
2022-09-17status Pending
-
2022-09-17status Pending
-
2022-09-16soldstatus $380,000 Sold
-
2022-09-16soldstatus $380,000 Closed
-
2022-09-03historical Accepting Backup Offers
-
2022-09-03historical Accepting Backup Offers
-
2022-07-11status Active
-
2022-07-11status Active
-
2022-05-02historical Accepting Backup Offers
-
2022-05-02historical Accepting Backup Offers
-
2022-01-18price $414,900
-
2022-01-17price $414,900
-
2021-12-31status Active
-
2021-12-23historical
-
2021-11-15$424,900 Active
-
2021-11-15$424,900 Active
-
2016-01-02soldstatus $425
-
2015-12-11historical
-
2015-12-02$425
-
2015-09-28historical
-
2015-08-05$425
-
2015-06-26historical
-
2015-03-20$400
-
2015-02-09soldstatus $95,000 Sold
-
2015-02-09soldstatus $95,000
-
2015-01-08historical
-
2015-01-07historical
-
2014-07-03$120,000 Active
-
2014-07-03$120,000
-
2014-06-05historical
-
2013-12-17$120,000
-
2007-03-13historical
-
2006-09-13$159,900
ⓘ Source: listings_history table (triggers on properties + properties_extension) + one-shot
backfill from property_details.listing_events for pre-trigger history.
Climate risk First Street
- Flood 1/10 Low FEMA zone X (unshaded) · 0% chance over 30 yrs
- Wildfire 1/10 Low
- Heat 3/10 Moderate 7 d/yr ≥97°F today · 15 d/yr by 30 yrs out
- Wind 2/10 Low
- Air quality 3/10 Moderate 2 unhealthy d/yr today · 5 by 30 yrs out
Nearby sold comps map
Loading sold comps map…
Walkable amenities ~0.75 mi
Loading nearby amenities…
Taxation est. · year 1
- Rental income
- $114,180
- − Mortgage interest
- −$27,952
- − Property taxes
- −$7,485
- − Insurance
- −$2,495
- − Repairs & maintenance
- −$9,134
- − Management
- −$9,134
- − Depreciation
- −$14,516
- Taxable income
- $43,463
- Est. tax owed @ 24.0%
- −$10,431
- After-tax cash flow
- $38,389/yr
For passive investors: Depreciation is non-cash, so a rental often shows a tax loss while cash-flowing — sheltering income. Rental losses are passive: they offset passive income freely, and up to $25,000/yr can offset ordinary (W-2) income if you actively participate and your MAGI is under $100k (phasing out to $0 by $150k); unused losses carry forward. On sale, claimed depreciation is recaptured at up to 25%, and gains may owe capital-gains tax (a 1031 exchange can defer both). Figures are a year-1 estimate at your 24.0% rate — not tax advice; consult a CPA.
Schools (NCES district)
- District
- Detroit Public Schools Community District
- NCES district ID
- 2601103
- Math proficiency
- 10% ▼ -2.00%
- Reading proficiency
- 24% ▲ 6.00%
- Median HH income
- $25,815
- Composite
- 13.06/100
- National rank
- #9564
- State rank
- #499 of 540 in MI
Livability — Detroit
- Score
- 73/100
- State rank
- #218
- US rank
- #5427
Category grades
Schools grade is shown separately in the Schools card above.
Census & demographics
- Census place
- Detroit, MI
- County
- Wayne County · 1,562,939 people
- City population
- 572,865
- Metro
- Detroit-Warren-Dearborn, MI
- Population (ZIP)
- 40,302
- Household income
- $36,527
- Rent vs Own
- Severe rent burden
- 2371.0
Population outlook (Wayne County) Hauer SSP2
- Today (2025)
- 1,675,273 people
- By 2030
- 1,620,300 · -3.3%
- By 2040
- 1,502,341 · -10.3%
- By 2050
- 1,384,039 · -17.4%
- By 2075
- 1,124,592 · -32.9%
- By 2100
- 881,193 · -47.4%
Race, ethnicity, and origin ACS 2023
- Neighborhood character
- Predominantly Black (95%)
- Race & ethnicity
- Black 95% Two or more races 3% White 1%
- Foreign-born
- 1%
- Languages at home
- 98% English-only · Spanish 1% French/Haitian/Cajun 1%
Political lean MEDSL · Wayne
- 2024 margin
- Strong D (+29.0) · D 62.7% · R 33.7% · Other 3.6%
- 2008→2024 swing
- -20.5pp toward R · 2008: 49.5pp · 2024: 29.0pp
- All cycles
- 2024: D+29.0 2020: D+38.1 2016: D+37.3 2012: D+46.9 2008: D+49.5
Not yet ingested
- Civics
- —
Market trends
- HPI YoY
- ▼ -125.00%
- Current HPI
- 186.4158
- Rent YoY
- ▲ 5.59%
- Metro
- Detroit-Warren-Dearborn, MI
- State GDP YoY
- ▲ 1.37%
- F500 in state
- 28
Industry mix (Fortune 500 HQ in MI)
| Industry | F500 HQs | Revenue |
|---|---|---|
| Automotive Parts | 3 | $48B |
|
||
| Automotive | 2 | $372B |
|
||
| Chemicals | 1 | $45B |
|
||
| Automotive Retail | 1 | $29B |
|
||
| Healthcare / Medical Devices | 1 | $23B |
|
||
| Automotive Technology | 1 | $20B |
|
||
Price history
+212.1% since first listed37 events — show timeline
- 2026-04-29 Price Changed $499,000 MiRealSource-MiMLS
- 2026-04-28 Price Changed $499,000 REALCOMP
- 2026-03-06 Listed $550,000 REALCOMP
- 2026-03-06 Listed $550,000 MiRealSource-MiMLS
- 2022-09-17 Pending — MiRealSource-MiMLS
- 2022-09-17 Pending — REALCOMP
- 2022-09-16 Sold (MLS) $380,000 MiRealSource-MiMLS
- 2022-09-16 Sold (MLS) $380,000 REALCOMP
- 2022-09-03 Contingent — MiRealSource-MiMLS
- 2022-09-03 Contingent — REALCOMP
- 2022-07-11 Relisted — MiRealSource-MiMLS
- 2022-07-11 Relisted — REALCOMP
- 2022-05-02 Contingent — MiRealSource-MiMLS
- 2022-05-02 Contingent — REALCOMP
- 2022-01-18 Price Changed $414,900 MiRealSource-MiMLS
- 2022-01-17 Price Changed $414,900 REALCOMP
- 2021-12-31 Relisted — MiRealSource-MiMLS
- 2021-12-23 Listing Removed — MiRealSource-MiMLS
- 2021-11-15 Listed $424,900 MiRealSource-MiMLS
- 2021-11-15 Listed $424,900 REALCOMP
- 2016-01-02 Sold (MLS) $425 MiRealSource-MiMLS
- 2015-12-11 Listing Removed — MiRealSource-MiMLS
- 2015-12-02 Listed $425 MiRealSource-MiMLS
- 2015-09-28 Listing Removed — MiRealSource-MiMLS
- 2015-08-05 Listed $425 MiRealSource-MiMLS
- 2015-06-26 Listing Removed — MiRealSource-MiMLS
- 2015-03-20 Listed $400 MiRealSource-MiMLS
- 2015-02-09 Sold (MLS) $95,000 MiRealSource-MiMLS
- 2015-02-09 Sold (MLS) $95,000 REALCOMP
- 2015-01-08 Listing Removed — REALCOMP
- 2015-01-07 Listing Removed — MiRealSource-MiMLS
- 2014-07-03 Listed $120,000 MiRealSource-MiMLS
- 2014-07-03 Listed $120,000 REALCOMP
- 2014-06-05 Listing Removed — MiRealSource-MiMLS
- 2013-12-17 Listed $120,000 MiRealSource-MiMLS
- 2007-03-13 Listing Removed — MiRealSource-MiMLS
- 2006-09-13 Listed $159,900 MiRealSource-MiMLS
Cash-flow waterfall
monthlySold comps — $/sqft
last 12 mo · ≤1 miLoading sold comps…