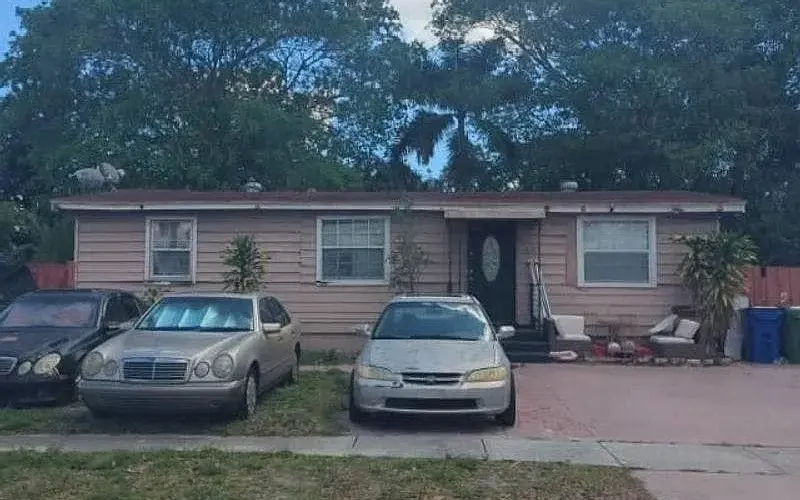
610 SW 50th Ter · Margate, FL
Flood risk 1/10 · Minimal
- FEMA flood zone
- X (shaded)
- Chance of flooding over 30 yrs
- 0.0%
- Est. flood insurance / yr
- $507 – $1,088
Fire risk 1/10 · Minimal
- Est. fire insurance / yr
- $947 – $1,759
Heat risk 10/10 · Severe
- Hot days now (above 106°F)
- 7 days/yr
- Hot days in 30 yrs
- 27 days/yr
Wind risk 10/10 · Severe
- Chance of severe wind over 30 yrs
- 99.0%
Air-quality risk 3/10 · Minor
- Unhealthy air days now
- 3 days/yr
- Unhealthy air days in 30 yrs
- 3 days/yr
Risk factors via First Street. Map © Google.
Why this score? — see what drove the D+ grade
The composite is a weighted blend of 9 inputs, each scored 0–100. Each bar is that input's sub-score; the figure is the points it added to the 100-point composite (weight × sub-score).
- Cash flow +15.0/30.0
- ARV discount +7.5/15.0
- 1% rule +5.0/10.0
- DSCR +5.0/10.0
- Schools +4.1/10.0
- Livability +4.0/5.0
- Condition / age +2.5/5.0
- Rent growth +2.3/5.0
- Appreciation +0.0/10.0
$5,000
🖨 Deal sheet (PDF) 📄 Offer letter ✓ Due diligence
Listing remarks
Foreclosure Auction Ends June 9, 2026 at 10:00 AM EST. Explore this charming 3-bedroom, 1.5-bath residence set in a peaceful and well-located Margate community. The list price is the opening bid for the online auction. Sold As-is. Explore more details and submit your bid through Federa.
Key facts
- 2 garage spots
- Listed 7 days
Property features AI
Exterior
- Parking: Attached or detached 2-car garage
- Home design: Residential property; 1 story
- Exterior features: Lot approximately 0.15 acres; Zoned R-2
Interior
- Bathrooms: One full bathroom; One half bathroom
- Interior features: Single-story layout
Neighborhood map
What this means for you Summary
Snapshot
- This is a 3-bed/2.0-bath single-family listed at $5k.
Deal economics
- At list price, monthly cash flow is $2k ($22k/yr) — positive.
- The deal already cash-flows at list — no discount required.
- Meets the 1% rule at list price ($2k rent vs $5k).
- Cap rate 448.5% vs local median 4.3% in Margate — top-decile yield for the area; either an underpriced asset or a hidden risk that comps aren't pricing in. Stress-test before assuming the spread holds.
Location & tenants
- Location reads 81/100 on livability (#85 in FL, #1,398 nationally) — a professional / high-income tenant draw. Strengths: commute A+, housing A+, health & safety A+; Watch: amenities F.
- Broward (suburban): math 42% / reading 53% proficiency, ranked #46 of 73 in FL (top 63%) — families likely to look elsewhere, expect single-tenant / working-renter base with shorter leases.
- Zoned schools: Nova Blanche Forman Elementary (math 35% / reading 55%, grade D-, #1,271 of 2,144 statewide, top 60%, 769 students, 72% FRL); Nova Middle School (math 44% / reading 53%, grade C-, #274 of 571 statewide, top 50%, 1,284 students, 68% FRL); Nova High School (math 22% / reading 56%, grade F, #312 of 667 statewide, top 48%, 2,227 students, 59% FRL) — zoned schools average 66% FRL vs 51% district-wide (15 pts higher); higher-poverty schools than district average — tighter screening recommended.
- Market conditions: Rents soft (-0.7%/yr); 300 active listings in the ZIP; 40 comparable units currently listed for rent nearby; rentals at typical pace (median 27d on market — plan ~3-4 weeks tenant-placement turnaround); 2,111 units permitted in Broward County in 2024 (1,265 in 5+ unit buildings).
- This rent runs 45% of the median local income ($64k/yr) — at the standard rent-burdened threshold; future hikes will face affordability resistance.
Forward outlook
- Local home prices are declining (-3.0%/yr); year-one equity from $35 of loan paydown is wiped out by about $150 of value loss. Plan a longer hold.
- Broward County population projected at +34% by 2050 — long-run rental-demand tailwind backs the buy-and-hold thesis.
- At projected returns (-3.0% appreciation + 0.0% rent growth), your $1k cash investment doubles in ~1 year — after that, you're playing with house money.
Negotiation context
- Only 8 days on market — expect competitive offers; lowballing is unlikely to land.
Risks & watch-outs
- Climate carrying-cost: severe wind risk, 99% chance of damaging wind over 30y; extreme-heat days projected 7→27/yr by 2055 (HVAC capex compounding) — expect insurance premiums to compound above CPI over the hold.
Questions for the listing agent
- Built in 1971 — when were the roof, HVAC, electrical panel, plumbing, and water heater last replaced?
- Is there a deadline driving the sale (1031 exchange, divorce, estate, relocation)? That informs how much negotiation room exists.
- The area grade is low — what's the realistic commute time and amenity access for the typical tenant pool here? Any planned neighborhood developments (good or bad) we should know about?
- What's the average days-on-market for RENTAL listings here right now (not sales)? A rising rental-DOM trend means longer vacancies and softer asking-rent achievability than the comps imply.
- What's the recent tenant-quality profile in this submarket — average credit score on applications, eviction rate, late-payment / NSF rate, and stable-employment percentage? A property-management company in the area should have these aggregated.
- How much new for-sale + rental construction is in the pipeline within 1–3 miles? Heavy new supply typically softens prices + rents 12–24 months out; constrained supply supports both.
Investment metrics
- 1% rule
- 47.52% ✓
- Cap rate
- 448.50%
- Cash-on-cash
- 1579.32%
- DSCR
- 71.27
- GRM
- 0.2
CMA / ARV
No comps found within radius.
Projected returns pro-forma
-3.0% appreciation · 0.0% rent growth · sell at horizon
- IRR
- —
- Equity multiple
- 79.30×
- Total profit
- $109,615
- Equity at exit
- $746
- IRR
- —
- Equity multiple
- 158.00×
- Total profit
- $219,796
- Equity at exit
- $432
Cash invested: $1,400 (down + closing). Projections, not guarantees.
Landlord ↔ Tenant lean methodology
- Overall (STATE)
- 87 Strongly Landlord-Friendly
- State Florida
- 87 Strongly Landlord-Friendly · R+3
- County
- — inherits STATE
- City
- — inherits STATE
ZIP-level market 33068
- Rents YoY
- -0.7%
- Active inventory
- 300
- Price-to-rent
- 0.2×
Monthly cashflow live
- Estimated rent
- $2,376 high interval (Pro) →
- Mortgage (P&I)
- −$26
- Tax est. 1.5%
- −$6 /mo · $75/yr
- Insurance
- −$2
- HOA
- −$0
- Vacancy / Maint / Mgmt
- −$499
- Net cashflow
- $1,843
Break-even live
Sensitivity live
| Price | -10% $1,846 | -5% $1,844 | +0% $1,843 | +5% $1,841 | +10% $1,839 |
|---|---|---|---|---|---|
| Rent | -10% $1,655 | -5% $1,749 | +0% $1,843 | +5% $1,936 | +10% $2,030 |
| Rate | -1.0pp $1,845 | -0.5pp $1,844 | base $1,843 | +0.5pp $1,841 | +1.0pp $1,840 |
UW: 25.0% down · 7.5% · 30yr · 1.5% tax · 5.0% vac · 8.0% maint · 8.0% mgmt
Financing live
Cash to close
- Down payment
- $1,250
- Closing costs
- $150
- Reserves months
- —
- Total cash needed
- —
Loan-product check · same deal, 3 products live
Conventional
25% down · 7.5% · 30yr
- Down + closing
- —
- Monthly P&I
- —
- Monthly cashflow
- —
- DSCR
- —
- Eligible?
- —
Personal DTI + credit; lowest rate.
DSCR
20% down · 8.5% · 30yr
- Down + closing
- —
- Monthly P&I
- —
- Monthly cashflow
- —
- DSCR
- —
- Eligible?
- —
No personal income docs; deal must DSCR.
Hard money
10% down · 12.0% · 12mo
- Down + closing
- —
- Monthly P&I
- —
- Monthly cashflow
- —
- DSCR
- —
- Eligible?
- —
Short-term bridge; refi at stabilization.
Rent comps 40 comps
| Address | Beds | Baths | Sqft | Rent | $/sqft | DOM | Units | Dist |
|---|---|---|---|---|---|---|---|---|
| 4979 SW 4th St Margate, FL | 3.0 | 2.0 | 1056 | $3,350 | $3.17 | 22d | 1 | 0.21mi |
| 601 S State Road 7 Unit 2C Margate, FL | 2.0 | 2.0 | 960 | $2,100 | $2.19 | 26d | 1 | 0.55mi |
| 601 S State Road 7 Unit 2H Margate, FL | 2.0 | 2.0 | 960 | $1,900 | $1.98 | 26d | 1 | 0.55mi |
| 611 S State Road 7 Unit 1B Margate, FL | 2.0 | 2.0 | 960 | $2,150 | $2.24 | 26d | 1 | 0.57mi |
| 5540 Lakewood Cir S Unit F Margate, FL | 3.0 | 3.0 | 1176 | $2,500 | $2.13 | 17d | 1 | 0.60mi |
| 613 S State Road 7 Unit 3G Margate, FL | 2.0 | 2.0 | 960 | $2,100 | $2.19 | 7d | 1 | 0.61mi |
| 613 S State Road 7 Unit 3E Margate, FL | 2.0 | 2.0 | 1005 | $1,900 | $1.89 | 26d | 1 | 0.61mi |
| 605 S State Road 7 Unit 1D Margate, FL | 2.0 | 2.0 | 960 | $2,000 | $2.08 | 26d | 1 | 0.62mi |
| 605 S State Road 7 Unit 1 Margate, FL | 2.0 | 1.0 | 850 | $1,790 | $2.11 | 5d | 1 | 0.62mi |
| 605 S State Road 7 Unit 1D Margate, FL | 2.0 | 2.0 | 960 | $2,000 | $2.08 | 5d | 1 | 0.62mi |
| 607 S State Road 7 Unit 1G Margate, FL | 2.0 | 2.0 | 940 | $1,750 | $1.86 | 17d | 1 | 0.62mi |
| 609 S State Road 7 Unit 1C Margate, FL | 2.0 | 2.0 | 960 | $1,900 | $1.98 | 26d | 1 | 0.62mi |
| 5510 Lakewood Cir S Unit C Margate, FL | 3.0 | 2.0 | 1176 | $2,500 | $2.13 | 19d | 1 | 0.62mi |
| 1241 SW 46th Ave #1006 Pompano Beach, FL | 2.0 | 2.0 | 1073 | $1,900 | $1.77 | 26d | 1 | 0.64mi |
| 380 E Laurel Dr Unit 4D Margate, FL | 2.0 | 2.0 | 1019 | $2,150 | $2.11 | 26d | 1 | 0.68mi |
| 5534 Lakewood Cir S Unit H Margate, FL | 2.0 | 2.0 | 984 | $2,400 | $2.44 | 5d | 1 | 0.68mi |
| 6162 SW 5th St Margate, FL | 2.0 | 2.0 | 1174 | $2,500 | $2.13 | 19d | 1 | 0.68mi |
| 1000 SW 46th Ave Pompano Beach, FL | 1.0–3.0 | 1.0–2.0 | 1026 | $3,340 | $3.25 | 0d | 15 | 0.69mi |
| 5501 SW 11th St Margate, FL | 1.0–2.0 | 1.0 | 719 | $2,050 | $2.85 | 22d | 4 | 0.72mi |
| 1304 N Santa Catalina Cir #1304 North Lauderdale, FL | 2.0 | 2.5 | 1224 | $2,100 | $1.72 | 26d | 1 | 0.73mi |
| 543 SW 61st Ter #1 Margate, FL | 2.0 | 2.0 | 1482 | $2,525 | $1.70 | 24d | 1 | 0.73mi |
| 1407 S Santa Catalina Cir North Lauderdale, FL | 2.0 | 2.5 | 1224 | $2,140 | $1.75 | 26d | 1 | 0.75mi |
| 4768 W Atlantic Blvd Margate, FL | 1.0–3.0 | 1.0–2.0 | 982 | $2,850 | $2.90 | 3d | 3 | 0.75mi |
| 606 Gardens Dr Pompano Beach, FL | 2.0 | 2.0 | 1090 | $2,200 | $2.02 | 7d | 1 | 0.78mi |
| 1200 SW 52nd Ave North Lauderdale, FL | 3.0 | 2.0 | 1027 | $2,100 | $2.04 | 26d | 1 | 0.80mi |
| 407 Gardens Dr #103 Pompano Beach, FL | 2.0 | 2.0 | 1080 | $2,000 | $1.85 | 26d | 1 | 0.80mi |
| 4200 Oaks Ter #104 Pompano Beach, FL | 2.0 | 2.0 | 1112 | $2,300 | $2.07 | 26d | 1 | 0.80mi |
| 503 Gardens Dr #202 Pompano Beach, FL | 2.0 | 1.0 | 880 | $1,900 | $2.16 | 26d | 1 | 0.81mi |
| 1269 SW 46th Ave #2408 Pompano Beach, FL | 2.0 | 2.0 | 1073 | $2,150 | $2.00 | 24d | 1 | 0.82mi |
| 1263 SW 46th Ave #2109 Pompano Beach, FL | 2.0 | 1.0 | 903 | $2,000 | $2.21 | 17d | 1 | 0.83mi |
| 5600 SW 12th St North Lauderdale, FL | 1.0–3.0 | 1.0–2.0 | 892 | $2,795 | $3.13 | 21d | 3 | 0.83mi |
| 142 NW 60th Ave Unit 6-2 Margate, FL | 2.0 | 2.0 | 825 | $1,790 | $2.17 | 1d | 1 | 0.85mi |
| 142 NW 60th Ave Unit 6-2 Margate, FL | 2.0 | 2.0 | 825 | $1,850 | $2.24 | 26d | 1 | 0.85mi |
| 512 Gardens Dr #103 Pompano Beach, FL | 2.0 | 2.0 | 830 | $1,900 | $2.29 | 9d | 1 | 0.86mi |
| 514 Gardens Dr #101 Pompano Beach, FL | 2.0 | 2.0 | 830 | $2,000 | $2.41 | 26d | 1 | 0.87mi |
| 115 Gardens Dr #202 Pompano Beach, FL | 2.0 | 2.0 | 1090 | $1,950 | $1.79 | 26d | 1 | 0.87mi |
| 5413 SW 14th St North Lauderdale, FL | 3.0 | 2.5 | 1462 | $3,000 | $2.05 | 26d | 1 | 0.92mi |
| 110 Gardens Dr #203 Pompano Beach, FL | 2.0 | 2.0 | 1090 | $2,000 | $1.83 | 26d | 1 | 0.93mi |
| 110 Gardens Dr #103 Pompano Beach, FL | 2.0 | 2.0 | 1080 | $2,200 | $2.04 | 6d | 1 | 0.93mi |
| 304 Gardens Dr Pompano Beach, FL | 2.0 | 2.0 | 900 | $1,950 | $2.17 | 26d | 1 | 0.93mi |
Listing history 7 events
-
2026-06-09days on market $5,000 Active 8 DOM
-
2026-06-08days on market $5,000 Active 7 DOM
-
2026-06-07days on market $5,000 Active 6 DOM
-
2026-06-04days on market $5,000 Active 3 DOM
-
2026-06-03days on market $5,000 Active 2 DOM
-
2026-06-02remarks 287-char remark
-
2026-06-02$5,000 Active 1 DOM
ⓘ Source: listings_history table (triggers on properties + properties_extension) + one-shot
backfill from property_details.listing_events for pre-trigger history.
Climate risk First Street
- Flood 1/10 Low FEMA zone X (shaded) · 0% chance over 30 yrs
- Wildfire 1/10 Low
- Heat 10/10 Extreme 7 d/yr ≥106°F today · 27 d/yr by 30 yrs out
- Wind 10/10 Extreme 99% chance of damaging wind over 30 yrs
- Air quality 3/10 Moderate 3 unhealthy d/yr today · 3 by 30 yrs out
Nearby sold comps map
Loading sold comps map…
Walkable amenities ~0.75 mi
Loading nearby amenities…
Taxation est. · year 1
- Rental income
- $28,513
- − Mortgage interest
- −$280
- − Property taxes
- −$75
- − Insurance
- −$25
- − Repairs & maintenance
- −$2,281
- − Management
- −$2,281
- − Depreciation
- −$145
- Taxable income
- $23,425
- Est. tax owed @ 24.0%
- −$5,622
- After-tax cash flow
- $16,488/yr
For passive investors: Depreciation is non-cash, so a rental often shows a tax loss while cash-flowing — sheltering income. Rental losses are passive: they offset passive income freely, and up to $25,000/yr can offset ordinary (W-2) income if you actively participate and your MAGI is under $100k (phasing out to $0 by $150k); unused losses carry forward. On sale, claimed depreciation is recaptured at up to 25%, and gains may owe capital-gains tax (a 1031 exchange can defer both). Figures are a year-1 estimate at your 24.0% rate — not tax advice; consult a CPA.
Schools (NCES district)
- District
- Broward
- NCES district ID
- 1200180
- Math proficiency
- 42% ▼ -18.00%
- Reading proficiency
- 53% ▼ -5.00%
- Median HH income
- $52,139
- Composite
- 40.88/100
- National rank
- #3621
- State rank
- #46 of 73 in FL
Livability — Margate
- Score
- 81/100
- State rank
- #85
- US rank
- #1398
Category grades
Schools grade is shown separately in the Schools card above.
Census & demographics
- Census place
- Margate, FL
- County
- Broward County · 1,963,430 people
- City population
- 55,466
- Metro
- Miami-Fort Lauderdale-Pompano Beach, FL
- Population (ZIP)
- 54,439
- Household income
- $64,051
- Rent vs Own
- Severe rent burden
- 3073.0
Population outlook (Broward County) Hauer SSP2
- Today (2025)
- 2,207,033 people
- By 2030
- 2,360,704 · +7.0%
- By 2040
- 2,661,208 · +20.6%
- By 2050
- 2,946,698 · +33.5%
- By 2075
- 3,602,273 · +63.2%
- By 2100
- 3,970,984 · +79.9%
Race, ethnicity, and origin ACS 2023
- Neighborhood character
- Diverse neighborhood (Simpson 0.61)
- Race & ethnicity
- Black 58% Hispanic / Latino 21% Two or more races 13% White 11% Asian 4%
- Hispanic origin (detail)
- Mexican 3% Puerto Rican 4% Cuban 1% Dominican 3%
- Common ancestry
- Hispanic 17% Estonian 1% Lithuanian 1%
- Foreign-born
- 47% · Canada, Jamaica, Vietnam
- Languages at home
- 59% English-only · Spanish 19% French/Haitian/Cajun 15% Other Indo-European 2%
Political lean MEDSL · Broward
- 2024 margin
- D (+17.0) · D 58.0% · R 41.0%
- 2008→2024 swing
- -17.8pp toward R · 2008: 34.7pp · 2024: 17.0pp
- All cycles
- 2024: D+17.0 2020: D+29.8 2016: D+35.0 2012: D+34.9 2008: D+34.7
Not yet ingested
- Civics
- —
Market trends
- HPI YoY
- ▼ -317.60%
- Current HPI
- 426.2972
- Rent YoY
- ▼ -0.74%
- Metro
- Miami-Fort Lauderdale-Pompano Beach, FL
- State GDP YoY
- ▲ 3.28%
- F500 in state
- 36
Industry mix (Fortune 500 HQ in FL)
| Industry | F500 HQs | Revenue |
|---|---|---|
| Industrial Technology | 2 | $29B |
|
||
| Insurance | 2 | $17B |
|
||
| Retail | 1 | $60B |
|
||
| Technology Distribution | 1 | $58B |
|
||
| Homebuilding | 1 | $35B |
|
||
| Technology Manufacturing | 1 | $35B |
|
||
Price history
-89.3% since first listed6 events — show timeline
- 2026-06-01 Listed $5,000 NFMLS
- 2006-09-07 Sold (Public Records) $260,000 Public Records
- 2005-02-08 Sold (Public Records) $140,000 Public Records
- 2002-11-27 Sold (Public Records) $77,300 Public Records
- 1990-09-27 Sold (Public Records) $51,000 Public Records
- 1989-12-01 Sold (Public Records) $46,900 Public Records
Property tax history
+2.4%/yrLatest (2025): $1,917 · +2.9% YoY. Source: county tax records.
Cash-flow waterfall
monthlySold comps — $/sqft
last 12 mo · ≤1 miLoading sold comps…