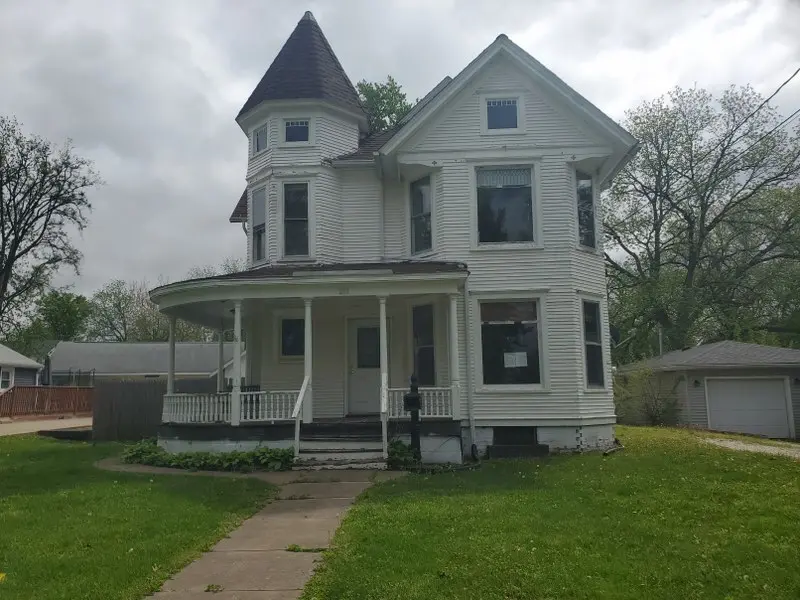
211 S West St · Cambridge, IL
Flood risk 1/10 · Minimal
- FEMA flood zone
- X (unshaded)
- Chance of flooding over 30 yrs
- 0.0%
- Est. flood insurance / yr
- $473 – $860
Fire risk 1/10 · Minimal
- Est. fire insurance / yr
- $804 – $1,492
Heat risk 3/10 · Minor
- Hot days now (above 103°F)
- 7 days/yr
- Hot days in 30 yrs
- 17 days/yr
Wind risk 2/10 · Minimal
- Chance of severe wind over 30 yrs
- —
Air-quality risk 3/10 · Minor
- Unhealthy air days now
- 2 days/yr
- Unhealthy air days in 30 yrs
- 3 days/yr
Risk factors via First Street. Map © Google.
Why this score? — see what drove the A grade
The composite is a weighted blend of 9 inputs, each scored 0–100. Each bar is that input's sub-score; the figure is the points it added to the 100-point composite (weight × sub-score).
- Cash flow +30.0/30.0
- ARV discount +15.0/15.0
- 1% rule +10.0/10.0
- DSCR +10.0/10.0
- Appreciation +9.2/10.0
- Livability +3.3/5.0
- Schools +2.9/10.0
- Rent growth +2.5/5.0
- Condition / age +2.5/5.0
$93,500
🖨 Deal sheet 📄 Offer letter ✓ Due diligence
Listing remarks
Large 2 story home with 3 beds, 2 baths, formal dining, wrap around porch, main level laundry and a 2 car garage. Huge fenced in yard as well.
Key facts
- Wrap around porch
- Fenced in yard
- 0.34 acre lot
Tags
Property features AI
Finance
- Other: Lot dimensions approximately 254 x 66 x 254 x 68; Lot size about 0.25–0.49 acre; Total finished and unfinished area approximately 2,634 sq ft (includes unfinished basement of 902 sq ft); Main level area approximately 902; upper level approximately 830
- HOA & community: No master association fee required
Exterior
- Utilities: Public water; Public sewer
- Home design: Detached single-family home; 2-story; Fee simple ownership; Property over 100 years old; Built before 1978
- Construction: Asphalt roof; Brick/mortar foundation; Other construction materials; Approximately 1,732 finished living area
- Exterior features: Deck; Level lot
Interior
- Kitchen: Kitchen on main level (11 x 13); Range; Dishwasher
- Bedrooms: Master bedroom on second level (13 x 13); Second bedroom on second level (13 x 9); Third bedroom on second level (10 x 13)
- Flooring: Hardwood flooring in living room, dining room and kitchen; Carpet in master bedroom and one bedroom; Tile in laundry
- Bathrooms: 2 full bathrooms
- Heating & cooling: Natural gas heating; Central air conditioning
- Interior features: 6 total rooms; Separate dining room; Unfinished full basement
- Laundry & utility: Main level laundry (7 x 6)
Neighborhood map
What this means for you Summary
Snapshot
- This is a 4-bed/1.0-bath single-family listed at $94k.
Deal economics
- At list price, monthly cash flow is $370 ($4k/yr) — positive.
- The deal already cash-flows at list — no discount required.
- Meets the 1% rule at list price ($1k rent vs $94k).
- Recommended offer: $91k (3.0% below list) — sets the bar for market timing.
Location & tenants
- Location reads 66/100 on livability (#584 in IL) — a middle-class / working-renter tenant base. Strengths: crime A+, cost of living A+, housing A+; Watch: schools F, amenities F, commute F.
- Cambridge CUSD 227 (rural): math 28% / reading 37% proficiency, ranked #215 of 620 in IL (top 35%) — families likely to look elsewhere, expect single-tenant / working-renter base with shorter leases.
- Market conditions: 15 active listings in the ZIP; 32 units permitted in Henry County in 2024 (0 in 5+ unit buildings).
Forward outlook
- In year one you build about $8k of equity ($646 loan paydown + $8k appreciation (8.3% local appreciation)).
- Henry County population projected at -16% by 2050 — secular population decline; favor cash flow + early exit over multi-decade hold.
- At projected returns (8.3% appreciation + 3.0% rent growth), your $26k cash investment doubles in ~2 years — after that, you're playing with house money.
- By year 5, paydown + projected appreciation supports a ~$38k cash-out refi (75% LTV) — recoverable capital for the next deal without selling this one.
Negotiation context
- It's been on market 37 days — a 3% lower offer ($91k) is reasonable based on typical stale-listing flexibility.
- 11 sale attempts since 21y ago; this cycle's ask has dropped $16k (15%) from the opening price — seller is motivated, your offer sets the floor, not the list.
Risks & watch-outs
- Watch-outs: property tax is 3.5% of price; built in 1907 — expect roof / HVAC / electrical / plumbing capex.
Questions for the listing agent
- It's been on market 37 days. Have you received any prior offers? Is the seller open to a 3% concession, seller financing, or rate buy-down credit?
- Built in 1907 — when were the roof, HVAC, electrical panel, plumbing, and water heater last replaced?
- Property tax is high relative to price — has the assessment been appealed recently, and will the sale trigger a re-assessment?
- Is there a deadline driving the sale (1031 exchange, divorce, estate, relocation)? That informs how much negotiation room exists.
- Schools are F-rated, which usually means shorter tenancies and higher turnover. Who's the typical renter profile here, and what's been the actual vacancy rate?
- What's the average days-on-market for RENTAL listings here right now (not sales)? A rising rental-DOM trend means longer vacancies and softer asking-rent achievability than the comps imply.
- What's the recent tenant-quality profile in this submarket — average credit score on applications, eviction rate, late-payment / NSF rate, and stable-employment percentage? A property-management company in the area should have these aggregated.
- How much new for-sale + rental construction is in the pipeline within 1–3 miles? Heavy new supply typically softens prices + rents 12–24 months out; constrained supply supports both.
Investment metrics
- 1% rule
- 1.58% ✓
- Cap rate
- 11.04%
- Cash-on-cash
- 16.94%
- DSCR
- 1.75
- GRM
- 5.3
CMA / ARV
- ARV (median comp)
- $124,512
- List price
- $93,500
- Delta
- -24.91%
- Verdict
- UNDERPRICED
- Comps
- 20 within 1.0 mi
Show comp detail 12 sales within ~0.75 mi
| Address | Dist | Beds/Ba | Sqft | Sold | Price | $/sf | Match |
|---|---|---|---|---|---|---|---|
| 214 S 3rd St | 0.12mi | 4/1.5 | 1,762 (+2%) | 11mo | $70,000 | $40 | 80 |
| 214 S 3rd St | 0.12mi | 4/1.5 | 1,762 (+2%) | 11mo | $70,000 | $40 | 80 |
| 316 W North St | 0.44mi | 3/1.5 (-1) | 1,836 (+6%) | 2mo | $190,000 | $103 | 61 |
| 212 S East St | 0.19mi | 4/1.5 | 1,524 (-12%) | 11mo | $136,000 | $89 | 60 |
| 315 W Locust St | 0.28mi | 4/1.0 | 1,488 (-14%) | 6mo | $75,000 | $50 | 59 |
| 314 W Locust St | 0.31mi | 3/1.5 (-1) | 1,900 (+10%) | 7mo | $129,900 | $68 | 56 |
| 204 W Locust St | 0.36mi | 3/1.5 (-1) | 1,488 (-14%) | 4mo | $110,000 | $74 | 50 |
| 108 N Poplar St | 0.71mi | 3/2.0 (-1) | 1,688 (-2%) | 5mo | $128,500 | $76 | 50 |
| 419 N Main St | 0.60mi | 3/1.0 (-1) | 1,599 (-8%) | 12mo | $145,000 | $91 | 44 |
| 315 N East St | 0.45mi | 3/2.0 (-1) | 1,472 (-15%) | 5mo | $12,250 | $8 | 41 |
| 101 New St | 0.29mi | 3/3.5 (-1) | 1,500 (-13%) | 15mo | $186,000 | $124 | 36 |
| 204 Maple St | 0.46mi | 4/3.0 | 1,472 (-15%) | 13mo | $200,000 | $136 | 35 |
Match score weights: distance 35% · size 25% · config 20% · recency 20%. Top-matched comps best support the ARV.
Projected returns pro-forma
8.34% appreciation · 3.0% rent growth · sell at horizon
- IRR
- 33.9%
- Equity multiple
- 3.45×
- Total profit
- $64,220
- Equity at exit
- $73,208
- IRR
- 30.1%
- Equity multiple
- 7.46×
- Total profit
- $169,197
- Equity at exit
- $147,440
Cash invested: $26,180 (down + closing). Projections, not guarantees.
Landlord ↔ Tenant lean methodology
- Overall (STATE)
- 43 Moderately Tenant-Leaning
- State Illinois
- 43 Moderately Tenant-Leaning · D+7
- County
- — inherits STATE
- City
- — inherits STATE
ZIP-level market 61238
- Home prices YoY
- 3.1%
- Active inventory
- 15
- Price-to-rent
- 5.3×
Monthly cashflow live
- Estimated rent
- $1,481 medium interval (Pro) →
- Mortgage (P&I)
- −$490
- Tax from tax record
- −$271 /mo · $3,256/yr
- Insurance
- −$39
- HOA
- −$0
- Vacancy / Maint / Mgmt
- −$311
- Net cashflow
- $370
Break-even live
UW: 25.0% down · 7.5% · 30yr · 1.5% tax · 5.0% vac · 8.0% maint · 8.0% mgmt
Financing live
Cash to close
- Down payment
- $23,375
- Closing costs
- $2,805
- Reserves months
- —
- Total cash needed
- —
Loan-product check · same deal, 3 products live
Conventional
25% down · 7.5% · 30yr
- Down + closing
- —
- Monthly P&I
- —
- Monthly cashflow
- —
- DSCR
- —
- Eligible?
- —
Personal DTI + credit; lowest rate.
DSCR
20% down · 8.5% · 30yr
- Down + closing
- —
- Monthly P&I
- —
- Monthly cashflow
- —
- DSCR
- —
- Eligible?
- —
No personal income docs; deal must DSCR.
Hard money
10% down · 12.0% · 12mo
- Down + closing
- —
- Monthly P&I
- —
- Monthly cashflow
- —
- DSCR
- —
- Eligible?
- —
Short-term bridge; refi at stabilization.
Listing history 50 events
-
2026-06-18price $93,500 Active 37 DOM
-
2026-06-18days on market $110,000 Active 37 DOM
-
2026-06-17days on market $110,000 Active 36 DOM
-
2026-06-16days on market $110,000 Active 35 DOM
-
2026-06-15days on market $110,000 Active 34 DOM
-
2026-06-13days on market $110,000 Active 32 DOM
-
2026-06-12days on market $110,000 Active 31 DOM
-
2026-06-09days on market $110,000 Active 28 DOM
-
2026-06-08days on market $110,000 Active 27 DOM
-
2026-06-07days on market $110,000 Active 26 DOM
-
2026-06-04days on market $110,000 Active 22 DOM
-
2026-06-02days on market $110,000 Active 21 DOM
-
2026-06-01days on market $110,000 Active 20 DOM
-
2026-05-31days on market $110,000 Active 19 DOM
-
2026-05-31days on market $110,000 Active 18 DOM
-
2026-05-12$110,000 Active 143-char remark
-
2024-03-21historical
-
2024-03-20historical
-
2024-02-24historical
-
2024-02-23Active
-
2024-02-23historical
-
2023-08-29status Pending
-
2023-08-28historical Under Contract
-
2023-08-07status Active
-
2023-08-04price
-
2023-05-03status Pending
-
2023-03-20Active
-
2023-03-07historical
-
2023-03-06historical
-
2023-01-08price
-
2022-12-12Active
-
2021-08-06historical
-
2021-08-06historical
-
2021-08-06historical
-
2021-08-06historical
-
2021-08-06historical
-
2020-09-01soldstatus $98,000
-
2020-08-27soldstatus $98,000
-
2020-08-27soldstatus $98,000
-
2020-05-14$102,900
-
2020-05-14$102,900
-
2012-01-27soldstatus $47,000
-
2012-01-27soldstatus $47,000
-
2012-01-27soldstatus $47,000
-
2012-01-27$49,900
-
2012-01-27$49,900
-
2011-09-09$49,900
-
2010-03-15historical
-
2005-09-16soldstatus $85,000
-
2005-07-21$95,000
ⓘ Source: listings_history table (triggers on properties + properties_extension) + one-shot
backfill from property_details.listing_events for pre-trigger history.
Tax reassessment forecast IL · Partial reset (capped growth)
- Current annual tax
- $3,256 · $271/mo
- Projected year-2 tax
- $3,256 · $271/mo
- Expected delta
- $0/yr ($0/mo · 0.0%)
ⓘ Screening estimate from a state-policy table — verify with the county assessor before closing.
Climate risk First Street
- Flood 1/10 Low FEMA zone X (unshaded) · 0% chance over 30 yrs
- Wildfire 1/10 Low
- Heat 3/10 Moderate 7 d/yr ≥103°F today · 17 d/yr by 30 yrs out
- Wind 2/10 Low
- Air quality 3/10 Moderate 2 unhealthy d/yr today · 3 by 30 yrs out
Nearby sold comps map
Loading sold comps map…
Walkable amenities ~0.75 mi
Loading nearby amenities…
Taxation est. · year 1
- Rental income
- $17,776
- − Mortgage interest
- −$5,237
- − Property taxes
- −$3,256
- − Insurance
- −$468
- − Repairs & maintenance
- −$1,422
- − Management
- −$1,422
- − Depreciation
- −$2,720
- Taxable income
- $3,251
- Est. tax owed @ 24.0%
- −$780
- After-tax cash flow
- $3,656/yr
For passive investors: Depreciation is non-cash, so a rental often shows a tax loss while cash-flowing — sheltering income. Rental losses are passive: they offset passive income freely, and up to $25,000/yr can offset ordinary (W-2) income if you actively participate and your MAGI is under $100k (phasing out to $0 by $150k); unused losses carry forward. On sale, claimed depreciation is recaptured at up to 25%, and gains may owe capital-gains tax (a 1031 exchange can defer both). Figures are a year-1 estimate at your 24.0% rate — not tax advice; consult a CPA.
Schools (NCES district)
- District
- Cambridge CUSD 227
- NCES district ID
- 1708160
- Math proficiency
- 28% ▲ 4.00%
- Reading proficiency
- 37% ▲ 10.00%
- Median HH income
- $55,653
- Composite
- 28.79/100
- National rank
- #6663
- State rank
- #215 of 620 in IL
Livability — Cambridge
- Score
- 66/100
- State rank
- #584
- US rank
- #12167
Category grades
Schools grade is shown separately in the Schools card above.
Census & demographics
- Census place
- Cambridge, IL
- Population (ZIP)
- 2,705
Population outlook (Henry County) Hauer SSP2
- Today (2025)
- 47,376 people
- By 2030
- 45,920 · -3.1%
- By 2040
- 42,829 · -9.6%
- By 2050
- 39,606 · -16.4%
- By 2075
- 31,848 · -32.8%
- By 2100
- 23,503 · -50.4%
Race, ethnicity, and origin ACS 2023
- Neighborhood character
- Predominantly White (93%)
- Race & ethnicity
- White 93% Two or more races 4% Black 2%
- Common ancestry
- English 6% Scottish 3% Slovak 2%
- Foreign-born
- 1%
- Languages at home
- 99% English-only · Tagalog/Filipino 1% Spanish 1%
Political lean MEDSL · Henry
- 2024 margin
- Strong R (+24.5) · D 36.8% · R 61.3% · Other 1.9%
- 2008→2024 swing
- -32.2pp toward R · 2008: 7.7pp · 2024: -24.5pp
- All cycles
- 2024: R+24.5 2020: R+21.4 2016: R+21.2 2012: D+3.1 2008: D+7.7
Not yet ingested
- Civics
- —
Market trends
- HPI YoY
- ▲ 8.34%
- Current HPI
- 276.25
- Rent YoY
- —
- Metro
- —
- State GDP YoY
- ▲ 1.59%
- F500 in state
- 60
Industry mix (Fortune 500 HQ in IL)
| Industry | F500 HQs | Revenue |
|---|---|---|
| Insurance | 4 | $201B |
|
||
| Consumer Goods | 4 | $87B |
|
||
| Industrial Machinery | 3 | $64B |
|
||
| Healthcare | 2 | $55B |
|
||
| Retail / Pharmacy | 1 | $148B |
|
||
| Agriculture / Food | 1 | $86B |
|
||
Price history
+15.8% since first listed35 events — show timeline
- 2026-05-12 Listed $110,000 MRED as Distributed by MLS Grid
- 2024-03-21 Listing Removed — RMLSA as Distributed by MLS Grid
- 2024-03-20 Listing Removed — MRED as Distributed by MLS Grid
- 2024-02-24 Listing Removed — RMLSA as Distributed by MLS Grid
- 2024-02-23 Listing Removed — MRED as Distributed by MLS Grid
- 2024-02-23 Listed — RMLSA as Distributed by MLS Grid
- 2023-08-29 Pending — RMLSA as Distributed by MLS Grid
- 2023-08-28 Contingent — RMLSA as Distributed by MLS Grid
- 2023-08-07 Relisted — RMLSA as Distributed by MLS Grid
- 2023-08-04 Price Changed — RMLSA as Distributed by MLS Grid
- 2023-05-03 Pending — RMLSA as Distributed by MLS Grid
- 2023-03-20 Listed — RMLSA as Distributed by MLS Grid
- 2023-03-07 Listing Removed — RMLSA as Distributed by MLS Grid
- 2023-03-06 Listing Removed — MRED as Distributed by MLS Grid
- 2023-01-08 Price Changed — RMLSA as Distributed by MLS Grid
- 2022-12-12 Listed — RMLSA as Distributed by MLS Grid
- 2021-08-06 Listing Removed — RMLSA as Distributed by MLS Grid
- 2021-08-06 Listing Removed — RMLSA as Distributed by MLS Grid
- 2021-08-06 Listing Removed — RMLSA as Distributed by MLS Grid
- 2021-08-06 Listing Removed — RMLSA as Distributed by MLS Grid
- 2021-08-06 Listing Removed — RMLSA as Distributed by MLS Grid
- 2020-09-01 Sold (Public Records) $98,000 Public Records
- 2020-08-27 Sold (MLS) $98,000 MRED as Distributed by MLS Grid
- 2020-08-27 Sold (MLS) $98,000 RMLSA as Distributed by MLS Grid
- 2020-05-14 Listed $102,900 MRED as Distributed by MLS Grid
- 2020-05-14 Listed $102,900 RMLSA as Distributed by MLS Grid
- 2012-01-27 Listed $49,900 MRED as Distributed by MLS Grid
- 2012-01-27 Listed $49,900 RMLSA as Distributed by MLS Grid
- 2012-01-27 Sold (MLS) $47,000 MRED as Distributed by MLS Grid
- 2012-01-27 Sold (MLS) $47,000 RMLSA as Distributed by MLS Grid
- 2012-01-27 Sold (MLS) $47,000 RMLSA as Distributed by MLS Grid
- 2011-09-09 Listed $49,900 RMLSA as Distributed by MLS Grid
- 2010-03-15 Listing Removed — MRED as Distributed by MLS Grid
- 2005-09-16 Sold (MLS) $85,000 RMLSA as Distributed by MLS Grid
- 2005-07-21 Listed $95,000 RMLSA as Distributed by MLS Grid
Property tax history
+7.2%/yrLatest (2025): $3,256 · +28.9% YoY. Source: county tax records.
Cash-flow waterfall
monthlySold comps — $/sqft
last 12 mo · ≤1 miLoading sold comps…