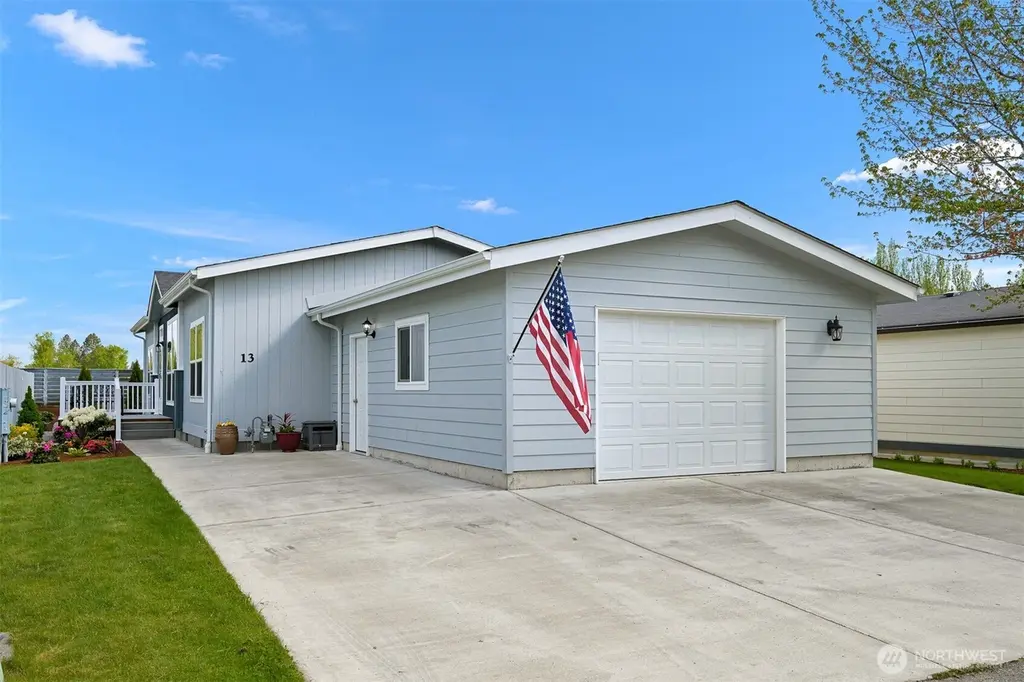
6350 Portal Way #13 · Ferndale, WA
Flood risk 1/10 · Minimal
- FEMA flood zone
- X (unshaded)
- Chance of flooding over 30 yrs
- 0.0%
- Est. flood insurance / yr
- $507 – $1,088
Fire risk 3/10 · Minor
- Est. fire insurance / yr
- $604 – $1,122
Heat risk 3/10 · Minor
- Hot days now (above 82°F)
- 8 days/yr
- Hot days in 30 yrs
- 19 days/yr
Wind risk 1/10 · Minimal
- Chance of severe wind over 30 yrs
- —
Air-quality risk 6/10 · Moderate
- Unhealthy air days now
- 10 days/yr
- Unhealthy air days in 30 yrs
- 11 days/yr
Risk factors via First Street. Map © Google.
Why this score? — see what drove the D grade
The composite is a weighted blend of 9 inputs, each scored 0–100. Each bar is that input's sub-score; the figure is the points it added to the 100-point composite (weight × sub-score).
- Cash flow +11.9/30.0
- ARV discount +7.5/15.0
- Schools +4.6/10.0
- Livability +4.0/5.0
- Condition / age +4.0/5.0
- Rent growth +3.7/5.0
- DSCR +3.5/10.0
- 1% rule +3.4/10.0
- Appreciation +0.0/10.0
$315,000
🖨 Deal sheet (PDF) 📄 Offer letter ✓ Due diligence
Listing remarks
Experience refined 55+ living in this "just like new" 1,404 sq ft home, perfectly situated in the upscale Portal Creek Park community. The spacious great room floor plan is now enhanced by the modern convenience of new motorized blinds for effortless ambiance control. Designed for both comfort and efficiency, the home features low-maintenance flooring, a natural gas stove, and a wonderful large kitchen complete with a walk-in pantry and abundant cabinetry. The thoughtful layout includes a primary suite with a walk-in shower and a versatile third bedroom located conveniently right off the spacious attached garage. The exterior has been beautifully refreshed with brand-new landscapi
Key facts
- Natural gas stove
- Abundant cabinetry
- New motorized blinds
Tags
Property features AI
Finance
- Other: Taxes listed (not included per instructions)
- Financial info: Listing terms: Cash
- HOA & community: Portal Creek park (park approved for sale); 86 homes in the park; Senior community; Pets allowed: cats and dogs; Park amenities include clubhouse and RV parking; Monthly land lease: $750
Exterior
- Parking: Individual garage (has garage)
- Utilities: Public water; City sewer; Electric and natural gas service; Cable: Xfinity; Internet: Xfinity
- Home design: Manufactured home (double wide); One story; Faces south; Very good condition; Make: Golden West; Style: Manufactured double wide
- Construction: Cement plank siding; Composition roof; Block skirting; Slab foundation with tie downs; Manufactured after 6/15/1976
- Exterior features: Cement plank exterior; Curbs; Paved; Sidewalk; View
Interior
- Kitchen: Dishwasher; Garbage disposal; Microwave; Refrigerator; Stove/Range
- Bedrooms: 3 bedrooms
- Flooring: Vinyl
- Bathrooms: 1 full bath; 1 three-quarter bath; 1 bathtub; 2 showers
- Heating & cooling: Forced air heating; 90%+ high-efficiency heating
- Interior features: Fireplace (electric); Water heater
- Laundry & utility: Utility room; Water heater (natural gas)
Neighborhood map
What this means for you Summary
Snapshot
- This is a 3-bed/2.0-bath manufactured listed at $315k. Condition is rated good.
Deal economics
- At list price, monthly cash flow is $-79 ($-952/yr) — negative.
- To cash-flow at today's rent, offer at most $304k (3.6% below list).
- To meet the 1% rule (rent ≥ 1% of price), the offer needs to be $266k (15.7% below list).
- Recommended offer: $266k (15.7% below list) — sets the bar for 1% rule.
- Cap rate 6.0% vs local median 2.5% in Ferndale — top-decile yield for the area; either an underpriced asset or a hidden risk that comps aren't pricing in. Stress-test before assuming the spread holds.
Location & tenants
- Location reads 81/100 on livability (#79 in WA, #1,471 nationally) — a professional / high-income tenant draw. Strengths: commute A+, health & safety A+, housing A; Watch: amenities F, cost of living D-.
- Ferndale School District (suburban): math 43% / reading 58% proficiency, ranked #138 of 291 in WA (top 47%) — acceptable for families but not a draw, mixed tenant base, ~2y average lease.
- Zoned schools: Cascadia Elementary (429 students, 65% FRL); Ferndale High School (1,323 students, 48% FRL) — zoned schools average 56% FRL vs 41% district-wide (16 pts higher); higher-poverty schools than district average — tighter screening recommended.
- Market conditions: Rents rising fast (+4.8%/yr); 232 active listings in the ZIP; 2 comparable units currently listed for rent nearby; solid renter incomes; 1,190 units permitted in Whatcom County in 2024 (327 in 5+ unit buildings).
- This rent runs 35% of the median local income ($91k/yr) — at the standard rent-burdened threshold; future hikes will face affordability resistance.
Forward outlook
- Local home prices are declining (-3.0%/yr); year-one equity from $2k of loan paydown is wiped out by about $9k of value loss. Plan a longer hold.
- Whatcom County population projected at +28% by 2050 — long-run rental-demand tailwind backs the buy-and-hold thesis.
Negotiation context
- Only 13 days on market — expect competitive offers; lowballing is unlikely to land.
- 2 sale attempts with the ask held roughly flat each time — persistent listings suggest the price (not the market) is what's stuck; bring a comps-based counter.
Questions for the listing agent
- What do current leases actually rent for vs. the listed asking? Can we see a recent rent roll and the last 12 months of T-12 income?
- Is there a deadline driving the sale (1031 exchange, divorce, estate, relocation)? That informs how much negotiation room exists.
- Schools are B-rated — typically a magnet for longer-tenancy family renters. What's the average tenant stay here, and is there a school-zone premium baked into asking?
- The area grade is low — what's the realistic commute time and amenity access for the typical tenant pool here? Any planned neighborhood developments (good or bad) we should know about?
- What's the average days-on-market for RENTAL listings here right now (not sales)? A rising rental-DOM trend means longer vacancies and softer asking-rent achievability than the comps imply.
- What's the recent tenant-quality profile in this submarket — average credit score on applications, eviction rate, late-payment / NSF rate, and stable-employment percentage? A property-management company in the area should have these aggregated.
- How much new for-sale + rental construction is in the pipeline within 1–3 miles? Heavy new supply typically softens prices + rents 12–24 months out; constrained supply supports both.
Investment metrics
- 1% rule
- 0.84% ✗
- Cap rate
- 5.99%
- Cash-on-cash
- -1.08%
- DSCR
- 0.95
- GRM
- 9.9
CMA / ARV
- ARV (median comp)
- $315,000
- List price
- $315,000
- Delta
- —
- Verdict
- FAIR
- Comps
- 3 within 1.0 mi
Show comp detail 3 sales within ~0.75 mi
| Address | Dist | Beds/Ba | Sqft | Sold | Price | $/sf | Match |
|---|---|---|---|---|---|---|---|
| 6350 Portal Way #13 | 0.00mi | 3/2.0 | 1,404 (0%) | 0mo | $315,000 | $224 | 100 |
| 6350 Portal Way #83 | 0.05mi | 3/2.0 | 1,596 (+14%) | 7mo | $365,000 | $229 | 69 |
| 6350 Portal Way #6 | 0.04mi | 2/2.0 (-1) | 1,319 (-6%) | 22mo | $315,000 | $239 | 65 |
Match score weights: distance 35% · size 25% · config 20% · recency 20%. Top-matched comps best support the ARV.
Projected returns pro-forma
-3.0% appreciation · 4.79% rent growth · sell at horizon
- IRR
- -16.1%
- Equity multiple
- 0.42×
- Total profit
- $-51,191
- Equity at exit
- $46,968
- IRR
- -4.8%
- Equity multiple
- 0.66×
- Total profit
- $-30,205
- Equity at exit
- $27,235
Cash invested: $88,200 (down + closing). Projections, not guarantees.
Landlord ↔ Tenant lean methodology
- Overall (STATE)
- 28 Tenant-Leaning
- State Washington
- 28 Tenant-Leaning · D+8
- County
- — inherits STATE
- City
- — inherits STATE
ZIP-level market 98248
- Rents YoY
- 4.8%
- Active inventory
- 232
- Price-to-rent
- 9.9×
Monthly cashflow live
- Estimated rent
- $2,655 medium interval (Pro) →
- Mortgage (P&I)
- −$1,652
- Tax est. 1.5%
- −$394 /mo · $4,725/yr
- Insurance
- −$131
- HOA
- −$0
- Vacancy / Maint / Mgmt
- −$558
- Net cashflow
- $-79
Break-even live
Sensitivity live
| Price | -10% $138 | -5% $29 | +0% $-79 | +5% $-188 | +10% $-297 |
|---|---|---|---|---|---|
| Rent | -10% $-289 | -5% $-184 | +0% $-79 | +5% $26 | +10% $130 |
| Rate | -1.0pp $79 | -0.5pp $1 | base $-79 | +0.5pp $-161 | +1.0pp $-244 |
UW: 25.0% down · 7.5% · 30yr · 1.5% tax · 5.0% vac · 8.0% maint · 8.0% mgmt
Financing live
Cash to close
- Down payment
- $78,750
- Closing costs
- $9,450
- Reserves months
- —
- Total cash needed
- —
Loan-product check · same deal, 3 products live
Conventional
25% down · 7.5% · 30yr
- Down + closing
- —
- Monthly P&I
- —
- Monthly cashflow
- —
- DSCR
- —
- Eligible?
- —
Personal DTI + credit; lowest rate.
DSCR
20% down · 8.5% · 30yr
- Down + closing
- —
- Monthly P&I
- —
- Monthly cashflow
- —
- DSCR
- —
- Eligible?
- —
No personal income docs; deal must DSCR.
Hard money
10% down · 12.0% · 12mo
- Down + closing
- —
- Monthly P&I
- —
- Monthly cashflow
- —
- DSCR
- —
- Eligible?
- —
Short-term bridge; refi at stabilization.
Rent comps 2 comps
| Address | Beds | Baths | Sqft | Rent | $/sqft | DOM | Units | Dist |
|---|---|---|---|---|---|---|---|---|
| 2274 Thornton St Ferndale, WA | 3.0 | 1.0 | 1100 | $2,500 | $2.27 | 15d | 1 | 1.23mi |
| 6160 Jupiter Pl Ferndale, WA | 4.0 | 1.0 | 1275 | $2,675 | $2.10 | 45d | 1 | 1.42mi |
Listing history 5 events
-
2026-05-15status Pending
-
2026-05-01$315,000 Active
-
2025-09-24soldstatus $300,000 Closed
-
2025-08-17status Pending
-
2025-06-25$310,000 Active
ⓘ Source: listings_history table (triggers on properties + properties_extension) + one-shot
backfill from property_details.listing_events for pre-trigger history.
Climate risk First Street
- Flood 1/10 Low FEMA zone X (unshaded) · 0% chance over 30 yrs
- Wildfire 3/10 Moderate
- Heat 3/10 Moderate 8 d/yr ≥82°F today · 19 d/yr by 30 yrs out
- Wind 1/10 Low
- Air quality 6/10 Major 10 unhealthy d/yr today · 11 by 30 yrs out
Nearby sold comps map
Loading sold comps map…
Walkable amenities ~0.75 mi
Loading nearby amenities…
Taxation est. · year 1
- Rental income
- $31,861
- − Mortgage interest
- −$17,645
- − Property taxes
- −$4,725
- − Insurance
- −$1,575
- − Repairs & maintenance
- −$2,549
- − Management
- −$2,549
- − Depreciation
- −$9,164
- Taxable loss
- −$6,345
- Est. tax savings @ 24.0%
- +$1,523
- After-tax cash flow
- $571/yr
For passive investors: Depreciation is non-cash, so a rental often shows a tax loss while cash-flowing — sheltering income. Rental losses are passive: they offset passive income freely, and up to $25,000/yr can offset ordinary (W-2) income if you actively participate and your MAGI is under $100k (phasing out to $0 by $150k); unused losses carry forward. On sale, claimed depreciation is recaptured at up to 25%, and gains may owe capital-gains tax (a 1031 exchange can defer both). Figures are a year-1 estimate at your 24.0% rate — not tax advice; consult a CPA.
Condition & rehab AI · 12 photos
This 'just like new' 1,404 sq ft home in the Portal Creek Park community is move-in ready with modern updates and low-maintenance features.
Value-add opportunities
- Both landscaping — enhances curb appeal and adds value
- Both paint exterior — improves curb appeal and adds value
Renovation cost estimate screening
Value-add ROI direction
- Both landscaping — enhances curb appeal and adds value ↑
- Both paint exterior — improves curb appeal and adds value ↑
ⓘ Cost ranges are severity-bucket heuristics (US national rule-of-thumb). Get contractor quotes + a written scope before underwriting a rehab budget.
Schools (NCES district)
- District
- Ferndale School District
- NCES district ID
- 5302850
- Math proficiency
- 43% ▲ 1.00%
- Reading proficiency
- 58% ▲ 4.00%
- Median HH income
- $59,413
- Composite
- 46.06/100
- National rank
- #5494
- State rank
- #138 of 291 in WA
Livability — Ferndale
- Score
- 81/100
- State rank
- #79
- US rank
- #1471
Category grades
Schools grade is shown separately in the Schools card above.
Census & demographics
- Census place
- Ferndale, WA
- County
- Whatcom County · 209,776 people
- City population
- 28,498
- Metro
- Bellingham, WA
- Population (ZIP)
- 28,498
- Household income
- $91,060
- Rent vs Own
- Severe rent burden
- 582.0
Population outlook (Whatcom County) Hauer SSP2
- Today (2025)
- 240,408 people
- By 2030
- 254,667 · +5.9%
- By 2040
- 281,365 · +17.0%
- By 2050
- 307,592 · +27.9%
- By 2075
- 375,576 · +56.2%
- By 2100
- 421,637 · +75.4%
Race, ethnicity, and origin ACS 2023
- Neighborhood character
- Predominantly White (75%)
- Race & ethnicity
- White 75% Hispanic / Latino 11% Two or more races 8% Asian 6% Native American 2%
- Hispanic origin (detail)
- Mexican 7%
- Common ancestry
- Iranian 5% Portuguese 4% Italian 4%
- Foreign-born
- 12% · Canada, China
- Languages at home
- 83% English-only · Spanish 6% Other Indo-European 5% Russian/Polish/Slavic 3%
Political lean MEDSL · Whatcom
- 2024 margin
- Strong D (+24.9) · D 60.8% · R 35.9% · Other 3.3%
- 2008→2024 swing
- +6.9pp toward D · 2008: 18.0pp · 2024: 24.9pp
- All cycles
- 2024: D+24.9 2020: D+23.9 2016: D+17.7 2012: D+12.1 2008: D+18.0
Not yet ingested
- Civics
- —
Market trends
- HPI YoY
- ▼ -427.43%
- Current HPI
- 407.6077
- Rent YoY
- ▲ 4.79%
- Metro
- Bellingham, WA
- State GDP YoY
- ▲ 4.65%
- F500 in state
- 22
Industry mix (Fortune 500 HQ in WA)
| Industry | F500 HQs | Revenue |
|---|---|---|
| Retail | 2 | $269B |
|
||
| Technology / Retail | 1 | $638B |
|
||
| Technology | 1 | $245B |
|
||
| Telecommunications | 1 | $38B |
|
||
| Food / Beverage | 1 | $36B |
|
||
| Automotive / Trucks | 1 | $34B |
|
||
Price history
+1.6% since first listed6 events — show timeline
- 2026-06-16 Sold (MLS) $315,000 NWMLS as Distributed by MLS Grid
- 2026-05-15 Pending — NWMLS as Distributed by MLS Grid
- 2026-05-01 Listed $315,000 NWMLS as Distributed by MLS Grid
- 2025-09-24 Sold (MLS) $300,000 NWMLS as Distributed by MLS Grid
- 2025-08-17 Pending — NWMLS as Distributed by MLS Grid
- 2025-06-25 Listed $310,000 NWMLS as Distributed by MLS Grid
Property tax history
-27.5%/yrLatest (2026): $571 · -74.2% YoY. Source: county tax records.
Cash-flow waterfall
monthlySold comps — $/sqft
last 12 mo · ≤1 miLoading sold comps…