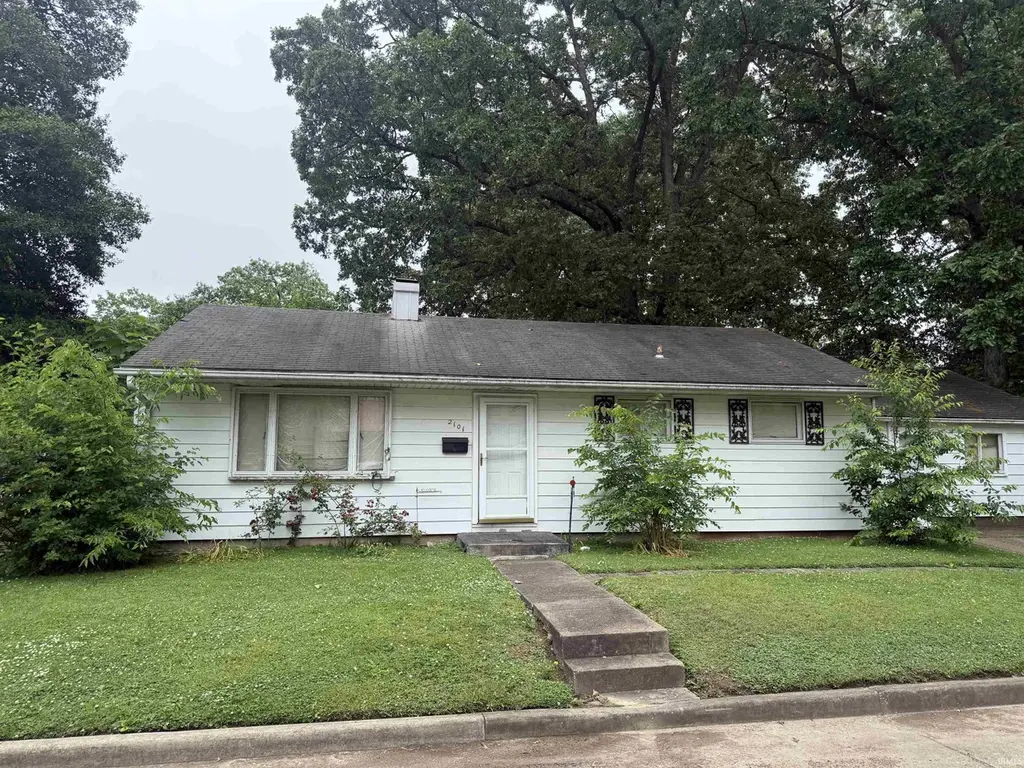
2101 Waggoner Ave · Evansville, IN
Flood risk 6/10 · Moderate
- FEMA flood zone
- X
- Chance of flooding over 30 yrs
- 0.75%
- Est. flood insurance / yr
- $507 – $1,088
Fire risk 1/10 · Minimal
- Est. fire insurance / yr
- $717 – $1,331
Heat risk 5/10 · Moderate
- Hot days now (above 107°F)
- 7 days/yr
- Hot days in 30 yrs
- 19 days/yr
Wind risk 2/10 · Minimal
- Chance of severe wind over 30 yrs
- 4.0%
Air-quality risk 3/10 · Minor
- Unhealthy air days now
- 3 days/yr
- Unhealthy air days in 30 yrs
- 4 days/yr
Risk factors via First Street. Map © Google.
Why this score? — see what drove the B+ grade
The composite is a weighted blend of 9 inputs, each scored 0–100. Each bar is that input's sub-score; the figure is the points it added to the 100-point composite (weight × sub-score).
- Cash flow +30.0/30.0
- ARV discount +15.0/15.0
- 1% rule +10.0/10.0
- DSCR +10.0/10.0
- Rent growth +4.5/5.0
- Schools +3.3/10.0
- Livability +3.2/5.0
- Condition / age +2.5/5.0
- Appreciation +0.0/10.0
$69,900
🖨 Deal sheet (PDF) 📄 Offer letter ✓ Due diligence
Listing remarks
Great Investment Opportunity!!! Don't miss this deal! This 3 bedroom 1 bath home is ready for new owners. Needs TLC but could be a great home for you or a great home to remodel and sell. Located on the corner of Spring and Waggoner and on a dead end. This 1 owner home is waiting for new life. It is ready to go and is being sold in AS IS condition. Generously sized living room with large picture window and coat closet. The full bath offers a tub/shower combination. There is also a family room which was once a garage but was closed in for extra living space. The pull down attic and 2 storage sheds make a great place for storage. Partially fenced in yard (chain link). Great location on a de
Key facts
- Dead end
- Pull down attic
- Family room
Tags
Property features AI
Finance
- HOA & community: No association amenities
Exterior
- Parking: Concrete parking
- Utilities: Public water; Public sewer; Cable available
- Home design: Single-family, site-built home; One story
- Construction: Aluminum and wood siding; Asphalt shingle roof; Slab and concrete perimeter foundation; Built as site-built residence
- Exterior features: Partial chain link fencing; Shed on property; Corner, level lot; Paved road access
Interior
- Kitchen: Dishwasher; Refrigerator; Electric range
- Bedrooms: Total of 5 rooms (bedroom count not specified)
- Flooring: Carpet; Vinyl
- Bathrooms: One full bathroom (main level)
- Heating & cooling: Natural gas forced air heating; Central air conditioning; Ceiling fans; Window air unit(s)
- Interior features: Ceiling fans; Eat-in kitchen; Laminate counters; Window treatments; One fireplace
- Laundry & utility: Electric dryer hookup on main level
Neighborhood map
What this means for you Summary
Snapshot
- This is a 2-bed/1.0-bath single-family listed at $70k.
Deal economics
- At list price, monthly cash flow is $405 ($5k/yr) — positive.
- The deal already cash-flows at list — no discount required.
- Meets the 1% rule at list price ($1k rent vs $70k).
- Cap rate 13.2% vs local median 4.6% in Evansville — top-decile yield for the area; either an underpriced asset or a hidden risk that comps aren't pricing in. Stress-test before assuming the spread holds.
Location & tenants
- Location reads 63/100 on livability (#416 in IN) — a middle-class / working-renter tenant base. Strengths: cost of living A+, housing A+, health & safety A+; Watch: crime F, commute F, employment D-.
- Evansville Vanderburgh School Corporation (urban): math 36% / reading 43% proficiency, ranked #153 of 301 in IN (top 51%) — families likely to look elsewhere, expect single-tenant / working-renter base with shorter leases.
- Zoned schools: Fairlawn Elementary School (math 22% / reading 22%, grade F, #790 of 994 statewide, top 81%, 422 students, 76% FRL); Mcgary Middle School (math 8% / reading 15%, grade F, #311 of 330 statewide, top 94%, 351 students, 81% FRL); William Henry Harrison High School (math 29% / reading 54%, grade F, #211 of 369 statewide, top 58%, 1,158 students, 61% FRL) — zoned schools average 72% FRL vs 50% district-wide (23 pts higher); higher-poverty schools than district average — tighter screening recommended.
- Zoned-school proficiency averages 25% at this address vs 40% district-wide (-14 pts) — the specific schools serving this property underperform the Evansville Vanderburgh School Corporation average; the district grade overstates school quality for this exact location.
- Market conditions: Rents rising fast (+7.9%/yr); 188 active listings in the ZIP; 22 comparable units currently listed for rent nearby; rentals at typical pace (median 22d on market — plan ~3-4 weeks tenant-placement turnaround); 508 units permitted in Vanderburgh County in 2024 (32 in 5+ unit buildings).
Forward outlook
- Local home prices are declining (-3.0%/yr); year-one equity from $483 of loan paydown is wiped out by about $2k of value loss. Plan a longer hold.
- At projected returns (-3.0% appreciation + 7.9% rent growth), your $20k cash investment doubles in ~5 years — after that, you're playing with house money.
Negotiation context
- Only 1 days on market — expect competitive offers; lowballing is unlikely to land.
Risks & watch-outs
- Watch-outs: built in 1953 — expect roof / HVAC / electrical / plumbing capex.
- Climate carrying-cost: major flood risk; extreme-heat days projected 7→19/yr by 2055 (HVAC capex compounding) — expect insurance premiums to compound above CPI over the hold.
Questions for the listing agent
- Built in 1953 — when were the roof, HVAC, electrical panel, plumbing, and water heater last replaced?
- Is there a deadline driving the sale (1031 exchange, divorce, estate, relocation)? That informs how much negotiation room exists.
- Schools are D-rated, which usually means shorter tenancies and higher turnover. Who's the typical renter profile here, and what's been the actual vacancy rate?
- Crime grade is F in this area — have there been break-ins, vandalism, or insurance claims at this property in the last 3 years? What carrier currently insures it and at what premium?
- What's the average days-on-market for RENTAL listings here right now (not sales)? A rising rental-DOM trend means longer vacancies and softer asking-rent achievability than the comps imply.
- What's the recent tenant-quality profile in this submarket — average credit score on applications, eviction rate, late-payment / NSF rate, and stable-employment percentage? A property-management company in the area should have these aggregated.
- How much new for-sale + rental construction is in the pipeline within 1–3 miles? Heavy new supply typically softens prices + rents 12–24 months out; constrained supply supports both.
Investment metrics
- 1% rule
- 1.61% ✓
- Cap rate
- 13.24%
- Cash-on-cash
- 24.82%
- DSCR
- 2.10
- GRM
- 5.2
CMA / ARV
- ARV (on-the-fly)
- $124,800
- Comps found
- 12
Show comp detail 12 sales within ~0.75 mi
| Address | Dist | Beds/Ba | Sqft | Sold | Price | $/sf | Match |
|---|---|---|---|---|---|---|---|
| 2101 Waggoner Ave | 0.00mi | 3/1.0 (+1) | 1,268 (+2%) | 1mo | $65,000 | $51 | 92 |
| 2118 Mahrendale Ave | 0.21mi | 3/1.5 (+1) | 1,276 (+2%) | 1mo | $115,000 | $90 | 78 |
| 2120 Monroe Ave | 0.35mi | 2/1.0 | 1,152 (-8%) | 2mo | $158,000 | $137 | 69 |
| 2416 Helmuth Ave | 0.51mi | 3/1.0 (+1) | 1,336 (+7%) | 0mo | $185,000 | $138 | 59 |
| 1425 Covert Ave | 0.59mi | 3/1.0 (+1) | 1,183 (-5%) | 1mo | $118,000 | $100 | 58 |
| 1107 S Boeke Rd | 0.59mi | 2/1.5 | 1,352 (+8%) | 2mo | $68,000 | $50 | 55 |
| 1809 Powell Ave | 0.75mi | 2/1.0 | 1,168 (-6%) | 1mo | $185,000 | $158 | 53 |
| 2013 Margybeth Ave | 0.52mi | 3/1.0 (+1) | 1,116 (-11%) | 1mo | $160,000 | $143 | 53 |
| 2300 Margybeth Ave | 0.53mi | 3/2.0 (+1) | 1,104 (-12%) | 2mo | $103,000 | $93 | 46 |
| 1414 Marshall Ave | 0.73mi | 3/1.0 (+1) | 1,364 (+9%) | 1mo | $122,000 | $89 | 45 |
| 1114 S Englewood Ave | 0.66mi | 3/1.0 (+1) | 1,108 (-11%) | 1mo | $154,000 | $139 | 44 |
| 1216 S Boeke Rd | 0.53mi | 3/2.0 (+1) | 1,088 (-13%) | 2mo | $103,000 | $95 | 44 |
Match score weights: distance 35% · size 25% · config 20% · recency 20%. Top-matched comps best support the ARV.
Projected returns pro-forma
-3.0% appreciation · 7.86% rent growth · sell at horizon
- IRR
- 23.6%
- Equity multiple
- 2.03×
- Total profit
- $20,239
- Equity at exit
- $10,422
- IRR
- 34.5%
- Equity multiple
- 4.94×
- Total profit
- $77,055
- Equity at exit
- $6,044
Cash invested: $19,572 (down + closing). Projections, not guarantees.
Landlord ↔ Tenant lean methodology
- Overall (STATE)
- 90 Strongly Landlord-Friendly
- State Indiana
- 90 Strongly Landlord-Friendly · R+11
- County
- — inherits STATE
- City
- — inherits STATE
ZIP-level market 47714
- Rents YoY
- 7.9%
- Active inventory
- 188
- Price-to-rent
- 5.2×
Monthly cashflow live
- Estimated rent
- $1,124 high interval (Pro) →
- Mortgage (P&I)
- −$367
- Tax est. 1.5%
- −$87 /mo · $1,048/yr
- Insurance
- −$29
- HOA
- −$0
- Vacancy / Maint / Mgmt
- −$236
- Net cashflow
- $405
Break-even live
Sensitivity live
| Price | -10% $453 | -5% $429 | +0% $405 | +5% $381 | +10% $357 |
|---|---|---|---|---|---|
| Rent | -10% $316 | -5% $360 | +0% $405 | +5% $449 | +10% $494 |
| Rate | -1.0pp $440 | -0.5pp $423 | base $405 | +0.5pp $387 | +1.0pp $368 |
UW: 25.0% down · 7.5% · 30yr · 1.5% tax · 5.0% vac · 8.0% maint · 8.0% mgmt
Financing live
Cash to close
- Down payment
- $17,475
- Closing costs
- $2,097
- Reserves months
- —
- Total cash needed
- —
Loan-product check · same deal, 3 products live
Conventional
25% down · 7.5% · 30yr
- Down + closing
- —
- Monthly P&I
- —
- Monthly cashflow
- —
- DSCR
- —
- Eligible?
- —
Personal DTI + credit; lowest rate.
DSCR
20% down · 8.5% · 30yr
- Down + closing
- —
- Monthly P&I
- —
- Monthly cashflow
- —
- DSCR
- —
- Eligible?
- —
No personal income docs; deal must DSCR.
Hard money
10% down · 12.0% · 12mo
- Down + closing
- —
- Monthly P&I
- —
- Monthly cashflow
- —
- DSCR
- —
- Eligible?
- —
Short-term bridge; refi at stabilization.
Rent comps 22 comps
| Address | Beds | Baths | Sqft | Rent | $/sqft | DOM | Units | Dist |
|---|---|---|---|---|---|---|---|---|
| 1762 Spring Ct Evansville, IN | 2.0 | 1.0 | 975 | $1,450 | $1.49 | 22d | 1 | 0.16mi |
| 1909 Taylor Ave Evansville, IN | 2.0 | 1.0 | 700 | $1,200 | $1.71 | 14d | 1 | 0.32mi |
| 1909 Plantation Ct Evansville, IN | 2.0 | 1.0 | 780 | $700 | $0.90 | 22d | 2 | 0.37mi |
| 1952 Colts Ln Evansville, IN | 1.0–3.0 | 1.0 | 1146 | $1,035 | $0.90 | 22d | 8 | 0.39mi |
| 2001 S Taft Ave Evansville, IN | 3.0 | 2.0 | 1472 | $1,000 | $0.68 | 22d | 1 | 0.44mi |
| 1505 Jackson Ave Evansville, IN | 2.0 | 1.0 | 780 | $995 | $1.28 | 22d | 1 | 0.60mi |
| 1713 Hawthorne Ave Evansville, IN | 3.0 | 2.0 | 1204 | $1,395 | $1.16 | 22d | 1 | 0.65mi |
| 2232 E Riverside Dr Evansville, IN | 2.0 | 1.0 | 810 | $1,200 | $1.48 | 14d | 1 | 0.67mi |
| 2947 Ravenswood Dr Unit 2927 Evansville, IN | 2.0 | 1.0 | 1150 | $975 | $0.85 | 22d | 1 | 0.74mi |
| 1500 S Harlan Ave Evansville, IN | 2.0 | 1.0 | 712 | $900 | $1.26 | 14d | 1 | 0.84mi |
| 2340 Sunburst Blvd Unit 2270-318 Evansville, IN | 2.0 | 1.0 | 815 | $900 | $1.10 | 22d | 1 | 0.85mi |
| 2340 Sunburst Blvd Unit 2200-202 Evansville, IN | 3.0 | 1.0 | 973 | $1,050 | $1.08 | 22d | 1 | 0.85mi |
| 900 S Saint James Blvd Evansville, IN | 3.0 | 2.0 | 1118 | $1,450 | $1.30 | 22d | 1 | 0.89mi |
| 2818 S Villa Dr Evansville, IN | 3.0 | 1.0 | 1061 | $1,295 | $1.22 | 22d | 1 | 1.08mi |
| 1604 Marbo Ave Evansville, IN | 2.0 | 1.0 | 900 | $1,095 | $1.22 | 22d | 1 | 1.14mi |
| 1021 Jefferson Ave Evansville, IN | 1.0 | 1.0 | 798 | $795 | $1.00 | 14d | 1 | 1.18mi |
| 1320 Lee Ct Evansville, IN | 1.0–4.0 | 1.0–1.5 | 1007 | $1,032 | $1.03 | 14d | 36 | 1.19mi |
| 3700 Justus Ct Evansville, IN | 1.0–2.0 | 1.0–2.0 | 790 | $975 | $1.23 | 22d | 1 | 1.20mi |
| 1133 Bayard Park Dr Unit B Evansville, IN | 2.0 | 1.0 | 990 | $800 | $0.81 | 22d | 1 | 1.25mi |
| 1411 Jeanette Ave Unit 1411 Evansville, IN | 3.0 | 1.5 | 1210 | $1,195 | $0.99 | 22d | 1 | 1.31mi |
| 210 S Weinbach Ave Evansville, IN | 3.0 | 1.0 | 1080 | $1,450 | $1.34 | 22d | 1 | 1.45mi |
| 715 E Riverside Dr Evansville, IN | 2.0 | 1.0 | 806 | $895 | $1.11 | 22d | 1 | 1.48mi |
Listing history 2 events
-
2026-05-24status Pending
-
2026-05-22$69,900 Active
ⓘ Source: listings_history table (triggers on properties + properties_extension) + one-shot
backfill from property_details.listing_events for pre-trigger history.
Climate risk First Street
- Flood 6/10 Major FEMA zone X · 75% chance over 30 yrs
- Wildfire 1/10 Low
- Heat 5/10 Major 7 d/yr ≥107°F today · 19 d/yr by 30 yrs out
- Wind 2/10 Low 4% chance of damaging wind over 30 yrs
- Air quality 3/10 Moderate 3 unhealthy d/yr today · 4 by 30 yrs out
Nearby sold comps map
Loading sold comps map…
Walkable amenities ~0.75 mi
Loading nearby amenities…
Taxation est. · year 1
- Rental income
- $13,487
- − Mortgage interest
- −$3,915
- − Property taxes
- −$1,048
- − Insurance
- −$350
- − Repairs & maintenance
- −$1,079
- − Management
- −$1,079
- − Depreciation
- −$2,033
- Taxable income
- $3,982
- Est. tax owed @ 24.0%
- −$956
- After-tax cash flow
- $3,902/yr
For passive investors: Depreciation is non-cash, so a rental often shows a tax loss while cash-flowing — sheltering income. Rental losses are passive: they offset passive income freely, and up to $25,000/yr can offset ordinary (W-2) income if you actively participate and your MAGI is under $100k (phasing out to $0 by $150k); unused losses carry forward. On sale, claimed depreciation is recaptured at up to 25%, and gains may owe capital-gains tax (a 1031 exchange can defer both). Figures are a year-1 estimate at your 24.0% rate — not tax advice; consult a CPA.
Schools (NCES district)
- District
- Evansville Vanderburgh School Corporation
- NCES district ID
- 1803450
- Math proficiency
- 36% ▼ -7.00%
- Reading proficiency
- 43% ▼ -3.00%
- Median HH income
- $43,270
- Composite
- 33.41/100
- National rank
- #5471
- State rank
- #153 of 301 in IN
Livability — Evansville
- Score
- 63/100
- State rank
- #416
- US rank
- #15047
Category grades
Schools grade is shown separately in the Schools card above.
Census & demographics
- Census place
- Evansville, IN
- County
- Vanderburgh County · 146,793 people
- City population
- 146,793
- Metro
- Evansville, IN-KY
- Population (ZIP)
- 32,132
- Household income
- $55,910
- Rent vs Own
- Severe rent burden
- 1394.0
Population outlook (Vanderburgh County) Hauer SSP2
- Today (2025)
- 187,038 people
- By 2030
- 188,907 · +1.0%
- By 2040
- 190,272 · +1.7%
- By 2050
- 188,871 · +1.0%
- By 2075
- 180,751 · -3.4%
- By 2100
- 163,015 · -12.8%
Race, ethnicity, and origin ACS 2023
- Neighborhood character
- Predominantly White (71%)
- Race & ethnicity
- White 71% Black 17% Two or more races 6% Hispanic / Latino 6% Asian 1%
- Hispanic origin (detail)
- Mexican 3%
- Common ancestry
- Italian 3% Lithuanian 2% Slovak 1%
- Foreign-born
- 6% · Canada, China
- Languages at home
- 92% English-only · Spanish 4% Other Asian/Pacific 1% French/Haitian/Cajun 1%
Political lean MEDSL · Vanderburgh
- 2024 margin
- R (+12.7) · D 43.0% · R 55.6% · Other 1.4%
- 2008→2024 swing
- -15.1pp toward R · 2008: 2.5pp · 2024: -12.7pp
- All cycles
- 2024: R+12.7 2020: R+9.6 2016: R+16.9 2012: R+10.8 2008: D+2.5
Not yet ingested
- Civics
- —
Market trends
- HPI YoY
- ▼ -124.80%
- Current HPI
- 211.1755
- Rent YoY
- ▲ 7.86%
- Metro
- Evansville, IN-KY
- State GDP YoY
- ▲ 2.90%
- F500 in state
- 18
Industry mix (Fortune 500 HQ in IN)
| Industry | F500 HQs | Revenue |
|---|---|---|
| Industrial Machinery | 2 | $37B |
|
||
| Healthcare | 1 | $177B |
|
||
| Pharmaceuticals | 1 | $45B |
|
||
| Metals / Steel | 1 | $18B |
|
||
| Agriculture | 1 | $17B |
|
||
| Packaging | 1 | $12B |
|
||
Price history
2 events — show timeline
- 2026-05-24 Pending — IRMLS
- 2026-05-22 Listed $69,900 IRMLS
Cash-flow waterfall
monthlySold comps — $/sqft
last 12 mo · ≤1 miLoading sold comps…