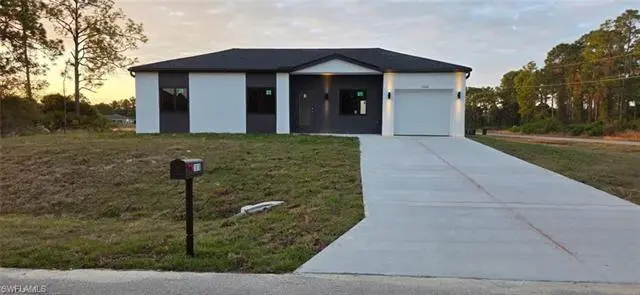
3309 26th St W · Lehigh Acres, FL
Flood risk 2/10 · Minimal
- FEMA flood zone
- X (unshaded)
- Chance of flooding over 30 yrs
- 0.07%
- Est. flood insurance / yr
- $507 – $1,088
Fire risk 4/10 · Minor
- Est. fire insurance / yr
- $947 – $1,759
Heat risk 10/10 · Severe
- Hot days now (above 107°F)
- 7 days/yr
- Hot days in 30 yrs
- 28 days/yr
Wind risk 10/10 · Severe
- Chance of severe wind over 30 yrs
- 99.0%
Air-quality risk 2/10 · Minimal
- Unhealthy air days now
- 1 days/yr
- Unhealthy air days in 30 yrs
- 1 days/yr
Risk factors via First Street. Map © Google.
Why this score? — see what drove the D+ grade
The composite is a weighted blend of 9 inputs, each scored 0–100. Each bar is that input's sub-score; the figure is the points it added to the 100-point composite (weight × sub-score).
- Cash flow +20.5/30.0
- ARV discount +7.5/15.0
- DSCR +6.5/10.0
- Schools +4.1/10.0
- 1% rule +4.0/10.0
- Livability +3.0/5.0
- Condition / age +2.5/5.0
- Rent growth +1.3/5.0
- Appreciation +0.0/10.0
$239,900
🖨 Deal sheet 📄 Offer letter ✓ Due diligence
Listing remarks MLS
This lot has to be sold with the adjoining lot at 3307 36th St. W in a package price for $13,000. Buyer to pay for title insurance.
Key facts
- Hurricane-proof
- 0.24 acre lot
- Garage
Tags
Property features AI
Finance
- Other: Zoning: RS-1; Lot is regular and was measured by survey; Lot dimensions approximately 80 x 125; Lot area about 0.2434 acres; No truck restriction
- Financial info: Taxes listed (see listing for details)
- HOA & community: Non-gated community; No HOA maintenance; No community amenities
Exterior
- Parking: Paved parking; Attached 1-car garage
- Security: Impact resistant doors and windows
- Utilities: Well water; Septic sewer; Central electric for heat and cooling; Cable available
- Home design: Residential single-family home; 1 story / ranch; Rear exposure facing east; Modular construction; Located in Lehigh Acres development
- Construction: Built in 2026; Modular construction; Stucco finish; Shingle roof
- Exterior features: Stucco exterior; Shingle roof; Impact resistant windows; Impact resistant doors; Windows: see remarks; Paved road access; Well for irrigation; Septic system
Interior
- Kitchen: Range; Microwave; Refrigerator; Dishwasher
- Bedrooms: 3 bedrooms
- Flooring: Laminate flooring
- Bathrooms: 2 full bathrooms; Master bathroom with shower only
- Heating & cooling: Central electric heat; Central electric cooling
- Interior features: Formal dining area; Courtyard floor plan; See remarks for additional interior details; Unfurnished
- Laundry & utility: Laundry in residence; Washer; Dryer; Auto garage door
Neighborhood map
What this means for you Summary
Snapshot
- This is a 3-bed/2.0-bath land listed at $240k.
Deal economics
- At list price, monthly cash flow is $315 ($4k/yr) — positive.
- The deal already cash-flows at list — no discount required.
- To meet the 1% rule (rent ≥ 1% of price), the offer needs to be $217k (9.5% below list).
- Recommended offer: $217k (9.5% below list) — sets the bar for 1% rule.
- Cap rate 7.9% vs local median 4.7% in Lehigh Acres — top-decile yield for the area; either an underpriced asset or a hidden risk that comps aren't pricing in. Stress-test before assuming the spread holds.
Location & tenants
- Location reads 59/100 on livability (#826 in FL) — a working-class tenant base; expect higher turnover. Strengths: cost of living A+, housing A+; Watch: crime C-, employment D+, schools D-.
- Lee (suburban): math 47% / reading 50% proficiency, ranked #42 of 73 in FL (top 58%) — families likely to look elsewhere, expect single-tenant / working-renter base with shorter leases.
- Market conditions: Rents falling (-4.7%/yr); 1335 active listings in the ZIP; 40 comparable units currently listed for rent nearby; rentals at typical pace (median 24d on market — plan ~3-4 weeks tenant-placement turnaround); solid renter incomes; 15,411 units permitted in Lee County in 2024 (4,686 in 5+ unit buildings).
- This rent runs 34% of the median local income ($78k/yr) — at the standard rent-burdened threshold; future hikes will face affordability resistance.
Forward outlook
- Local home prices are declining (-3.0%/yr); year-one equity from $2k of loan paydown is wiped out by about $7k of value loss. Plan a longer hold.
- Lee County population projected at +44% by 2050 — long-run rental-demand tailwind backs the buy-and-hold thesis.
Negotiation context
- It's been on market 70 days — a 6% lower offer ($226k) is reasonable based on typical stale-listing flexibility.
- 4 sale attempts since 10y ago with the ask held roughly flat each time — persistent listings suggest the price (not the market) is what's stuck; bring a comps-based counter.
Risks & watch-outs
- Climate carrying-cost: severe wind risk, 99% chance of damaging wind over 30y; extreme-heat days projected 7→28/yr by 2055 (HVAC capex compounding) — expect insurance premiums to compound above CPI over the hold.
Questions for the listing agent
- It's been on market 70 days. Have you received any prior offers? Is the seller open to a 10% concession, seller financing, or rate buy-down credit?
- Why hasn't it sold? Are there any deal-killer items the seller is aware of (foundation, flood, title, zoning, code violations)?
- Is there a deadline driving the sale (1031 exchange, divorce, estate, relocation)? That informs how much negotiation room exists.
- Schools are D-rated, which usually means shorter tenancies and higher turnover. Who's the typical renter profile here, and what's been the actual vacancy rate?
- The area grade is low — what's the realistic commute time and amenity access for the typical tenant pool here? Any planned neighborhood developments (good or bad) we should know about?
- What's the average days-on-market for RENTAL listings here right now (not sales)? A rising rental-DOM trend means longer vacancies and softer asking-rent achievability than the comps imply.
- What's the recent tenant-quality profile in this submarket — average credit score on applications, eviction rate, late-payment / NSF rate, and stable-employment percentage? A property-management company in the area should have these aggregated.
- How much new for-sale + rental construction is in the pipeline within 1–3 miles? Heavy new supply typically softens prices + rents 12–24 months out; constrained supply supports both.
Investment metrics
- 1% rule
- 0.90% ✗
- Cap rate
- 7.87%
- Cash-on-cash
- 5.62%
- DSCR
- 1.25
- GRM
- 9.2
CMA / ARV
No comps found within radius.
Projected returns pro-forma
-3.0% appreciation · 0.0% rent growth · sell at horizon
- IRR
- -10.6%
- Equity multiple
- 0.62×
- Total profit
- $-25,327
- Equity at exit
- $35,770
- IRR
- -5.6%
- Equity multiple
- 0.68×
- Total profit
- $-21,352
- Equity at exit
- $20,742
Cash invested: $67,172 (down + closing). Projections, not guarantees.
Landlord ↔ Tenant lean methodology
- Overall (STATE)
- 87 Strongly Landlord-Friendly
- State Florida
- 87 Strongly Landlord-Friendly · R+3
- County
- — inherits STATE
- City
- — inherits STATE
ZIP-level market 33971
- Home prices YoY
- -8.0%
- Rents YoY
- -4.7%
- Active inventory
- 1335
- Price-to-rent
- 9.2×
Monthly cashflow live
- Estimated rent
- $2,171 high interval (Pro) →
- Mortgage (P&I)
- −$1,258
- Tax from tax record
- −$42 /mo · $509/yr
- Insurance
- −$100
- HOA
- −$0
- Vacancy / Maint / Mgmt
- −$456
- Net cashflow
- $315
Break-even live
UW: 25.0% down · 7.5% · 30yr · 1.5% tax · 5.0% vac · 8.0% maint · 8.0% mgmt
Financing live
Cash to close
- Down payment
- $59,975
- Closing costs
- $7,197
- Reserves months
- —
- Total cash needed
- —
Loan-product check · same deal, 3 products live
Conventional
25% down · 7.5% · 30yr
- Down + closing
- —
- Monthly P&I
- —
- Monthly cashflow
- —
- DSCR
- —
- Eligible?
- —
Personal DTI + credit; lowest rate.
DSCR
20% down · 8.5% · 30yr
- Down + closing
- —
- Monthly P&I
- —
- Monthly cashflow
- —
- DSCR
- —
- Eligible?
- —
No personal income docs; deal must DSCR.
Hard money
10% down · 12.0% · 12mo
- Down + closing
- —
- Monthly P&I
- —
- Monthly cashflow
- —
- DSCR
- —
- Eligible?
- —
Short-term bridge; refi at stabilization.
Rent comps 40 comps
| Address | Beds | Baths | Sqft | Rent | $/sqft | DOM | Units | Dist |
|---|---|---|---|---|---|---|---|---|
| 3417 31st St W Lehigh Acres, FL | 3.0 | 2.0 | 1779 | $3,500 | $1.97 | 23d | 1 | 0.38mi |
| 3016 25th St W Lehigh Acres, FL | 3.0 | 2.0 | 1100 | $1,555 | $1.41 | 23d | 1 | 0.41mi |
| 3208 31st St W Lehigh Acres, FL | 3.0 | 2.0 | 1501 | $2,100 | $1.40 | 23d | 1 | 0.48mi |
| 3203 18th St W Lehigh Acres, FL | 3.0 | 2.5 | 1710 | $2,250 | $1.32 | 23d | 1 | 0.57mi |
| 3005 31st St W Lehigh Acres, FL | 3.0 | 2.0 | 1600 | $1,950 | $1.22 | 2d | 1 | 0.58mi |
| 1923 Sunniland Blvd Lehigh Acres, FL | 3.0 | 2.5 | 1638 | $2,200 | $1.34 | 23d | 1 | 0.61mi |
| 2917 22nd St W Lehigh Acres, FL | 4.0 | 2.0 | 1550 | $2,150 | $1.39 | 23d | 1 | 0.62mi |
| 2511 Sunniland Blvd Lehigh Acres, FL | 4.0 | 2.0 | 1811 | $1,900 | $1.05 | 3d | 1 | 0.65mi |
| 3313 35th St W Lehigh Acres, FL | 3.0 | 2.0 | 1458 | $1,950 | $1.34 | 23d | 1 | 0.67mi |
| 1906 Venice Ave N Lehigh Acres, FL | 4.0 | 2.0 | 1833 | $1,995 | $1.09 | 3d | 1 | 0.68mi |
| 2815 24th St W Lehigh Acres, FL | 4.0 | 2.0 | 1820 | $1,875 | $1.03 | 3d | 1 | 0.76mi |
| 3175 Sunshine Blvd Lehigh Acres, FL | 3.0 | 2.0 | 1633 | $2,100 | $1.29 | 2d | 1 | 0.78mi |
| 2918 16th St Lehigh Acres, FL | 3.0 | 2.0 | 1324 | $1,845 | $1.39 | 21d | 1 | 0.83mi |
| 3202 37th St W Lehigh Acres, FL | 3.0 | 2.5 | 1412 | $1,705 | $1.21 | 13d | 1 | 0.85mi |
| 2018 Xelda Ave N Lehigh Acres, FL | 3.0 | 2.0 | 1730 | $2,236 | $1.29 | 3d | 1 | 0.91mi |
| 2015 Xelda Ave N Lehigh Acres, FL | 3.0 | 2.0 | 1458 | $1,800 | $1.23 | 23d | 1 | 0.92mi |
| 3310 11th St W Lehigh Acres, FL | 3.0 | 2.5 | 1354 | $2,000 | $1.48 | 3d | 1 | 0.92mi |
| 3312 11th St W Lehigh Acres, FL | 3.0 | 2.5 | 1354 | $2,000 | $1.48 | 3d | 1 | 0.93mi |
| 2809 Darlene Pl Lehigh Acres, FL | 3.0 | 2.0 | 1600 | $2,000 | $1.25 | 23d | 1 | 0.98mi |
| 2913 14th St W Lehigh Acres, FL | 3.0 | 2.0 | 1629 | $2,400 | $1.47 | 1d | 1 | 0.99mi |
| 2913 14th St W Lehigh Acres, FL | 4.0 | 2.0 | 1629 | $2,300 | $1.41 | 23d | 1 | 0.99mi |
| 911 Sally Ave N Lehigh Acres, FL | 3.0 | 2.0 | 1144 | $1,521 | $1.33 | 3d | 1 | 1.01mi |
| 3309 10th St W Lehigh Acres, FL | 4.0 | 2.0 | 1575 | $2,199 | $1.40 | 11d | 1 | 1.02mi |
| 3405 Hanna Ave N Lehigh Acres, FL | 4.0 | 3.0 | 1698 | $2,200 | $1.30 | 23d | 1 | 1.04mi |
| 3315 Sunshine Blvd N Lehigh Acres, FL | 3.0 | 2.0 | 1630 | $2,000 | $1.23 | 3d | 1 | 1.05mi |
| 3310 9th St W Lehigh Acres, FL | 3.0 | 2.0 | 1488 | $2,300 | $1.55 | 15d | 1 | 1.05mi |
| 3109 10th St W Lehigh Acres, FL | 3.0 | 2.0 | 1472 | $1,950 | $1.32 | 23d | 1 | 1.07mi |
| 3208 9th St W Lehigh Acres, FL | 3.0 | 2.0 | 1423 | $1,916 | $1.35 | 3d | 1 | 1.07mi |
| 3005 40th St W Lehigh Acres, FL | 3.0 | 2.0 | 1272 | $2,000 | $1.57 | 3d | 1 | 1.07mi |
| 3732 16th St W Lehigh Acres, FL | 3.0 | 2.0 | 1362 | $2,100 | $1.54 | 23d | 1 | 1.08mi |
| 3732 16th St W Lehigh Acres, FL | 4.0 | 2.0 | 1362 | $2,000 | $1.47 | 3d | 1 | 1.08mi |
| 2400 Wanda Ave N Lehigh Acres, FL | 3.0 | 2.0 | 1198 | $2,000 | $1.67 | 23d | 1 | 1.11mi |
| 2608 25th St W Lehigh Acres, FL | 3.0 | 2.0 | 1633 | $2,300 | $1.41 | 23d | 1 | 1.12mi |
| 3005 41st St W Lehigh Acres, FL | 3.0 | 2.0 | 1853 | $2,250 | $1.21 | 23d | 1 | 1.12mi |
| 3731 15th St W Lehigh Acres, FL | 3.0 | 2.0 | 1406 | $1,670 | $1.19 | 3d | 1 | 1.13mi |
| 3506 9th St W Lehigh Acres, FL | 4.0 | 2.0 | 1820 | $2,800 | $1.54 | 23d | 1 | 1.14mi |
| 2615 19th St W Lehigh Acres, FL | 3.0 | 2.0 | 1698 | $2,000 | $1.18 | 23d | 1 | 1.16mi |
| 3109 8th St SW Lehigh Acres, FL | 3.0 | 2.0 | 1324 | $1,845 | $1.39 | 21d | 1 | 1.19mi |
| 2916 9th St W Lehigh Acres, FL | 3.0 | 2.0 | 1053 | $1,750 | $1.66 | 23d | 1 | 1.20mi |
| 2404 Crawford Ave N Lehigh Acres, FL | 3.0 | 2.0 | 1400 | $1,850 | $1.32 | 23d | 1 | 1.20mi |
Listing history 22 events
-
2026-06-09statusdays on market $239,900 Pending 70 DOM
-
2026-06-07days on market $239,900 Active 69 DOM
-
2026-06-03days on market $239,900 Active 65 DOM
-
2026-06-02status $239,900 Active 64 DOM
-
2026-03-24$239,900 Active
-
2025-10-30soldstatus $238,600
-
2025-02-12soldstatus $30,000
-
2024-04-06historical
-
2024-03-29soldstatus $29,900
-
2023-12-04$29,900 Active
-
2018-09-05soldstatus $10,500
-
2018-08-31soldstatus $5,250 Sold 132-char remark
Show marketing remark (132 chars)
This lot has to be sold with the adjoining lot at 3307 36th St. W in a package price for $13,000. Buyer to pay for title insurance.
-
2018-08-16status Pending 132-char remark
Show marketing remark (132 chars)
This lot has to be sold with the adjoining lot at 3307 36th St. W in a package price for $13,000. Buyer to pay for title insurance.
-
2018-07-31$6,500 Active 132-char remark
Show marketing remark (132 chars)
This lot has to be sold with the adjoining lot at 3307 36th St. W in a package price for $13,000. Buyer to pay for title insurance.
-
2016-08-10historical
-
2016-08-03soldstatus $8,000
-
2016-07-29status Pending
-
2016-07-19price $4,700
-
2016-03-21$9,500 Active
-
2016-03-21soldstatus $568,000
-
2016-03-21soldstatus $695,000
-
2016-03-21soldstatus $254,338
ⓘ Source: listings_history table (triggers on properties + properties_extension) + one-shot
backfill from property_details.listing_events for pre-trigger history.
Tax reassessment forecast FL · Resets to sale price
- Current annual tax
- $509 · $42/mo
- Projected year-2 tax
- $1,991 · $166/mo
- Expected delta
- +$1,483/yr (+$124/mo · 291.5%)
ⓘ Screening estimate from a state-policy table — verify with the county assessor before closing.
Climate risk First Street
- Flood 2/10 Low FEMA zone X (unshaded) · 7% chance over 30 yrs
- Wildfire 4/10 Moderate
- Heat 10/10 Extreme 7 d/yr ≥107°F today · 28 d/yr by 30 yrs out
- Wind 10/10 Extreme 99% chance of damaging wind over 30 yrs
- Air quality 2/10 Low 1 unhealthy d/yr today · 1 by 30 yrs out
Nearby sold comps map
Loading sold comps map…
Walkable amenities ~0.75 mi
Loading nearby amenities…
Taxation est. · year 1
- Rental income
- $26,050
- − Mortgage interest
- −$13,438
- − Property taxes
- −$509
- − Insurance
- −$1,200
- − Repairs & maintenance
- −$2,084
- − Management
- −$2,084
- − Depreciation
- −$6,979
- Taxable loss
- −$243
- Est. tax savings @ 24.0%
- +$58
- After-tax cash flow
- $3,833/yr
For passive investors: Depreciation is non-cash, so a rental often shows a tax loss while cash-flowing — sheltering income. Rental losses are passive: they offset passive income freely, and up to $25,000/yr can offset ordinary (W-2) income if you actively participate and your MAGI is under $100k (phasing out to $0 by $150k); unused losses carry forward. On sale, claimed depreciation is recaptured at up to 25%, and gains may owe capital-gains tax (a 1031 exchange can defer both). Figures are a year-1 estimate at your 24.0% rate — not tax advice; consult a CPA.
Schools (NCES district)
- District
- Lee
- NCES district ID
- 1201080
- Math proficiency
- 47% ▼ -11.00%
- Reading proficiency
- 50% ▼ -4.00%
- Median HH income
- $49,518
- Composite
- 41.49/100
- National rank
- #3458
- State rank
- #42 of 73 in FL
Livability — Lehigh Acres
- Score
- 59/100
- State rank
- #826
- US rank
- #20055
Category grades
Schools grade is shown separately in the Schools card above.
Census & demographics
- Census place
- Lehigh Acres, FL
- County
- Lee County · 788,662 people
- City population
- 130,638
- Metro
- Cape Coral-Fort Myers, FL
- Population (ZIP)
- 30,790
- Household income
- $77,723
- Rent vs Own
- Severe rent burden
- 587.0
Population outlook (Lee County) Hauer SSP2
- Today (2025)
- 871,946 people
- By 2030
- 955,468 · +9.6%
- By 2040
- 1,113,587 · +27.7%
- By 2050
- 1,256,891 · +44.1%
- By 2075
- 1,560,270 · +78.9%
- By 2100
- 1,726,848 · +98.0%
Race, ethnicity, and origin ACS 2023
- Neighborhood character
- Diverse neighborhood (Simpson 0.65)
- Race & ethnicity
- Hispanic / Latino 49% Two or more races 32% White 26% Black 19% Asian 2%
- Hispanic origin (detail)
- Mexican 9% Puerto Rican 13% Cuban 14% Dominican 2%
- Common ancestry
- Hispanic 7% Estonian 1% Romanian 1%
- Foreign-born
- 31% · Canada, Vietnam, Guatemala
- Languages at home
- 46% English-only · Spanish 41% French/Haitian/Cajun 9% Other Indo-European 2%
Political lean MEDSL · Lee
- 2024 margin
- Strong R (+28.4) · D 35.5% · R 63.9%
- 2008→2024 swing
- -18.0pp toward R · 2008: -10.4pp · 2024: -28.4pp
- All cycles
- 2024: R+28.4 2020: R+19.2 2016: R+20.4 2012: R+16.6 2008: R+10.4
Not yet ingested
- Civics
- —
Market trends
- HPI YoY
- ▼ -27.68%
- Current HPI
- 317.7147
- Rent YoY
- ▼ -4.69%
- Metro
- Cape Coral-Fort Myers, FL
- State GDP YoY
- ▲ 3.28%
- F500 in state
- 36
Industry mix (Fortune 500 HQ in FL)
| Industry | F500 HQs | Revenue |
|---|---|---|
| Industrial Technology | 2 | $29B |
|
||
| Insurance | 2 | $17B |
|
||
| Retail | 1 | $60B |
|
||
| Technology Distribution | 1 | $58B |
|
||
| Homebuilding | 1 | $35B |
|
||
| Technology Manufacturing | 1 | $35B |
|
||
Price history
-57.8% since first listed18 events — show timeline
- 2026-03-24 Listed $239,900 NAPLESMLS
- 2025-10-30 Sold (Public Records) $238,600 Public Records
- 2025-02-12 Sold (Public Records) $30,000 Public Records
- 2024-04-06 Listing Removed — FORTMLS
- 2024-03-29 Sold (Public Records) $29,900 Public Records
- 2023-12-04 Listed $29,900 FORTMLS
- 2018-09-05 Sold (Public Records) $10,500 Public Records
- 2018-08-31 Sold (MLS) $5,250 FORTMLS
- 2018-08-16 Pending — FORTMLS
- 2018-07-31 Listed $6,500 FORTMLS
- 2016-08-10 Listing Removed — FORTMLS
- 2016-08-03 Sold (Public Records) $8,000 Public Records
- 2016-07-29 Pending — FORTMLS
- 2016-07-19 Price Changed $4,700 FORTMLS
- 2016-03-21 Listed $9,500 FORTMLS
- 2016-03-21 Sold (Public Records) $254,338 Public Records
- 2016-03-21 Sold (Public Records) $695,000 Public Records
- 2016-03-21 Sold (Public Records) $568,000 Public Records
Property tax history
+12.9%/yrLatest (2025): $509 · +30.3% YoY. Source: county tax records.
Cash-flow waterfall
monthlySold comps — $/sqft
last 12 mo · ≤1 miLoading sold comps…