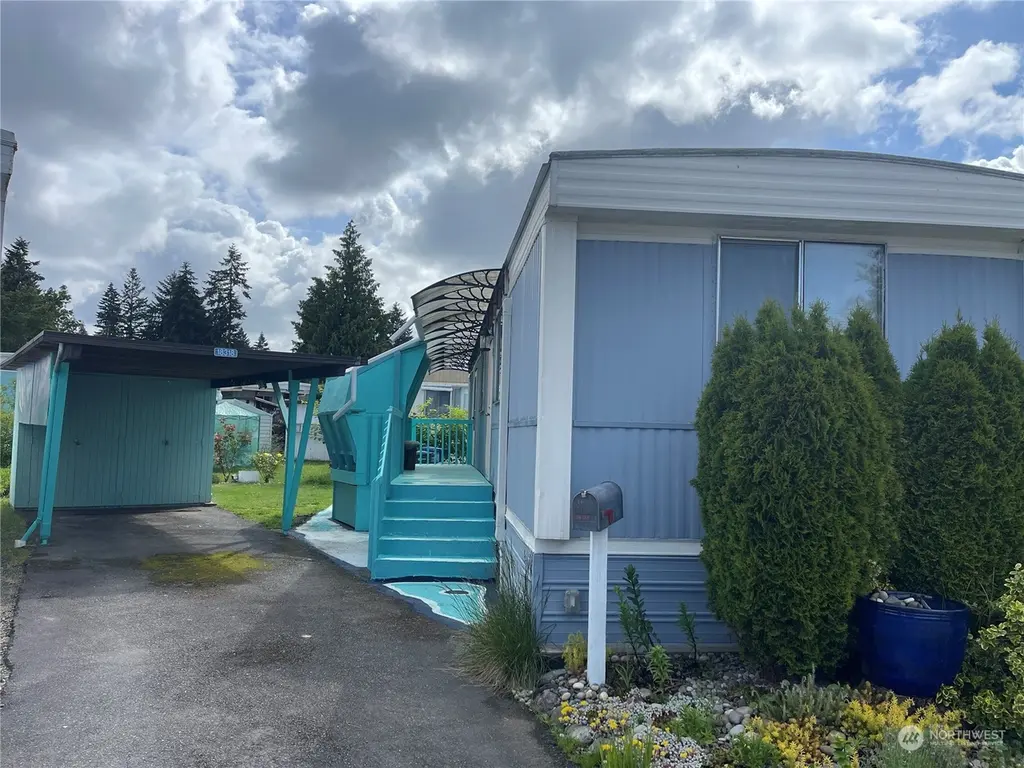
18318 35th Ave S #368 · SeaTac, WA
Flood risk 1/10 · Minimal
- FEMA flood zone
- X (unshaded)
- Chance of flooding over 30 yrs
- 0.0%
- Est. flood insurance / yr
- $507 – $1,088
Fire risk 1/10 · Minimal
- Est. fire insurance / yr
- $604 – $1,122
Heat risk 3/10 · Minor
- Hot days now (above 88°F)
- 7 days/yr
- Hot days in 30 yrs
- 15 days/yr
Wind risk 1/10 · Minimal
- Chance of severe wind over 30 yrs
- —
Air-quality risk 7/10 · Major
- Unhealthy air days now
- 9 days/yr
- Unhealthy air days in 30 yrs
- 10 days/yr
Risk factors via First Street. Map © Google.
Why this score? — see what drove the C- grade
The composite is a weighted blend of 9 inputs, each scored 0–100. Each bar is that input's sub-score; the figure is the points it added to the 100-point composite (weight × sub-score).
- Cash flow +15.0/30.0
- ARV discount +15.0/15.0
- 1% rule +5.0/10.0
- DSCR +5.0/10.0
- Schools +3.9/10.0
- Livability +3.9/5.0
- Condition / age +2.5/5.0
- Rent growth +2.3/5.0
- Appreciation +0.0/10.0
$37,500
🖨 Deal sheet 📄 Offer letter ✓ Due diligence
Listing remarks
* * * HUGE BUYER BONUS + SELLER FINANCING OFFER! * * * Bow Lake offers a blend of the quiet comforts of home w/ big city vibes! Resort living at SeaTac's Premiere 55+ Community. Well taken care of with unique features inside & out; custom covered deck w/ additional storage underneath, large corner lot w/ room for gardens. Fully Furnished & move in ready. Ductless MiniSplit A/C unit for cozy climate control. Spacious primary bedroom with walk-in closet & new wall heater. Kitchen w/ lots of cabinets and formal Dining area. Bright & light Living room with lots of room for entertaining. Very desirable gated community has it all: Clubhouse, Pool, Spa, Gym, Hot tub, L
Key facts
- Gated community
- Clubhouse
- Hot tub
Tags
Neighborhood map
What this means for you Summary
Snapshot
- This is a 2-bed/1.0-bath manufactured listed at $38k.
Deal economics
- At list price, monthly cash flow is $1k ($15k/yr) — positive.
- The deal already cash-flows at list — no discount required.
- Meets the 1% rule at list price ($2k rent vs $38k).
- Recommended offer: $33k (12.0% below list) — sets the bar for market timing.
- Cap rate 45.0% vs local median 3.1% in SeaTac — top-decile yield for the area; either an underpriced asset or a hidden risk that comps aren't pricing in. Stress-test before assuming the spread holds.
Location & tenants
- Location reads 78/100 on livability (#118 in WA, #2,417 nationally) — a middle-class / working-renter tenant base. Strengths: commute A+, housing A+, health & safety A+; Watch: schools F, crime F, cost of living F.
- Highline School District (suburban): math 36% / reading 49% proficiency, ranked #200 of 291 in WA (top 69%) — families likely to look elsewhere, expect single-tenant / working-renter base with shorter leases.
- Market conditions: Rents soft (-0.7%/yr); 96 active listings in the ZIP; 21 comparable units currently listed for rent nearby; rentals leasing fast (median 13d on market — plan ~1-2 weeks tenant-placement turnaround); solid renter incomes; 10,555 units permitted in King County in 2024 (7,119 in 5+ unit buildings).
Forward outlook
- Local home prices are declining (-3.0%/yr); year-one equity from $259 of loan paydown is wiped out by about $1k of value loss. Plan a longer hold.
- King County population projected at +44% by 2050 — long-run rental-demand tailwind backs the buy-and-hold thesis.
- At projected returns (-3.0% appreciation + 0.0% rent growth), your $10k cash investment doubles in ~1 year — after that, you're playing with house money.
Negotiation context
- It's been on market 749 days — a 12% lower offer ($33k) is reasonable based on typical stale-listing flexibility.
Questions for the listing agent
- It's been on market 749 days. Have you received any prior offers? Is the seller open to a 12% concession, seller financing, or rate buy-down credit?
- Built in 1975 — when were the roof, HVAC, electrical panel, plumbing, and water heater last replaced?
- Why hasn't it sold? Are there any deal-killer items the seller is aware of (foundation, flood, title, zoning, code violations)?
- Is there a deadline driving the sale (1031 exchange, divorce, estate, relocation)? That informs how much negotiation room exists.
- Schools are F-rated, which usually means shorter tenancies and higher turnover. Who's the typical renter profile here, and what's been the actual vacancy rate?
- Crime grade is F in this area — have there been break-ins, vandalism, or insurance claims at this property in the last 3 years? What carrier currently insures it and at what premium?
- What's the average days-on-market for RENTAL listings here right now (not sales)? A rising rental-DOM trend means longer vacancies and softer asking-rent achievability than the comps imply.
- What's the recent tenant-quality profile in this submarket — average credit score on applications, eviction rate, late-payment / NSF rate, and stable-employment percentage? A property-management company in the area should have these aggregated.
- How much new for-sale + rental construction is in the pipeline within 1–3 miles? Heavy new supply typically softens prices + rents 12–24 months out; constrained supply supports both.
Investment metrics
- 1% rule
- 4.96% ✓
- Cap rate
- 45.02%
- Cash-on-cash
- 138.32%
- DSCR
- 7.15
- GRM
- 1.7
CMA / ARV
- ARV (median comp)
- $62,753
- List price
- $37,500
- Delta
- -40.24%
- Verdict
- UNDERPRICED
- Comps
- 10 within 1.0 mi
Show comp detail 8 sales within ~0.75 mi
| Address | Dist | Beds/Ba | Sqft | Sold | Price | $/sf | Match |
|---|---|---|---|---|---|---|---|
| 18306 35th Ave S #365 | 0.03mi | 2/1.0 | 648 (+4%) | 8mo | $99,900 | $154 | 86 |
| 3407 S 180th Pl #61 | 0.18mi | 2/1.0 | 648 (+4%) | 10mo | $98,000 | $151 | 77 |
| 3219 S 181st Pl #127 | 0.18mi | 1/1.0 (-1) | 670 (+7%) | 2mo | $84,900 | $127 | 73 |
| 18222 35th Ave S #361 | 0.05mi | 2/1.0 | 648 (+4%) | 22mo | $108,000 | $167 | 72 |
| 18305 35th Ave S #357 | 0.02mi | 2/1.5 | 540 (-14%) | 4mo | $23,500 | $44 | 71 |
| 3261 S 182nd Pl #227 | 0.07mi | 2/1.0 | 648 (+4%) | 24mo | $110,000 | $170 | 70 |
| 3432 S 181st Pl #120 | 0.14mi | 1/1.0 (-1) | 690 (+11%) | 2mo | $50,500 | $73 | 69 |
| 3215 S 181ST Pl | 0.18mi | 2/1.0 | 700 (+12%) | 6mo | $60,000 | $86 | 66 |
Match score weights: distance 35% · size 25% · config 20% · recency 20%. Top-matched comps best support the ARV.
Projected returns pro-forma
-3.0% appreciation · 0.0% rent growth · sell at horizon
- IRR
- —
- Equity multiple
- 7.25×
- Total profit
- $65,587
- Equity at exit
- $5,591
- IRR
- —
- Equity multiple
- 13.90×
- Total profit
- $135,421
- Equity at exit
- $3,242
Cash invested: $10,500 (down + closing). Projections, not guarantees.
Landlord ↔ Tenant lean methodology
- Overall (STATE)
- 28 Tenant-Leaning
- State Washington
- 28 Tenant-Leaning · D+8
- County
- — inherits STATE
- City
- — inherits STATE
ZIP-level market 98188
- Rents YoY
- -0.7%
- Active inventory
- 96
- Price-to-rent
- 1.7×
Monthly cashflow live
- Estimated rent
- $1,860 high interval (Pro) →
- Mortgage (P&I)
- −$197
- Tax est. 1.5%
- −$47 /mo · $562/yr
- Insurance
- −$16
- HOA
- −$0
- Vacancy / Maint / Mgmt
- −$391
- Net cashflow
- $1,210
Break-even live
UW: 25.0% down · 7.5% · 30yr · 1.5% tax · 5.0% vac · 8.0% maint · 8.0% mgmt
Financing live
Cash to close
- Down payment
- $9,375
- Closing costs
- $1,125
- Reserves months
- —
- Total cash needed
- —
Loan-product check · same deal, 3 products live
Conventional
25% down · 7.5% · 30yr
- Down + closing
- —
- Monthly P&I
- —
- Monthly cashflow
- —
- DSCR
- —
- Eligible?
- —
Personal DTI + credit; lowest rate.
DSCR
20% down · 8.5% · 30yr
- Down + closing
- —
- Monthly P&I
- —
- Monthly cashflow
- —
- DSCR
- —
- Eligible?
- —
No personal income docs; deal must DSCR.
Hard money
10% down · 12.0% · 12mo
- Down + closing
- —
- Monthly P&I
- —
- Monthly cashflow
- —
- DSCR
- —
- Eligible?
- —
Short-term bridge; refi at stabilization.
Rent comps 21 comps
| Address | Beds | Baths | Sqft | Rent | $/sqft | DOM | Units | Dist |
|---|---|---|---|---|---|---|---|---|
| 17840 32nd Ave S Seatac, WA | 1.0–2.0 | 1.0–1.5 | 757 | $2,000 | $2.64 | 12d | 3 | 0.31mi |
| 3508 S 180th St Seatac, WA | 1.0–2.0 | 1.0–2.0 | 793 | $2,025 | $2.55 | 12d | 4 | 0.34mi |
| 3425 S 176th St #128 Seatac, WA | 1.0 | 1.0 | 534 | $1,500 | $2.81 | 43d | 1 | 0.43mi |
| 3445 S 176th St #401 Seatac, WA | 1.0 | 1.0 | 608 | $1,400 | $2.30 | 14d | 1 | 0.49mi |
| 3445 S 176th St #401 Seatac, WA | 1.0 | 1.0 | 608 | $1,450 | $2.38 | 43d | 1 | 0.49mi |
| 3351 S 175th St Seatac, WA | 1.0 | 1.0 | 665 | $1,850 | $2.78 | 1d | 4 | 0.54mi |
| 3117 S 192nd St Seatac, WA | 1.0 | 1.0 | 676 | $1,722 | $2.55 | 1d | 2 | 0.57mi |
| 4410 S 173rd St Seatac, WA | 2.0 | 1.0 | 723 | $2,100 | $2.90 | 43d | 1 | 0.86mi |
| 19707 International Blvd Seatac, WA | 2.0 | 1.0 | 614 | $1,799 | $2.93 | 1d | 20 | 0.96mi |
| 19800 International Blvd Seatac, WA | 1.0–2.0 | 1.0–1.5 | 790 | $2,210 | $2.80 | 1d | 13 | 0.97mi |
| 4807 S 172nd Pl Seatac, WA | 2.0 | 1.0 | 700 | $2,550 | $3.64 | 43d | 1 | 1.04mi |
| 19912 Military Rd S SeaTac, WA | 1.0 | 1.0 | 656 | $1,495 | $2.28 | 43d | 1 | 1.05mi |
| 16700 31st Ave S Seatac, WA | 1.0 | 1.0 | 750 | $1,498 | $2.00 | 43d | 2 | 1.08mi |
| 2929 S 200th St Seatac, WA | 2.0 | 1.0–2.0 | 703 | $2,975 | $4.23 | 16d | 12 | 1.12mi |
| 2929 S 200th St Seatac, WA | 2.0 | 1.0–2.0 | 703 | $2,975 | $4.23 | 1d | 7 | 1.12mi |
| 2650 S 200th St Seatac, WA | 1.0 | 1.0 | 566 | $1,767 | $3.12 | 43d | 1 | 1.14mi |
| 20036 30th Ave S Unit S8 SeaTac, WA | 2.0 | 1.0 | 750 | $1,795 | $2.39 | 24d | 1 | 1.16mi |
| 20036 30th Ave S Unit S9 SeaTac, WA | 2.0 | 1.0 | 750 | $1,795 | $2.39 | 10d | 1 | 1.16mi |
| 3231 S 204th St Seatac, WA | 1.0–3.0 | 1.0–2.0 | 917 | $2,080 | $2.27 | 1d | 7 | 1.37mi |
| 3100 S 208th St Seatac, WA | 1.0–2.0 | 1.0–2.0 | 811 | $2,050 | $2.53 | 10d | 4 | 1.46mi |
| 3445 S 160th St Seattle, WA | 1.0–2.0 | 1.0 | 730 | $1,800 | $2.47 | 3d | 5 | 1.50mi |
Listing history 17 events
-
2026-06-18days on market $37,500 Active 749 DOM
-
2026-06-17days on market $37,500 Active 748 DOM
-
2026-06-16days on market $37,500 Active 747 DOM
-
2026-06-15days on market $37,500 Active 746 DOM
-
2026-06-13days on market $37,500 Active 744 DOM
-
2026-06-09days on market $37,500 Active 740 DOM
-
2026-06-08days on market $37,500 Active 739 DOM
-
2026-06-07days on market $37,500 Active 738 DOM
-
2026-06-04days on market $37,500 Active 735 DOM
-
2026-06-03days on market $37,500 Active 734 DOM
-
2026-06-02days on market $37,500 Active 733 DOM
-
2026-06-01days on market $37,500 Active 732 DOM
-
2026-05-31days on market $37,500 Active 731 DOM
-
2026-01-25price $37,500
-
2025-08-28price $48,500
-
2024-11-30price $45,000
-
2024-05-30$40,000 Active
ⓘ Source: listings_history table (triggers on properties + properties_extension) + one-shot
backfill from property_details.listing_events for pre-trigger history.
Climate risk First Street
- Flood 1/10 Low FEMA zone X (unshaded) · 0% chance over 30 yrs
- Wildfire 1/10 Low
- Heat 3/10 Moderate 7 d/yr ≥88°F today · 15 d/yr by 30 yrs out
- Wind 1/10 Low
- Air quality 7/10 Severe 9 unhealthy d/yr today · 10 by 30 yrs out
Nearby sold comps map
Loading sold comps map…
Walkable amenities ~0.75 mi
Loading nearby amenities…
Taxation est. · year 1
- Rental income
- $22,321
- − Mortgage interest
- −$2,101
- − Property taxes
- −$562
- − Insurance
- −$188
- − Repairs & maintenance
- −$1,786
- − Management
- −$1,786
- − Depreciation
- −$1,091
- Taxable income
- $14,808
- Est. tax owed @ 24.0%
- −$3,554
- After-tax cash flow
- $10,970/yr
For passive investors: Depreciation is non-cash, so a rental often shows a tax loss while cash-flowing — sheltering income. Rental losses are passive: they offset passive income freely, and up to $25,000/yr can offset ordinary (W-2) income if you actively participate and your MAGI is under $100k (phasing out to $0 by $150k); unused losses carry forward. On sale, claimed depreciation is recaptured at up to 25%, and gains may owe capital-gains tax (a 1031 exchange can defer both). Figures are a year-1 estimate at your 24.0% rate — not tax advice; consult a CPA.
Schools (NCES district)
- District
- Highline School District
- NCES district ID
- 5303540
- Math proficiency
- 36% ▼ -4.00%
- Reading proficiency
- 49% ▼ -1.00%
- Median HH income
- $52,697
- Composite
- 39.12/100
- National rank
- #8245
- State rank
- #200 of 291 in WA
Livability — SeaTac
- Score
- 78/100
- State rank
- #118
- US rank
- #2417
Category grades
Schools grade is shown separately in the Schools card above.
Census & demographics
- Census place
- SeaTac, WA
- County
- King County · 2,251,916 people
- City population
- 62,839
- Metro
- Seattle-Tacoma-Bellevue, WA
- Population (ZIP)
- 27,311
- Household income
- $76,438
- Rent vs Own
- Severe rent burden
- 1341.0
Population outlook (King County) Hauer SSP2
- Today (2025)
- 2,576,485 people
- By 2030
- 2,803,316 · +8.8%
- By 2040
- 3,255,921 · +26.4%
- By 2050
- 3,706,444 · +43.9%
- By 2075
- 4,746,063 · +84.2%
- By 2100
- 5,407,730 · +109.9%
Race, ethnicity, and origin ACS 2023
- Neighborhood character
- Highly diverse neighborhood (Simpson 0.79)
- Race & ethnicity
- White 28% Black 26% Hispanic / Latino 21% Asian 15% Two or more races 10% Pacific Islander 3%
- Hispanic origin (detail)
- Mexican 16%
- Common ancestry
- Lithuanian 2% Portuguese 2% Italian 1%
- Foreign-born
- 41% · Canada, Vietnam, Philippines
- Languages at home
- 52% English-only · Spanish 15% Other Asian/Pacific 6% Other Indo-European 3%
Political lean MEDSL · King
- 2024 margin
- Solid D (+51.7) · D 74.2% · R 22.5% · Other 3.4%
- 2008→2024 swing
- +9.6pp toward D · 2008: 42.1pp · 2024: 51.7pp
- All cycles
- 2024: D+51.7 2020: D+52.7 2016: D+50.4 2012: D+39.9 2008: D+42.1
Not yet ingested
- Civics
- —
Market trends
- HPI YoY
- ▼ -595.95%
- Current HPI
- 334.4203
- Rent YoY
- ▼ -0.68%
- Metro
- Seattle-Tacoma-Bellevue, WA
- State GDP YoY
- ▲ 4.65%
- F500 in state
- 22
Industry mix (Fortune 500 HQ in WA)
| Industry | F500 HQs | Revenue |
|---|---|---|
| Retail | 2 | $269B |
|
||
| Technology / Retail | 1 | $638B |
|
||
| Technology | 1 | $245B |
|
||
| Telecommunications | 1 | $38B |
|
||
| Food / Beverage | 1 | $36B |
|
||
| Automotive / Trucks | 1 | $34B |
|
||
Price history
-6.2% since first listed4 events — show timeline
- 2026-01-25 Price Changed $37,500 NWMLS as Distributed by MLS Grid
- 2025-08-28 Price Changed $48,500 NWMLS as Distributed by MLS Grid
- 2024-11-30 Price Changed $45,000 NWMLS as Distributed by MLS Grid
- 2024-05-30 Listed $40,000 NWMLS as Distributed by MLS Grid
Cash-flow waterfall
monthlySold comps — $/sqft
last 12 mo · ≤1 miLoading sold comps…