5379 Old Redwood Hwy #14 · Larkfield-Wikiup, CA
Flood risk 2/10 · Minimal
- FEMA flood zone
- X (unshaded)
- Chance of flooding over 30 yrs
- 0.03%
- Est. flood insurance / yr
- $507 – $1,088
Fire risk 6/10 · Moderate
- Est. fire insurance / yr
- $659 – $1,223
Heat risk 4/10 · Minor
- Hot days now (above 90°F)
- 7 days/yr
- Hot days in 30 yrs
- 15 days/yr
Wind risk 1/10 · Minimal
- Chance of severe wind over 30 yrs
- —
Air-quality risk 9/10 · Severe
- Unhealthy air days now
- 18 days/yr
- Unhealthy air days in 30 yrs
- 20 days/yr
Risk factors via First Street. Map © Google.
Why this score? — see what drove the C+ grade
The composite is a weighted blend of 9 inputs, each scored 0–100. Each bar is that input's sub-score; the figure is the points it added to the 100-point composite (weight × sub-score).
- Cash flow +30.0/30.0
- 1% rule +10.0/10.0
- DSCR +10.0/10.0
- Schools +3.7/10.0
- Rent growth +2.5/5.0
- Livability +2.5/5.0
- Condition / age +2.5/5.0
- ARV discount +0.0/15.0
- Appreciation +0.0/10.0
$150,000
🖨 Deal sheet 📄 Offer letter ✓ Due diligence
Listing remarks
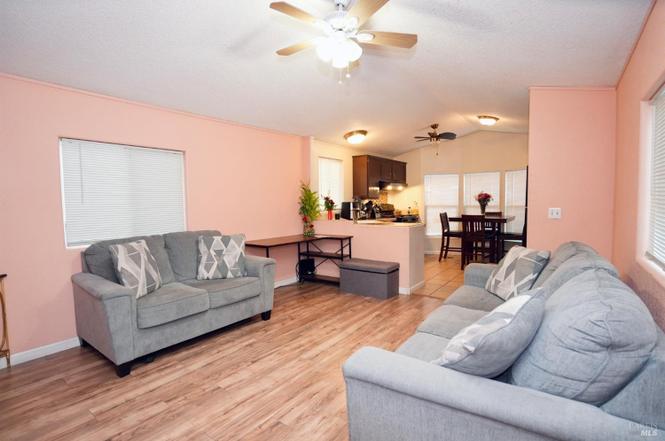
Welcome to this charming 2-bedroom, 1-bath manufactured home located in an all-age park in beautiful Santa Rosa. Offering comfort, affordability, and convenience, this cozy home is the perfect opportunity for a first-time homebuyer or anyone looking to enjoy Wine Country living at an accessible price point. Inside, you'll find a functional layout filled with natural light, creating a warm and inviting space that's ideal for starting your homeownership journey or downsizing with ease. With low space rent close proximity to everyday conveniences like Sutter Hospital, Airport Stadium 12 Cinema, Charles M. Schulz-Sonoma County Airport, and great local coffee spots. This is a fantastic opportuni
Key facts
- Low space rent
- Manufactured home
- Natural light
Tags
Property features AI
Finance
- Financial info: Monthly land lease: $885
- HOA & community: No homeowners association; Not a senior community
Exterior
- Parking: Assigned parking for 2 vehicles
- Utilities: Individual gas meter; Internet available; Public sewer
- Home design: Manufactured in-park home; Single wide
- Construction: Manufactured by Fleetwood Homes CA INC (Westfield model); Wood skirting
- Exterior features: Located in Orchard Mobile Home Park; Individual gas meter; Internet available; Public sewer
Interior
- Bedrooms: 2 bedrooms
- Bathrooms: 1 full bathroom with tub
- Heating & cooling: Central heating; Central cooling
- Interior features: Laundry area includes washer and dryer (included)
- Laundry & utility: Washer and dryer provided
Neighborhood map
What this means for you Summary
Snapshot
- This is a 2-bed/1.0-bath manufactured listed at $150k.
Deal economics
- At list price, monthly cash flow is $1k ($13k/yr) — positive.
- The deal already cash-flows at list — no discount required.
- Meets the 1% rule at list price ($3k rent vs $150k).
- Recommended offer: $132k (12.0% below list) — sets the bar for market timing.
- Cap rate 15.2% vs local median 2.1% in Larkfield-Wikiup — top-decile yield for the area; either an underpriced asset or a hidden risk that comps aren't pricing in. Stress-test before assuming the spread holds.
Location & tenants
- Location reads: area grade C — affects rentability + tenant quality, not the cash-flow math above.
- Santa Rosa High (urban): math 31% / reading 47% proficiency, ranked #703 of 1,400 in CA (top 50%) — families likely to look elsewhere, expect single-tenant / working-renter base with shorter leases.
- Market conditions: Rents flat; 199 active listings in the ZIP; 7 comparable units currently listed for rent nearby; rentals leasing fast (median 13d on market — plan ~1-2 weeks tenant-placement turnaround); solid renter incomes; 1,039 units permitted in Sonoma County in 2024 (185 in 5+ unit buildings).
- This rent runs 31% of the median local income ($98k/yr) — at the standard rent-burdened threshold; future hikes will face affordability resistance.
Forward outlook
- Local home prices are declining (-3.0%/yr); year-one equity from $1k of loan paydown is wiped out by about $4k of value loss. Plan a longer hold.
- Sonoma County population projected at +8% by 2050 — modest demand growth; plan on rents tracking national, not racing it.
- At projected returns (-3.0% appreciation + 0.1% rent growth), your $42k cash investment doubles in ~5 years — after that, you're playing with house money.
Negotiation context
- It's been on market 122 days — a 12% lower offer ($132k) is reasonable based on typical stale-listing flexibility.
Risks & watch-outs
- Climate carrying-cost: major wildfire risk — expect insurance premiums to compound above CPI over the hold.
Questions for the listing agent
- It's been on market 122 days. Have you received any prior offers? Is the seller open to a 12% concession, seller financing, or rate buy-down credit?
- Why hasn't it sold? Are there any deal-killer items the seller is aware of (foundation, flood, title, zoning, code violations)?
- Is there a deadline driving the sale (1031 exchange, divorce, estate, relocation)? That informs how much negotiation room exists.
- What's the average days-on-market for RENTAL listings here right now (not sales)? A rising rental-DOM trend means longer vacancies and softer asking-rent achievability than the comps imply.
- What's the recent tenant-quality profile in this submarket — average credit score on applications, eviction rate, late-payment / NSF rate, and stable-employment percentage? A property-management company in the area should have these aggregated.
- How much new for-sale + rental construction is in the pipeline within 1–3 miles? Heavy new supply typically softens prices + rents 12–24 months out; constrained supply supports both.
Investment metrics
- 1% rule
- 1.68% ✓
- Cap rate
- 15.19%
- Cash-on-cash
- 31.78%
- DSCR
- 2.41
- GRM
- 4.9
CMA / ARV
- ARV (on-the-fly)
- $119,952
- Comps found
- 12
Show comp detail 12 sales within ~0.75 mi
| Address | Dist | Beds/Ba | Sqft | Sold | Price | $/sf | Match |
|---|---|---|---|---|---|---|---|
| 5481 Ranchito Way | 0.22mi | 2/1.0 | 784 (0%) | 7mo | $72,500 | $92 | 84 |
| 5501 Ranchito Way | 0.23mi | 2/2.0 | 840 (+7%) | 2mo | $130,000 | $155 | 72 |
| 5342 Rexford Way | 0.05mi | 2/2.0 | 720 (-8%) | 11mo | $149,999 | $208 | 71 |
| 5341 Huckleberry Way | 0.04mi | 2/2.0 | 880 (+12%) | 11mo | $180,000 | $205 | 64 |
| 546 Colonial Park Dr | 0.67mi | 2/1.0 | 800 (+2%) | 4mo | $120,000 | $150 | 62 |
| 504 Colonial Park Dr | 0.71mi | 2/1.0 | 800 (+2%) | 5mo | $95,000 | $119 | 59 |
| 623 Colonial Park Dr | 0.60mi | 2/1.0 | 800 (+2%) | 13mo | $98,000 | $123 | 58 |
| 445 Colonial Park Dr | 0.74mi | 2/1.0 | 800 (+2%) | 8mo | $90,000 | $113 | 55 |
| 5212 Whispering Creek Dr | 0.60mi | 2/2.0 | 800 (+2%) | 13mo | $197,000 | $246 | 54 |
| 70 Colonial Park Dr | 0.55mi | 2/1.5 | 750 (-4%) | 18mo | $115,000 | $153 | 50 |
| 23 Ellie Dr | 0.74mi | 2/2.0 | 840 (+7%) | 6mo | $122,700 | $146 | 44 |
| 48 Colonial Park Dr | 0.53mi | 1/1.0 (-1) | 700 (-11%) | 11mo | $114,000 | $163 | 43 |
Match score weights: distance 35% · size 25% · config 20% · recency 20%. Top-matched comps best support the ARV.
Projected returns pro-forma
-3.0% appreciation · 0.1% rent growth · sell at horizon
- IRR
- 23.6%
- Equity multiple
- 1.94×
- Total profit
- $39,324
- Equity at exit
- $22,365
- IRR
- 29.7%
- Equity multiple
- 3.32×
- Total profit
- $97,512
- Equity at exit
- $12,969
Cash invested: $42,000 (down + closing). Projections, not guarantees.
Landlord ↔ Tenant lean methodology
- Overall (STATE)
- 18 Strongly Tenant-Friendly
- State California
- 18 Strongly Tenant-Friendly · D+13
- County
- — inherits STATE
- City
- — inherits STATE
ZIP-level market 95403
- Rents YoY
- 0.1%
- Active inventory
- 199
- Price-to-rent
- 4.9×
Monthly cashflow live
- Estimated rent
- $2,525 high interval (Pro) →
- Mortgage (P&I)
- −$787
- Tax from tax record
- −$34 /mo · $402/yr
- Insurance
- −$62
- HOA
- −$0
- Vacancy / Maint / Mgmt
- −$530
- Net cashflow
- $1,112
Break-even live
UW: 25.0% down · 7.5% · 30yr · 1.5% tax · 5.0% vac · 8.0% maint · 8.0% mgmt
Financing live
Cash to close
- Down payment
- $37,500
- Closing costs
- $4,500
- Reserves months
- —
- Total cash needed
- —
Loan-product check · same deal, 3 products live
Conventional
25% down · 7.5% · 30yr
- Down + closing
- —
- Monthly P&I
- —
- Monthly cashflow
- —
- DSCR
- —
- Eligible?
- —
Personal DTI + credit; lowest rate.
DSCR
20% down · 8.5% · 30yr
- Down + closing
- —
- Monthly P&I
- —
- Monthly cashflow
- —
- DSCR
- —
- Eligible?
- —
No personal income docs; deal must DSCR.
Hard money
10% down · 12.0% · 12mo
- Down + closing
- —
- Monthly P&I
- —
- Monthly cashflow
- —
- DSCR
- —
- Eligible?
- —
Short-term bridge; refi at stabilization.
Rent comps 7 comps
| Address | Beds | Baths | Sqft | Rent | $/sqft | DOM | Units | Dist |
|---|---|---|---|---|---|---|---|---|
| 193 Airport Blvd E Santa Rosa, CA | 1.0–2.0 | 1.0–1.5 | 967 | $2,760 | $2.85 | 12d | 1 | 0.25mi |
| 5222 Fulton Rd Unit 12 Santa Rosa, CA | 1.0 | 1.0 | 620 | $1,950 | $3.15 | 13d | 1 | 0.26mi |
| 5256 Old Redwood Hwy Unit 31 Santa Rosa, CA | 2.0 | 2.0 | 950 | $2,200 | $2.32 | 13d | 1 | 0.32mi |
| 5252 Old Redwood Hwy Unit 20 Santa Rosa, CA | 2.0 | 1.0 | 900 | $2,000 | $2.22 | 13d | 1 | 0.33mi |
| 5223 Old Redwood Hwy Santa Rosa, CA | 2.0 | 1.0 | 915 | $3,200 | $3.50 | 12d | 1 | 0.46mi |
| 5209 Old Redwood Hwy Santa Rosa, CA | 2.0 | 2.0 | 1014 | $2,450 | $2.42 | 21d | 1 | 0.51mi |
| 211 Shiloh Rd Windsor, CA | 2.0 | 1.0 | 814 | $3,095 | $3.80 | 13d | 1 | 1.28mi |
Listing history 17 events
-
2026-06-18days on market $150,000 Active 122 DOM
-
2026-06-17days on market $150,000 Active 121 DOM
-
2026-06-16days on market $150,000 Active 120 DOM
-
2026-06-15days on market $150,000 Active 119 DOM
-
2026-06-14days on market $150,000 Active 117 DOM
-
2026-06-13days on market $150,000 Active 116 DOM
-
2026-06-10days on market $150,000 Active 114 DOM
-
2026-06-09days on market $150,000 Active 113 DOM
-
2026-06-08days on market $150,000 Active 112 DOM
-
2026-06-07days on market $150,000 Active 111 DOM
-
2026-06-03days on market $150,000 Active 107 DOM
-
2026-06-02days on market $150,000 Active 106 DOM
-
2026-06-01days on market $150,000 Active 105 DOM
-
2026-05-31days on market $150,000 Active 104 DOM
-
2026-05-30days on market $150,000 Active 103 DOM
-
2026-03-25price $150,000
-
2026-02-16$160,000 Active
ⓘ Source: listings_history table (triggers on properties + properties_extension) + one-shot
backfill from property_details.listing_events for pre-trigger history.
Tax reassessment forecast CA · Resets to sale price
- Current annual tax
- $402 · $34/mo
- Projected year-2 tax
- $1,140 · $95/mo
- Expected delta
- +$738/yr (+$61/mo · 183.4%)
ⓘ Screening estimate from a state-policy table — verify with the county assessor before closing.
Climate risk First Street
- Flood 2/10 Low FEMA zone X (unshaded) · 3% chance over 30 yrs
- Wildfire 6/10 Major
- Heat 4/10 Moderate 7 d/yr ≥90°F today · 15 d/yr by 30 yrs out
- Wind 1/10 Low
- Air quality 9/10 Extreme 18 unhealthy d/yr today · 20 by 30 yrs out
Nearby sold comps map
Loading sold comps map…
Walkable amenities ~0.75 mi
Loading nearby amenities…
Taxation est. · year 1
- Rental income
- $30,304
- − Mortgage interest
- −$8,402
- − Property taxes
- −$402
- − Insurance
- −$750
- − Repairs & maintenance
- −$2,424
- − Management
- −$2,424
- − Depreciation
- −$4,364
- Taxable income
- $11,537
- Est. tax owed @ 24.0%
- −$2,769
- After-tax cash flow
- $10,580/yr
For passive investors: Depreciation is non-cash, so a rental often shows a tax loss while cash-flowing — sheltering income. Rental losses are passive: they offset passive income freely, and up to $25,000/yr can offset ordinary (W-2) income if you actively participate and your MAGI is under $100k (phasing out to $0 by $150k); unused losses carry forward. On sale, claimed depreciation is recaptured at up to 25%, and gains may owe capital-gains tax (a 1031 exchange can defer both). Figures are a year-1 estimate at your 24.0% rate — not tax advice; consult a CPA.
Schools (NCES district)
- District
- Santa Rosa High
- NCES district ID
- 0635830
- Math proficiency
- 31% —
- Reading proficiency
- 47% —
- Median HH income
- $62,000
- Composite
- 37.25/100
- National rank
- #8972
- State rank
- #703 of 1400 in CA
Livability — Larkfield-Wikiup
No livability data for this city. (Only ~50 U.S. cities are tracked.)
Census & demographics
- Census place
- Larkfield-Wikiup, CA
- County
- Sonoma County · 449,805 people
- City population
- 45,570
- Metro
- Santa Rosa-Petaluma, CA
- Population (ZIP)
- 45,806
- Household income
- $98,191
- Rent vs Own
- Severe rent burden
- 1770.0
Population outlook (Sonoma County) Hauer SSP2
- Today (2025)
- 539,935 people
- By 2030
- 554,870 · +2.8%
- By 2040
- 573,262 · +6.2%
- By 2050
- 580,715 · +7.6%
- By 2075
- 579,229 · +7.3%
- By 2100
- 547,835 · +1.5%
Race, ethnicity, and origin ACS 2023
- Neighborhood character
- Diverse neighborhood (Simpson 0.61)
- Race & ethnicity
- White 50% Hispanic / Latino 37% Two or more races 13% Asian 5% Native American 2% Black 2%
- Hispanic origin (detail)
- Mexican 31%
- Common ancestry
- Italian 3% Slovak 2% Lithuanian 2%
- Foreign-born
- 20% · Canada, Vietnam, South Korea
- Languages at home
- 67% English-only · Spanish 26% Other Indo-European 1% Vietnamese 1%
Political lean MEDSL · Sonoma
- 2024 margin
- Solid D (+46.2) · D 71.4% · R 25.2% · Other 3.3%
- 2008→2024 swing
- -3.4pp toward R · 2008: 49.6pp · 2024: 46.2pp
- All cycles
- 2024: D+46.2 2020: D+51.5 2016: D+47.9 2012: D+44.9 2008: D+49.6
Not yet ingested
- Civics
- —
Market trends
- HPI YoY
- ▼ -679.94%
- Current HPI
- 254.3106
- Rent YoY
- ▲ 0.10%
- Metro
- Santa Rosa-Petaluma, CA
- State GDP YoY
- ▲ 3.21%
- F500 in state
- 116
Industry mix (Fortune 500 HQ in CA)
| Industry | F500 HQs | Revenue |
|---|---|---|
| Technology | 27 | $1,492B |
|
||
| Financial Services | 3 | $174B |
|
||
| Retail | 3 | $44B |
|
||
| Insurance | 3 | $26B |
|
||
| Media / Entertainment | 2 | $115B |
|
||
| Pharmaceuticals / Biotech | 2 | $62B |
|
||
Price history
-6.2% since first listed2 events — show timeline
- 2026-03-25 Price Changed $150,000 BAREIS
- 2026-02-16 Listed $160,000 BAREIS
Property tax history
+2.7%/yrLatest (2025): $402 · -0.4% YoY. Source: county tax records.
Cash-flow waterfall
monthlySold comps — $/sqft
last 12 mo · ≤1 miLoading sold comps…