1106 50th Avenue Dr W · South Bradenton, FL
Flood risk 1/10 · Minimal
- FEMA flood zone
- X (unshaded)
- Chance of flooding over 30 yrs
- 0.0%
- Est. flood insurance / yr
- $507 – $1,088
Fire risk 1/10 · Minimal
- Est. fire insurance / yr
- $947 – $1,759
Heat risk 10/10 · Severe
- Hot days now (above 107°F)
- 7 days/yr
- Hot days in 30 yrs
- 29 days/yr
Wind risk 10/10 · Severe
- Chance of severe wind over 30 yrs
- 99.0%
Air-quality risk 3/10 · Minor
- Unhealthy air days now
- 2 days/yr
- Unhealthy air days in 30 yrs
- 2 days/yr
Risk factors via First Street. Map © Google.
Why this score? — see what drove the C+ grade
The composite is a weighted blend of 9 inputs, each scored 0–100. Each bar is that input's sub-score; the figure is the points it added to the 100-point composite (weight × sub-score).
- Cash flow +30.0/30.0
- DSCR +10.0/10.0
- 1% rule +8.1/10.0
- Schools +4.4/10.0
- Livability +3.9/5.0
- Condition / age +2.5/5.0
- Rent growth +1.1/5.0
- ARV discount +0.0/15.0
- Appreciation +0.0/10.0
$89,997
🖨 Deal sheet (PDF) 📄 Offer letter ✓ Due diligence
Listing remarks
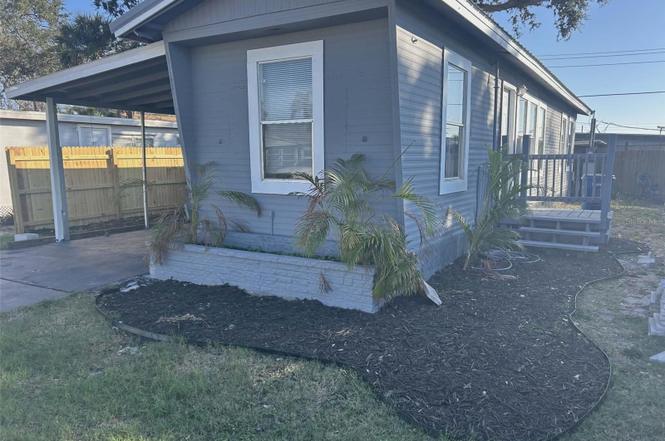
Welcome to 1106 50th Ave in Bradenton — an updated single-wide home offering an affordable opportunity for homeownership or investment. Recent updates give the home a refreshed feel, making it move-in ready and easy to maintain. The interior offers a functional layout with comfortable living space, while the property provides room to enjoy Florida’s outdoor lifestyle. Conveniently located near shopping, dining, and major roadways, this home offers simple living in a central Bradenton location. A great option for buyers seeking value, convenience, and low-maintenance living.
Key facts
- 2,278 sq ft lot
- Parking
- Built 1962
Property features AI
Finance
- Other: Condo land included
- Financial info: No lease restrictions
- HOA & community: No association
Exterior
- Parking: Carport (1 space)
- Utilities: Public water; Public sewer; Electricity available
- Home design: Manufactured home (single wide); One level; North-facing
- Construction: Frame construction; Metal roof; Slab foundation; Built on a 0.05-acre lot
- Exterior features: Paved road access
Interior
- Kitchen: Dishwasher; Range; Microwave; Refrigerator
- Bedrooms: 1 bedroom
- Flooring: Carpet; Other
- Bathrooms: 1 full bathroom
- Heating & cooling: Ductless heating; Wall/Window cooling units
- Interior features: Other interior features
- Laundry & utility: Washer; Dryer; Other laundry features
Neighborhood map
What this means for you Summary
Snapshot
- This is a 1-bed/1.0-bath manufactured listed at $90k.
Deal economics
- At list price, monthly cash flow is $365 ($4k/yr) — positive.
- The deal already cash-flows at list — no discount required.
- Meets the 1% rule at list price ($1k rent vs $90k).
- Recommended offer: $79k (12.0% below list) — sets the bar for market timing.
- Cap rate 11.2% vs local median 4.1% in South Bradenton — top-decile yield for the area; either an underpriced asset or a hidden risk that comps aren't pricing in. Stress-test before assuming the spread holds.
Location & tenants
- Location reads 77/100 on livability (#195 in FL, #3,092 nationally) — a middle-class / working-renter tenant base. Strengths: cost of living A+, housing A+, health & safety A+; Watch: amenities C-, crime D+, commute F.
- Manatee (suburban): math 54% / reading 50% proficiency, ranked #26 of 73 in FL (top 36%) — acceptable for families but not a draw, mixed tenant base, ~2y average lease.
- Zoned schools: G D Rogers Garden- Bullock Elementary (math 28% / reading 25%, grade F, #2,009 of 2,144 statewide, top 94%, 504 students, 78% FRL); W. D. Sugg Middle School (math 34% / reading 28%, grade F, #462 of 571 statewide, top 81%, 1,010 students, 72% FRL); Southeast High School (math 25% / reading 34%, grade F, #447 of 667 statewide, top 68%, 1,716 students, 66% FRL) — zoned schools average 72% FRL vs 51% district-wide (21 pts higher); higher-poverty schools than district average — tighter screening recommended.
- Zoned-school proficiency averages 29% at this address vs 52% district-wide (-23 pts) — the specific schools serving this property underperform the Manatee average; the district grade overstates school quality for this exact location.
- Market conditions: Rents falling (-5.5%/yr); 362 active listings in the ZIP; 7,472 units permitted in Manatee County in 2024 (1,782 in 5+ unit buildings).
Forward outlook
- Local home prices are declining (-3.0%/yr); year-one equity from $622 of loan paydown is wiped out by about $3k of value loss. Plan a longer hold.
- Manatee County population projected at +43% by 2050 — long-run rental-demand tailwind backs the buy-and-hold thesis.
- At projected returns (-3.0% appreciation + 0.0% rent growth), your $25k cash investment doubles in ~10 years — after that, you're playing with house money.
Negotiation context
- It's been on market 161 days — a 12% lower offer ($79k) is reasonable based on typical stale-listing flexibility.
- 3 sale attempts since 3y ago; this cycle's ask is 6839% above the opening price — seller raised mid-cycle; expect resistance to lowballs.
- Current owner paid $25k; list at $90k implies a 260% gain — meaningful room to come down on a strong offer.
Risks & watch-outs
- Climate carrying-cost: severe wind risk, 99% chance of damaging wind over 30y; extreme-heat days projected 7→29/yr by 2055 (HVAC capex compounding) — expect insurance premiums to compound above CPI over the hold.
Questions for the listing agent
- It's been on market 161 days. Have you received any prior offers? Is the seller open to a 12% concession, seller financing, or rate buy-down credit?
- Built in 1962 — when were the roof, HVAC, electrical panel, plumbing, and water heater last replaced?
- Why hasn't it sold? Are there any deal-killer items the seller is aware of (foundation, flood, title, zoning, code violations)?
- Is there a deadline driving the sale (1031 exchange, divorce, estate, relocation)? That informs how much negotiation room exists.
- Schools are B-rated — typically a magnet for longer-tenancy family renters. What's the average tenant stay here, and is there a school-zone premium baked into asking?
- Crime grade is D in this area — have there been break-ins, vandalism, or insurance claims at this property in the last 3 years? What carrier currently insures it and at what premium?
- What's the average days-on-market for RENTAL listings here right now (not sales)? A rising rental-DOM trend means longer vacancies and softer asking-rent achievability than the comps imply.
- What's the recent tenant-quality profile in this submarket — average credit score on applications, eviction rate, late-payment / NSF rate, and stable-employment percentage? A property-management company in the area should have these aggregated.
- How much new for-sale + rental construction is in the pipeline within 1–3 miles? Heavy new supply typically softens prices + rents 12–24 months out; constrained supply supports both.
Investment metrics
- 1% rule
- 1.31% ✓
- Cap rate
- 11.17%
- Cash-on-cash
- 17.40%
- DSCR
- 1.77
- GRM
- 6.4
CMA / ARV
- ARV (on-the-fly)
- $67,200
- Comps found
- 9
Show comp detail 9 sales within ~0.75 mi
| Address | Dist | Beds/Ba | Sqft | Sold | Price | $/sf | Match |
|---|---|---|---|---|---|---|---|
| 1017 51st Avenue Dr W | 0.11mi | 1/1.0 | 440 (-8%) | 5mo | $70,000 | $159 | 77 |
| 1109 49th Avenue Dr W | 0.11mi | 1/1.0 | 427 (-11%) | 2mo | $70,900 | $166 | 75 |
| 618 51st Ave W | 0.28mi | 2/1.5 (+1) | 470 (-2%) | 6mo | $66,000 | $140 | 72 |
| 709 49th Avenue Dr W | 0.24mi | 1/1.0 | 528 (+10%) | 2mo | $30,000 | $57 | 70 |
| 1107 49th Ave W | 0.14mi | 2/1.0 (+1) | 450 (-6%) | 10mo | $55,000 | $122 | 70 |
| 611 51st Avenue Plz W | 0.31mi | 2/1.0 (+1) | 460 (-4%) | 14mo | $65,000 | $141 | 62 |
| 704 49th Ave W | 0.28mi | 1/1.0 | 410 (-15%) | 5mo | $59,900 | $146 | 59 |
| 108 51st Avenue Ter W | 0.63mi | 1/1.0 | 520 (+8%) | 8mo | $57,000 | $110 | 50 |
| 619 52nd Ave W | 0.32mi | 2/2.0 (+1) | 550 (+15%) | 5mo | $60,000 | $109 | 48 |
Match score weights: distance 35% · size 25% · config 20% · recency 20%. Top-matched comps best support the ARV.
Projected returns pro-forma
-3.0% appreciation · 0.0% rent growth · sell at horizon
- IRR
- 5.5%
- Equity multiple
- 1.21×
- Total profit
- $5,222
- Equity at exit
- $13,419
- IRR
- 12.2%
- Equity multiple
- 1.84×
- Total profit
- $21,100
- Equity at exit
- $7,781
Cash invested: $25,199 (down + closing). Projections, not guarantees.
Landlord ↔ Tenant lean methodology
- Overall (STATE)
- 87 Strongly Landlord-Friendly
- State Florida
- 87 Strongly Landlord-Friendly · R+3
- County
- — inherits STATE
- City
- — inherits STATE
ZIP-level market 34207
- Rents YoY
- -5.5%
- Active inventory
- 362
- Price-to-rent
- 6.4×
Monthly cashflow live
- Estimated rent
- $1,179 medium interval (Pro) →
- Mortgage (P&I)
- −$472
- Tax from tax record
- −$56 /mo · $676/yr
- Insurance
- −$37
- HOA
- −$0
- Vacancy / Maint / Mgmt
- −$248
- Net cashflow
- $365
Break-even live
Sensitivity live
| Price | -10% $416 | -5% $391 | +0% $365 | +5% $340 | +10% $315 |
|---|---|---|---|---|---|
| Rent | -10% $272 | -5% $319 | +0% $365 | +5% $412 | +10% $459 |
| Rate | -1.0pp $411 | -0.5pp $388 | base $365 | +0.5pp $342 | +1.0pp $318 |
UW: 25.0% down · 7.5% · 30yr · 1.5% tax · 5.0% vac · 8.0% maint · 8.0% mgmt
Financing live
Cash to close
- Down payment
- $22,499
- Closing costs
- $2,700
- Reserves months
- —
- Total cash needed
- —
Loan-product check · same deal, 3 products live
Conventional
25% down · 7.5% · 30yr
- Down + closing
- —
- Monthly P&I
- —
- Monthly cashflow
- —
- DSCR
- —
- Eligible?
- —
Personal DTI + credit; lowest rate.
DSCR
20% down · 8.5% · 30yr
- Down + closing
- —
- Monthly P&I
- —
- Monthly cashflow
- —
- DSCR
- —
- Eligible?
- —
No personal income docs; deal must DSCR.
Hard money
10% down · 12.0% · 12mo
- Down + closing
- —
- Monthly P&I
- —
- Monthly cashflow
- —
- DSCR
- —
- Eligible?
- —
Short-term bridge; refi at stabilization.
Listing history 25 events
-
2026-06-22days on market $89,997 Active 161 DOM
-
2026-06-18days on market $89,997 Active 158 DOM
-
2026-06-17days on market $89,997 Active 157 DOM
-
2026-06-16days on market $89,997 Active 156 DOM
-
2026-06-15days on market $89,997 Active 155 DOM
-
2026-06-13days on market $89,997 Active 153 DOM
-
2026-06-13days on market $89,997 Active 152 DOM
-
2026-06-10days on market $89,997 Active 150 DOM
-
2026-06-09days on market $89,997 Active 149 DOM
-
2026-06-08days on market $89,997 Active 148 DOM
-
2026-06-08days on market $89,997 Active 147 DOM
-
2026-06-03days on market $89,997 Active 143 DOM
-
2026-06-02days on market $89,997 Active 142 DOM
-
2026-06-01days on market $89,997 Active 141 DOM
-
2026-05-31days on market $89,997 Active 140 DOM
-
2026-05-20price $1,525
-
2026-04-28price $89,997
-
2026-03-25$1,297
-
2026-01-11$99,997 Active
-
2023-09-23historical $1,395
-
2023-08-24price $1,395
-
2023-07-30price $1,495
-
2023-07-29
-
2023-07-22historical
-
1988-05-02soldstatus $25,000
ⓘ Source: listings_history table (triggers on properties + properties_extension) + one-shot
backfill from property_details.listing_events for pre-trigger history.
Tax reassessment forecast FL · Resets to sale price
- Current annual tax
- $676 · $56/mo
- Projected year-2 tax
- $747 · $62/mo
- Expected delta
- +$70/yr (+$6/mo · 10.4%)
ⓘ Screening estimate from a state-policy table — verify with the county assessor before closing.
Climate risk First Street
- Flood 1/10 Low FEMA zone X (unshaded) · 0% chance over 30 yrs
- Wildfire 1/10 Low
- Heat 10/10 Extreme 7 d/yr ≥107°F today · 29 d/yr by 30 yrs out
- Wind 10/10 Extreme 99% chance of damaging wind over 30 yrs
- Air quality 3/10 Moderate 2 unhealthy d/yr today · 2 by 30 yrs out
Nearby sold comps map
Loading sold comps map…
Walkable amenities ~0.75 mi
Loading nearby amenities…
Taxation est. · year 1
- Rental income
- $14,146
- − Mortgage interest
- −$5,041
- − Property taxes
- −$676
- − Insurance
- −$450
- − Repairs & maintenance
- −$1,132
- − Management
- −$1,132
- − Depreciation
- −$2,618
- Taxable income
- $3,097
- Est. tax owed @ 24.0%
- −$743
- After-tax cash flow
- $3,642/yr
For passive investors: Depreciation is non-cash, so a rental often shows a tax loss while cash-flowing — sheltering income. Rental losses are passive: they offset passive income freely, and up to $25,000/yr can offset ordinary (W-2) income if you actively participate and your MAGI is under $100k (phasing out to $0 by $150k); unused losses carry forward. On sale, claimed depreciation is recaptured at up to 25%, and gains may owe capital-gains tax (a 1031 exchange can defer both). Figures are a year-1 estimate at your 24.0% rate — not tax advice; consult a CPA.
Schools (NCES district)
- District
- Manatee
- NCES district ID
- 1201230
- Math proficiency
- 54% ▼ -6.00%
- Reading proficiency
- 50% ▼ -2.00%
- Median HH income
- $49,607
- Composite
- 44.43/100
- National rank
- #2806
- State rank
- #26 of 73 in FL
Livability — South Bradenton
- Score
- 77/100
- State rank
- #195
- US rank
- #3092
Category grades
Schools grade is shown separately in the Schools card above.
Census & demographics
- Census place
- South Bradenton, FL
- County
- Manatee County · 416,364 people
- City population
- 33,840
- Metro
- North Port-Sarasota-Bradenton, FL
- Population (ZIP)
- 34,081
- Household income
- $45,010
- Rent vs Own
- Severe rent burden
- 1474.0
Population outlook (Manatee County) Hauer SSP2
- Today (2025)
- 447,342 people
- By 2030
- 488,911 · +9.3%
- By 2040
- 567,934 · +27.0%
- By 2050
- 637,995 · +42.6%
- By 2075
- 781,970 · +74.8%
- By 2100
- 848,272 · +89.6%
Race, ethnicity, and origin ACS 2023
- Neighborhood character
- Diverse neighborhood (Simpson 0.57)
- Race & ethnicity
- White 58% Hispanic / Latino 29% Two or more races 13% Black 7%
- Hispanic origin (detail)
- Mexican 12% Puerto Rican 4% Cuban 3% Dominican 1%
- Common ancestry
- Lithuanian 3% Romanian 2% Slovak 2%
- Foreign-born
- 16% · Canada, Jamaica
- Languages at home
- 74% English-only · Spanish 22% Other Indo-European 1% French/Haitian/Cajun 1%
Political lean MEDSL · Manatee
- 2024 margin
- Strong R (+23.5) · D 37.9% · R 61.4%
- 2008→2024 swing
- -16.5pp toward R · 2008: -7.0pp · 2024: -23.5pp
- All cycles
- 2024: R+23.5 2020: R+16.1 2016: R+17.1 2012: R+12.5 2008: R+7.0
Not yet ingested
- Civics
- —
Market trends
- HPI YoY
- ▼ -305.32%
- Current HPI
- 369.9899
- Rent YoY
- ▼ -5.50%
- Metro
- North Port-Sarasota-Bradenton, FL
- State GDP YoY
- ▲ 3.28%
- F500 in state
- 36
Industry mix (Fortune 500 HQ in FL)
| Industry | F500 HQs | Revenue |
|---|---|---|
| Industrial Technology | 2 | $29B |
|
||
| Insurance | 2 | $17B |
|
||
| Retail | 1 | $60B |
|
||
| Technology Distribution | 1 | $58B |
|
||
| Homebuilding | 1 | $35B |
|
||
| Technology Manufacturing | 1 | $35B |
|
||
Price history
-93.9% since first listed10 events — show timeline
- 2026-05-20 Price Changed $1,525 APPFOLIO
- 2026-04-28 Price Changed $89,997 Stellar MLS as Distributed by MLS Grid
- 2026-03-25 Listed for Rent $1,297 APPFOLIO
- 2026-01-11 Listed $99,997 Stellar MLS as Distributed by MLS Grid
- 2023-09-23 Rental Removed $1,395 APPFOLIO
- 2023-08-24 Price Changed $1,395 APPFOLIO
- 2023-07-30 Price Changed $1,495 APPFOLIO
- 2023-07-29 Listed for Rent — APPFOLIO
- 2023-07-22 Rental Removed — APPFOLIO
- 1988-05-02 Sold (Public Records) $25,000 Public Records
Property tax history
+3.0%/yrLatest (2025): $676 · +1.1% YoY. Source: county tax records.
Cash-flow waterfall
monthlySold comps — $/sqft
last 12 mo · ≤1 miLoading sold comps…