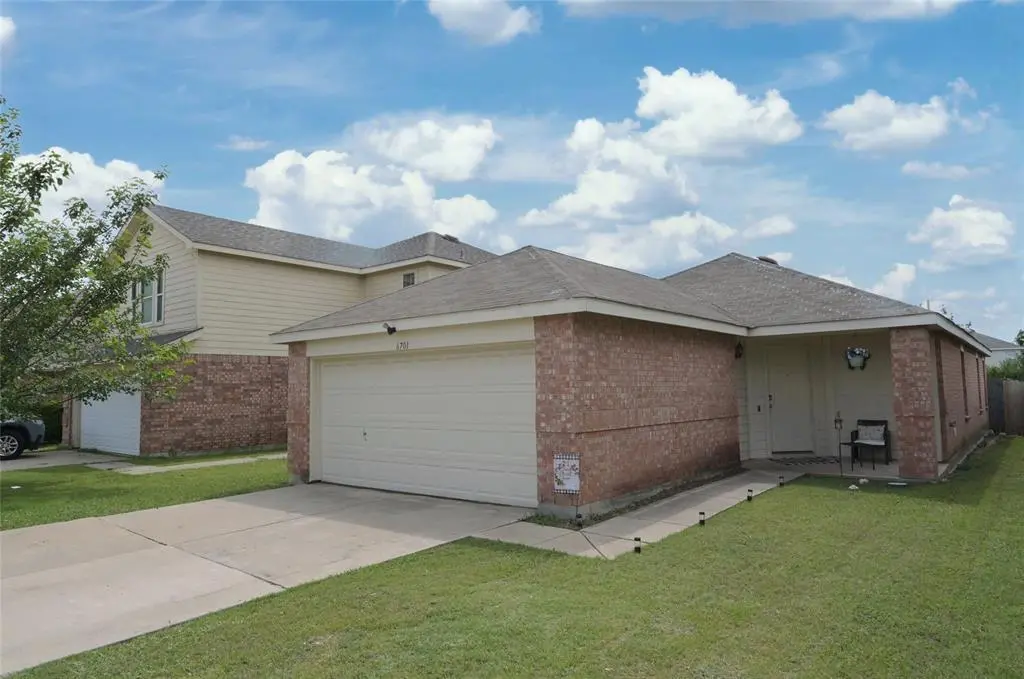
6701 Waterhill Ln · Fort Worth, TX
Flood risk 1/10 · Minimal
- FEMA flood zone
- X (unshaded)
- Chance of flooding over 30 yrs
- 0.0%
- Est. flood insurance / yr
- $507 – $1,088
Fire risk 4/10 · Minor
- Est. fire insurance / yr
- $1,222 – $2,270
Heat risk 7/10 · Major
- Hot days now (above 109°F)
- 7 days/yr
- Hot days in 30 yrs
- 23 days/yr
Wind risk 4/10 · Minor
- Chance of severe wind over 30 yrs
- 24.0%
Air-quality risk 2/10 · Minimal
- Unhealthy air days now
- 1 days/yr
- Unhealthy air days in 30 yrs
- 2 days/yr
Risk factors via First Street. Map © Google.
Why this score? — see what drove the D- grade
The composite is a weighted blend of 9 inputs, each scored 0–100. Each bar is that input's sub-score; the figure is the points it added to the 100-point composite (weight × sub-score).
- Cash flow +11.6/30.0
- ARV discount +7.7/15.0
- 1% rule +4.2/10.0
- Livability +4.0/5.0
- Schools +3.5/10.0
- DSCR +3.4/10.0
- Rent growth +2.9/5.0
- Condition / age +2.5/5.0
- Appreciation +0.0/10.0
$239,500
🖨 Deal sheet (PDF) 📄 Offer letter ✓ Due diligence
Listing remarks MLS
Built in 2004, this Fort Worth one-story home offers and a two-car garage. Upgraded features include overall fresh interior paint and newly installed carpet in select rooms. Community park and pool along with common area maintenance are part of the HOA. Home comes with a 30-day buyback guarantee. Terms and conditions apply.
Key facts
- Covered front porch
- 4,792 sq ft lot
- 2 garage spots
Tags
Property features AI
Finance
- Other: Survey available
- HOA & community: Mandatory HOA with annual fee ($145) covering management fees; HOA managed by First Service Residential; Community features include curbs and sidewalks
Exterior
- Parking: Attached 2-car garage with double doors and garage facing front; 2 covered parking spaces
- Security: Security system
- Utilities: City water; City sewer; Individual water meter; Cable available; Underground utilities; All-weather road access; Concrete and curbs
- Home design: Single-family residence; Residential property; One story; Property is not attached; Security system installed
- Construction: Built in 2004; Brick, frame, and siding construction; Composition roof; Slab foundation
- Exterior features: Covered porch(es); Covered patio/porch; Fenced backyard with wood fence; Sprinkler system; Few trees; Interior lot; Subdivision setting; Easement for utilities
Interior
- Kitchen: Dishwasher; Disposal; Electric range; Built-in cabinets; Eat-in kitchen; Water line to refrigerator
- Bedrooms: 3 bedrooms (all on the main level); Primary bedroom includes walk-in closet
- Flooring: Carpet; Tile; Vinyl
- Bathrooms: 2 full bathrooms
- Heating & cooling: Central heat (electric); Central air (electric); Ceiling fan(s)
- Interior features: Decorative lighting; Eat-in kitchen; Cable TV available; High-speed internet available; Walk-in closet(s); Window coverings; One living area; One dining area; Total of 9 rooms; Levels: One
- Laundry & utility: Laundry room with full-size washer/dryer area; Washer hookup; Electric dryer hookup; Utility room; Second pantry
Neighborhood map
What this means for you Summary
Snapshot
- This is a 3-bed/2.0-bath single-family listed at $240k.
Deal economics
- At list price, monthly cash flow is $-74 ($-893/yr) — negative.
- To cash-flow at today's rent, offer at most $226k (5.5% below list).
- To meet the 1% rule (rent ≥ 1% of price), the offer needs to be $221k (7.8% below list).
- Recommended offer: $221k (7.8% below list) — sets the bar for 1% rule.
- Cap rate 5.9% vs local median 3.9% in Fort Worth — top-decile yield for the area; either an underpriced asset or a hidden risk that comps aren't pricing in. Stress-test before assuming the spread holds.
Location & tenants
- Location reads 80/100 on livability (#49 in TX, #1,954 nationally) — a professional / high-income tenant draw. Strengths: amenities A+, cost of living A+, housing A+; Watch: crime F.
- Eagle Mt-Saginaw ISD (urban): math 35% / reading 42% proficiency, ranked #361 of 826 in TX (top 44%) — families likely to look elsewhere, expect single-tenant / working-renter base with shorter leases.
- Zoned schools: Parkview El (math 35% / reading 32%, grade F, #2,174 of 4,322 statewide, top 51%, 555 students, 53% FRL) — zoned schools average 53% FRL vs 36% district-wide (17 pts higher); higher-poverty schools than district average — tighter screening recommended.
- Market conditions: Rents rising (+1.5%/yr); 1050 active listings in the ZIP; 40 comparable units currently listed for rent nearby; rentals leasing fast (median 14d on market — plan ~1-2 weeks tenant-placement turnaround); solid renter incomes; 18,938 units permitted in Tarrant County in 2024 (8,336 in 5+ unit buildings).
Forward outlook
- Local home prices are declining (-3.0%/yr); year-one equity from $2k of loan paydown is wiped out by about $7k of value loss. Plan a longer hold.
- Tarrant County population projected at +41% by 2050 — long-run rental-demand tailwind backs the buy-and-hold thesis.
Negotiation context
- It's been on market 20 days — a 2% lower offer ($236k) is reasonable based on typical stale-listing flexibility.
- 3 sale attempts since 18y ago; this cycle's ask has dropped $19k (7%) from the opening price — seller is motivated, your offer sets the floor, not the list.
Risks & watch-outs
- Climate carrying-cost: extreme-heat days projected 7→23/yr by 2055 (HVAC capex compounding) — expect insurance premiums to compound above CPI over the hold.
Questions for the listing agent
- What do current leases actually rent for vs. the listed asking? Can we see a recent rent roll and the last 12 months of T-12 income?
- What does the HOA fee cover, when was the last increase, and are there any pending special assessments or reserve-fund shortfalls?
- Is there a deadline driving the sale (1031 exchange, divorce, estate, relocation)? That informs how much negotiation room exists.
- Schools are D-rated, which usually means shorter tenancies and higher turnover. Who's the typical renter profile here, and what's been the actual vacancy rate?
- Crime grade is F in this area — have there been break-ins, vandalism, or insurance claims at this property in the last 3 years? What carrier currently insures it and at what premium?
- The area grade is low — what's the realistic commute time and amenity access for the typical tenant pool here? Any planned neighborhood developments (good or bad) we should know about?
- What's the average days-on-market for RENTAL listings here right now (not sales)? A rising rental-DOM trend means longer vacancies and softer asking-rent achievability than the comps imply.
- What's the recent tenant-quality profile in this submarket — average credit score on applications, eviction rate, late-payment / NSF rate, and stable-employment percentage? A property-management company in the area should have these aggregated.
- How much new for-sale + rental construction is in the pipeline within 1–3 miles? Heavy new supply typically softens prices + rents 12–24 months out; constrained supply supports both.
Investment metrics
- 1% rule
- 0.92% ✗
- Cap rate
- 5.92%
- Cash-on-cash
- -1.33%
- DSCR
- 0.94
- GRM
- 9.0
CMA / ARV
- ARV (on-the-fly)
- $240,768
- Comps found
- 12
Show comp detail 12 sales within ~0.75 mi
| Address | Dist | Beds/Ba | Sqft | Sold | Price | $/sf | Match |
|---|---|---|---|---|---|---|---|
| 6716 Waterhill Ln | 0.04mi | 3/2.0 | 1,408 (0%) | 4mo | $260,000 | $185 | 95 |
| 4553 Waterford Dr | 0.19mi | 3/2.0 | 1,369 (-3%) | 6mo | $270,000 | $197 | 81 |
| 6465 Downeast Dr | 0.10mi | 3/2.0 | 1,316 (-6%) | 8mo | $244,900 | $186 | 78 |
| 4817 Waterford Dr | 0.04mi | 4/2.0 (+1) | 1,536 (+9%) | 0mo | $260,000 | $169 | 78 |
| 6409 Riverwater Trl | 0.41mi | 3/2.0 | 1,461 (+4%) | 0mo | $265,000 | $181 | 74 |
| 4884 Waterford Dr | 0.15mi | 4/2.0 (+1) | 1,536 (+9%) | 1mo | $259,999 | $169 | 72 |
| 6701 Meadow Way Ln | 0.16mi | 4/2.0 (+1) | 1,532 (+9%) | 6mo | $260,000 | $170 | 68 |
| 4940 Waterford Dr | 0.25mi | 4/2.0 (+1) | 1,534 (+9%) | 1mo | $249,900 | $163 | 68 |
| 4904 Parkrise Dr | 0.29mi | 3/2.0 | 1,551 (+10%) | 4mo | $265,000 | $171 | 66 |
| 5424 Creek Hill Ln | 0.70mi | 3/2.0 | 1,526 (+8%) | 2mo | $250,000 | $164 | 52 |
| 5563 Northfield Dr | 0.74mi | 3/2.0 | 1,317 (-6%) | 6mo | $260,000 | $197 | 49 |
| 6552 Fitzgerald St | 0.60mi | 3/2.0 | 1,606 (+14%) | 4mo | $215,000 | $134 | 45 |
Match score weights: distance 35% · size 25% · config 20% · recency 20%. Top-matched comps best support the ARV.
Projected returns pro-forma
-3.0% appreciation · 1.51% rent growth · sell at horizon
- IRR
- -20.3%
- Equity multiple
- 0.30×
- Total profit
- $-46,674
- Equity at exit
- $35,710
- IRR
- -17.3%
- Equity multiple
- 0.12×
- Total profit
- $-59,186
- Equity at exit
- $20,708
Cash invested: $67,060 (down + closing). Projections, not guarantees.
Landlord ↔ Tenant lean methodology
- Overall (STATE)
- 87 Strongly Landlord-Friendly
- State Texas
- 87 Strongly Landlord-Friendly · R+5
- County
- — inherits STATE
- City
- — inherits STATE
ZIP-level market 76179
- Rents YoY
- 1.5%
- Active inventory
- 1050
- Price-to-rent
- 9.0×
Monthly cashflow live
- Estimated rent
- $2,207 high interval (Pro) →
- Mortgage (P&I)
- −$1,256
- Tax from tax record
- −$450 /mo · $5,405/yr
- Insurance
- −$100
- HOA
- −$12
- Vacancy / Maint / Mgmt
- −$464
- Net cashflow
- $-74
Break-even live
Sensitivity live
| Price | -10% $61 | -5% $-7 | +0% $-74 | +5% $-142 | +10% $-210 |
|---|---|---|---|---|---|
| Rent | -10% $-249 | -5% $-162 | +0% $-74 | +5% $13 | +10% $100 |
| Rate | -1.0pp $46 | -0.5pp $-13 | base $-74 | +0.5pp $-136 | +1.0pp $-200 |
UW: 25.0% down · 7.5% · 30yr · 1.5% tax · 5.0% vac · 8.0% maint · 8.0% mgmt
Financing live
Cash to close
- Down payment
- $59,875
- Closing costs
- $7,185
- Reserves months
- —
- Total cash needed
- —
Loan-product check · same deal, 3 products live
Conventional
25% down · 7.5% · 30yr
- Down + closing
- —
- Monthly P&I
- —
- Monthly cashflow
- —
- DSCR
- —
- Eligible?
- —
Personal DTI + credit; lowest rate.
DSCR
20% down · 8.5% · 30yr
- Down + closing
- —
- Monthly P&I
- —
- Monthly cashflow
- —
- DSCR
- —
- Eligible?
- —
No personal income docs; deal must DSCR.
Hard money
10% down · 12.0% · 12mo
- Down + closing
- —
- Monthly P&I
- —
- Monthly cashflow
- —
- DSCR
- —
- Eligible?
- —
Short-term bridge; refi at stabilization.
Rent comps 40 comps
| Address | Beds | Baths | Sqft | Rent | $/sqft | DOM | Units | Dist |
|---|---|---|---|---|---|---|---|---|
| 6612 Waterhill Ln Fort Worth, TX | 3.0 | 2.5 | 1842 | $1,995 | $1.08 | 13d | 1 | 0.07mi |
| 6701 Meadow Way Ln Fort Worth, TX | 4.0 | 2.0 | 1532 | $1,950 | $1.27 | 22d | 1 | 0.14mi |
| 4937 Waterford Dr Fort Worth, TX | 3.0 | 2.5 | 1810 | $1,879 | $1.04 | 25d | 1 | 0.23mi |
| 5100 Waterford Dr Fort Worth, TX | 3.0 | 2.5 | 1848 | $1,850 | $1.00 | 25d | 1 | 0.29mi |
| 6316 Downeast Dr Fort Worth, TX | 3.0 | 2.0 | 1265 | $1,825 | $1.44 | 2d | 1 | 0.33mi |
| 6433 Riverwater Trl Fort Worth, TX | 3.0 | 2.0 | 1150 | $2,100 | $1.83 | 25d | 1 | 0.34mi |
| 6812 Valley Creek Dr Fort Worth, TX | 4.0 | 2.0 | 1764 | $1,950 | $1.11 | 21d | 1 | 0.36mi |
| 6304 Downeast Dr Fort Worth, TX | 3.0 | 2.0 | 1587 | $1,900 | $1.20 | 13d | 1 | 0.36mi |
| 6848 Valley Creek Dr Fort Worth, TX | 3.0 | 2.0 | 1537 | $1,975 | $1.28 | 25d | 1 | 0.36mi |
| 102 Bedford Cir Saginaw, TX | 3.0 | 2.5 | 1490 | $2,319 | $1.56 | 17d | 1 | 0.37mi |
| 306 Yorkshire Ct Saginaw, TX | 3.0 | 2.5 | 1667 | $2,459 | $1.48 | 7d | 1 | 0.44mi |
| 206 Hardwick Dr Saginaw, TX | 3.0–4.0 | 2.5–3.0 | 1747 | $2,299 | $1.32 | 6d | 1 | 0.46mi |
| 109 Kimberly Ct Saginaw, TX | 4.0 | 3.0 | 1865 | $2,579 | $1.38 | 22d | 1 | 0.46mi |
| 205 Hockliffe Ct Saginaw, TX | 3.0 | 2.5 | 1667 | $2,449 | $1.47 | 7d | 1 | 0.47mi |
| 110 Kimberly Ct Saginaw, TX | 4.0 | 3.0 | 1865 | $2,549 | $1.37 | 22d | 1 | 0.48mi |
| 202 Hockliffe Ct Saginaw, TX | 4.0 | 3.0 | 1865 | $2,559 | $1.37 | 13d | 1 | 0.49mi |
| 109 Cherwell Ct Saginaw, TX | 4.0 | 3.0 | 1865 | $2,599 | $1.39 | 13d | 1 | 0.49mi |
| 101 Canterbury Dr Saginaw, TX | 4.0 | 2.0 | 1866 | $2,191 | $1.17 | 13d | 1 | 0.50mi |
| 209 Wingfield Rd Saginaw, TX | 4.0 | 3.0 | 1865 | $2,649 | $1.42 | 7d | 1 | 0.50mi |
| 110 Cherwell Ct Saginaw, TX | 4.0 | 3.0 | 1865 | $2,599 | $1.39 | 13d | 1 | 0.51mi |
| 106 Cherwell Ct Saginaw, TX | 3.0 | 2.5 | 1667 | $2,489 | $1.49 | 7d | 1 | 0.51mi |
| 206 Wingfield Rd Saginaw, TX | 4.0 | 3.0 | 1865 | $2,649 | $1.42 | 7d | 1 | 0.52mi |
| 101 Rutland Ct Saginaw, TX | 3.0 | 2.5 | 1490 | $2,299 | $1.54 | 7d | 1 | 0.53mi |
| 6521 Trident Ct Fort Worth, TX | 4.0 | 2.0 | 1802 | $2,095 | $1.16 | 17d | 1 | 0.53mi |
| 102 Rutland Ct Saginaw, TX | 3.0 | 2.5 | 1490 | $2,319 | $1.56 | 17d | 1 | 0.53mi |
| 421 Commonwealth Dr Fort Worth, TX | 3.0 | 2.0 | 1699 | $2,250 | $1.32 | 5d | 1 | 0.55mi |
| 1040 Hillwood Dr Saginaw, TX | 3.0 | 2.0 | 1853 | $1,995 | $1.08 | 7d | 1 | 0.55mi |
| 5344 Brahma Trl Fort Worth, TX | 3.0 | 2.0 | 1720 | $2,195 | $1.28 | 8d | 1 | 0.56mi |
| 5344 Brahma Trl Fort Worth, TX | 3.0 | 2.0 | 1720 | $2,295 | $1.33 | 25d | 1 | 0.56mi |
| 1080 West Hills Ter Fort Worth, TX | 3.0 | 2.0 | 1617 | $1,850 | $1.14 | 13d | 1 | 0.63mi |
| 1080 West Hills Ter Fort Worth, TX | 3.0 | 2.0 | 1617 | $1,850 | $1.14 | 25d | 1 | 0.63mi |
| 1116 Landsdale Ln Saginaw, TX | 2.0 | 1.0 | 970 | $1,295 | $1.34 | 25d | 1 | 0.69mi |
| 1149 Landsdale Ln Saginaw, TX | 3.0 | 2.0 | 1179 | $1,495 | $1.27 | 19d | 1 | 0.70mi |
| 1149 Landsdale Ln Saginaw, TX | 3.0 | 2.0 | 1179 | $1,495 | $1.27 | 13d | 1 | 0.70mi |
| 6333 S Chesterfield Dr Fort Worth, TX | 4.0 | 2.0 | 1522 | $2,111 | $1.39 | 8d | 1 | 0.74mi |
| 5612 Northfield Dr Fort Worth, TX | 3.0 | 2.0 | 1336 | $2,083 | $1.56 | 13d | 1 | 0.74mi |
| 5620 Stone Meadow Ln Fort Worth, TX | 3.0 | 2.0 | 1292 | $1,950 | $1.51 | 25d | 1 | 0.78mi |
| 6824 Turtle Stream Dr Fort Worth, TX | 3.0 | 2.0 | 1575 | $1,965 | $1.25 | 6d | 1 | 0.79mi |
| 1024 Green Ridge Ter Saginaw, TX | 3.0 | 2.0 | 1588 | $2,075 | $1.31 | 7d | 1 | 0.81mi |
| 5716 Stone Meadow Ln Fort Worth, TX | 3.0 | 2.0 | 1356 | $2,135 | $1.57 | 25d | 1 | 0.81mi |
HOA detail
- Monthly dues
- $12 · $144/yr
- Likely covers
- pool
Listing history 14 events
-
2026-06-18days on market $239,500 Active 20 DOM
-
2026-06-17days on market $239,500 Active 19 DOM
-
2026-06-16days on market $239,500 Active 18 DOM
-
2026-06-15pricedays on market $239,500 Active 17 DOM
-
2026-06-13days on market $249,500 Active 15 DOM
-
2026-06-13days on market $249,500 Active 14 DOM
-
2026-06-09days on market $249,500 Active 11 DOM
-
2026-06-08days on market $249,500 Active 10 DOM
-
2026-06-07pricedays on market $249,500 Active 9 DOM
-
2026-06-04days on market $258,500 Active 6 DOM
-
2026-06-03days on market $258,500 Active 5 DOM
-
2026-06-02days on market $258,500 Active 4 DOM
-
2026-06-01days on market $258,500 Active 3 DOM
-
2026-05-31days on market $258,500 Active 2 DOM
ⓘ Source: listings_history table (triggers on properties + properties_extension) + one-shot
backfill from property_details.listing_events for pre-trigger history.
Tax reassessment forecast TX · Resets to sale price
- Current annual tax
- $5,405 · $450/mo
- Projected year-2 tax
- $5,405 · $450/mo
- Expected delta
- $0/yr ($0/mo · 0.0%)
ⓘ Screening estimate from a state-policy table — verify with the county assessor before closing.
Climate risk First Street
- Flood 1/10 Low FEMA zone X (unshaded) · 0% chance over 30 yrs
- Wildfire 4/10 Moderate
- Heat 7/10 Severe 7 d/yr ≥109°F today · 23 d/yr by 30 yrs out
- Wind 4/10 Moderate 24% chance of damaging wind over 30 yrs
- Air quality 2/10 Low 1 unhealthy d/yr today · 2 by 30 yrs out
Nearby sold comps map
Loading sold comps map…
Walkable amenities ~0.75 mi
Loading nearby amenities…
Taxation est. · year 1
- Rental income
- $26,488
- − Mortgage interest
- −$13,416
- − Property taxes
- −$5,405
- − Insurance
- −$1,198
- − Repairs & maintenance
- −$2,119
- − Management
- −$2,119
- − HOA
- −$144
- − Depreciation
- −$6,967
- Taxable loss
- −$4,880
- Est. tax savings @ 24.0%
- +$1,171
- After-tax cash flow
- $279/yr
For passive investors: Depreciation is non-cash, so a rental often shows a tax loss while cash-flowing — sheltering income. Rental losses are passive: they offset passive income freely, and up to $25,000/yr can offset ordinary (W-2) income if you actively participate and your MAGI is under $100k (phasing out to $0 by $150k); unused losses carry forward. On sale, claimed depreciation is recaptured at up to 25%, and gains may owe capital-gains tax (a 1031 exchange can defer both). Figures are a year-1 estimate at your 24.0% rate — not tax advice; consult a CPA.
Schools (NCES district)
- District
- Eagle Mt-Saginaw ISD
- NCES district ID
- 4817700
- Math proficiency
- 35% ▼ -16.00%
- Reading proficiency
- 42% ▼ -9.00%
- Median HH income
- $72,781
- Composite
- 35.41/100
- National rank
- #4945
- State rank
- #361 of 826 in TX
Livability — Fort Worth
- Score
- 80/100
- State rank
- #49
- US rank
- #1954
Category grades
Schools grade is shown separately in the Schools card above.
Census & demographics
- Census place
- Fort Worth, TX
- County
- Tarrant County · 2,033,669 people
- City population
- 911,619
- Metro
- Dallas-Fort Worth-Arlington, TX
- Population (ZIP)
- 80,090
- Household income
- $107,428
- Rent vs Own
- Severe rent burden
- 1494.0
Population outlook (Tarrant County) Hauer SSP2
- Today (2025)
- 2,380,417 people
- By 2030
- 2,578,900 · +8.3%
- By 2040
- 2,974,995 · +25.0%
- By 2050
- 3,350,489 · +40.8%
- By 2075
- 4,216,909 · +77.2%
- By 2100
- 4,741,527 · +99.2%
Race, ethnicity, and origin ACS 2023
- Neighborhood character
- Diverse neighborhood (Simpson 0.63)
- Race & ethnicity
- White 53% Hispanic / Latino 28% Two or more races 14% Black 12% Asian 4%
- Hispanic origin (detail)
- Mexican 22% Puerto Rican 2%
- Common ancestry
- Slovak 2% Lithuanian 2% Italian 1%
- Foreign-born
- 8% · Canada, Jamaica
- Languages at home
- 81% English-only · Spanish 15% Other Asian/Pacific 2% Other Indo-European 1%
Political lean MEDSL · Tarrant
- 2024 margin
- Lean R (+5.1) · D 46.7% · R 51.9% · Other 1.4%
- 2008→2024 swing
- +6.6pp toward D · 2008: -11.7pp · 2024: -5.1pp
- All cycles
- 2024: R+5.1 2020: D+0.2 2016: R+8.7 2012: R+15.7 2008: R+11.7
Not yet ingested
- Civics
- —
Market trends
- HPI YoY
- ▼ -137.12%
- Current HPI
- 237.6676
- Rent YoY
- ▲ 1.51%
- Metro
- Dallas-Fort Worth-Arlington, TX
- State GDP YoY
- ▲ 3.95%
- F500 in state
- 110
Industry mix (Fortune 500 HQ in TX)
| Industry | F500 HQs | Revenue |
|---|---|---|
| Energy | 16 | $1,198B |
|
||
| Technology | 5 | $198B |
|
||
| Engineering / Construction | 4 | $72B |
|
||
| Energy Services | 3 | $60B |
|
||
| Utilities | 3 | $41B |
|
||
| Healthcare | 2 | $330B |
|
||
Price history
+215.2% since first listed11 events — show timeline
- 2026-05-29 Listed $258,500 NTREIS
- 2019-04-12 Sold (Public Records) — Public Records
- 2019-04-11 Sold (MLS) — NTREIS
- 2019-03-18 Pending — NTREIS
- 2019-03-09 Listed $185,000 NTREIS
- 2019-03-08 Sold (Public Records) — Public Records
- 2019-03-07 Sold (Public Records) — Public Records
- 2009-03-03 Sold (Public Records) — Public Records
- 2009-02-23 Sold (MLS) — NTREIS
- 2009-01-26 Listing Removed — NTREIS
- 2008-11-22 Listed $82,000 NTREIS
Property tax history
+5.7%/yrLatest (2025): $5,405 · -0.9% YoY. Source: county tax records.
Cash-flow waterfall
monthlySold comps — $/sqft
last 12 mo · ≤1 miLoading sold comps…