 Multi-family
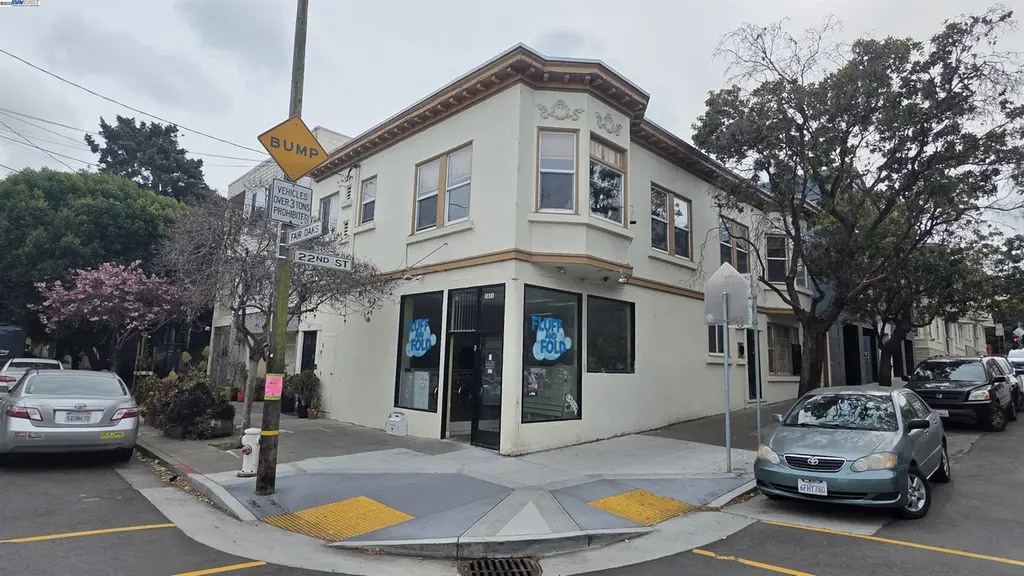
3451 22nd St · San Francisco, CA
Flood risk No data
- FEMA flood zone
- —
- Chance of flooding over 30 yrs
- —
- Est. flood insurance / yr
- —
Fire risk No data
- Est. fire insurance / yr
- —
Heat risk No data
- Hot days now (above threshold)
- —
- Hot days in 30 yrs
- —
Wind risk No data
- Chance of severe wind over 30 yrs
- —
Air-quality risk No data
- Unhealthy air days now
- —
- Unhealthy air days in 30 yrs
- —
Risk factors via First Street. Map © Google.
Why this score? — see what drove the C+ grade
The composite is a weighted blend of 9 inputs, each scored 0–100. Each bar is that input's sub-score; the figure is the points it added to the 100-point composite (weight × sub-score).
- Cash flow +19.0/30.0
- ARV discount +15.0/15.0
- DSCR +6.0/10.0
- Rent growth +5.0/5.0
- Schools +5.0/10.0
- 1% rule +3.8/10.0
- Livability +3.8/5.0
- Condition / age +2.5/5.0
- Appreciation +0.0/10.0
$1,600,000
🖨 Deal sheet 📄 Offer letter ✓ Due diligence
Multi-family units
County records classify this as Multi-Family (5+ Unit). Listing-text estimate: 1 unit. estimate disagrees with records
5+ unit building — per-unit beds/baths from public records are typically unavailable; the breakdown below (if shown) is an estimate from the listing text.
Listing remarks MLS
Three 1 bed apartments, an on site manager’s office, a garage, and laundromat — all just steps from iconic Dolores Park. Prime location, strong cash flow, and rare investment upside in the heart of San Francisco. Dolores Park is a vibrant and iconic green space in San Francisco’s Mission District, known for its sunny weather, scenic city views, and lively community atmosphere. Popular for picnics, people-watching, and weekend gatherings, it offers a perfect blend of natural beauty and urban energy.
Key facts
- Scenic city views
- Investment upside
- Laundromat
Tags
Neighborhood map
What this means for you Summary
Snapshot
- This is a 3-bed/4.0-bath multifamily listed at $1.60M.
Deal economics
- At list price, monthly cash flow is $2k ($20k/yr) — positive.
- The deal already cash-flows at list — no discount required.
- To meet the 1% rule (rent ≥ 1% of price), the offer needs to be $1.41M (11.9% below list).
- Recommended offer: $1.41M (12.0% below list) — sets the bar for market timing.
- Cap rate 7.5% vs local median 2.1% in San Francisco — top-decile yield for the area; either an underpriced asset or a hidden risk that comps aren't pricing in. Stress-test before assuming the spread holds.
Location & tenants
- Location reads 76/100 on livability (#90 in CA, #3,143 nationally) — a middle-class / working-renter tenant base. Strengths: amenities A+, commute A+, employment A+; Watch: crime F, cost of living F.
- San Francisco Unified (urban): math 50% / reading 56% proficiency, ranked #322 of 1,400 in CA (top 23%) — acceptable for families but not a draw, mixed tenant base, ~2y average lease.
- Market conditions: Rents rising fast (+14.5%/yr); 161 active listings in the ZIP; 9 comparable units currently listed for rent nearby; rentals at typical pace (median 25d on market — plan ~3-4 weeks tenant-placement turnaround); 44% of comp listings sitting > 30 days — soft ceiling on asking rent; high-income renter base; 750 units permitted in San Francisco County in 2024 (688 in 5+ unit buildings).
- At $14,102/mo this rent would consume 107% of the median local household income ($158k/yr) (locally 2732% of renters already pay >50% of income on rent) — very limited rent-growth headroom before tenants either downsize or default.
Forward outlook
- Local home prices are declining (-3.0%/yr); year-one equity from $11k of loan paydown is wiped out by about $48k of value loss. Plan a longer hold.
- San Francisco County population projected at +39% by 2050 — long-run rental-demand tailwind backs the buy-and-hold thesis.
- At projected returns (-3.0% appreciation + 8.0% rent growth), your $448k cash investment doubles in ~10 years — after that, you're playing with house money.
Negotiation context
- It's been on market 394 days — a 12% lower offer ($1.41M) is reasonable based on typical stale-listing flexibility.
- Current owner paid $875k; list at $1.60M implies a 83% gain — meaningful room to come down on a strong offer.
Risks & watch-outs
- Watch-outs: built in 1924 — expect roof / HVAC / electrical / plumbing capex.
Questions for the listing agent
- It's been on market 394 days. Have you received any prior offers? Is the seller open to a 12% concession, seller financing, or rate buy-down credit?
- Built in 1924 — when were the roof, HVAC, electrical panel, plumbing, and water heater last replaced?
- Why hasn't it sold? Are there any deal-killer items the seller is aware of (foundation, flood, title, zoning, code violations)?
- Is there a deadline driving the sale (1031 exchange, divorce, estate, relocation)? That informs how much negotiation room exists.
- Schools are B-rated — typically a magnet for longer-tenancy family renters. What's the average tenant stay here, and is there a school-zone premium baked into asking?
- Crime grade is F in this area — have there been break-ins, vandalism, or insurance claims at this property in the last 3 years? What carrier currently insures it and at what premium?
- What's the average days-on-market for RENTAL listings here right now (not sales)? A rising rental-DOM trend means longer vacancies and softer asking-rent achievability than the comps imply.
- What's the recent tenant-quality profile in this submarket — average credit score on applications, eviction rate, late-payment / NSF rate, and stable-employment percentage? A property-management company in the area should have these aggregated.
- How much new apartment / multifamily construction is in the pipeline within 1–3 miles? Heavy new supply (>2% of stock underway) typically softens rents 12–24 months out; light construction supports rent growth.
Investment metrics
- 1% rule
- 0.88% ✗
- Cap rate
- 7.55%
- Cash-on-cash
- 4.47%
- DSCR
- 1.20
- GRM
- 9.5
CMA / ARV
- ARV (median comp)
- $2,250,165
- List price
- $1,600,000
- Delta
- -28.89%
- Verdict
- UNDERPRICED
- Comps
- 20 within 1.0 mi
Show comp detail 12 sales within ~0.75 mi
| Address | Dist | Beds/Ba | Sqft | Sold | Price | $/sf | Match |
|---|---|---|---|---|---|---|---|
| 3465 22nd St | 0.01mi | 4/4.0 (+1) | 3,128 (-0%) | 8mo | $2,305,000 | $737 | 87 |
| 3430-3432 21st St | 0.14mi | 3/— | 3,200 (+2%) | 6mo | $1,675,050 | $523 | 85 |
| 3530-3532 22nd St | 0.10mi | 4/2.0 (+1) | 3,225 (+3%) | 3mo | $2,700,000 | $837 | 76 |
| 41-43 Alvarado St | 0.13mi | 4/2.0 (+1) | 2,952 (-6%) | 1mo | $2,850,000 | $965 | 70 |
| 72-74 Cumberland St | 0.30mi | 4/2.0 (+1) | 3,110 (-1%) | 7mo | $2,280,000 | $733 | 65 |
| 3864 Cesar Chavez St | 0.49mi | 4/4.0 (+1) | 3,250 (+4%) | 3mo | $1,725,000 | $531 | 64 |
| 2977-2979 21st St | 0.59mi | 4/3.0 (+1) | 3,000 (-4%) | 1mo | $2,300,000 | $767 | 55 |
| 48 Sycamore St | 0.58mi | 4/4.0 (+1) | 2,950 (-6%) | 7mo | $1,703,000 | $577 | 52 |
| 1191 Guerrero St | 0.22mi | 4/2.0 (+1) | 2,680 (-15%) | 2mo | $1,850,000 | $690 | 51 |
| 647-649 Capp St | 0.39mi | 4/3.0 (+1) | 2,710 (-14%) | 0mo | $1,128,000 | $416 | 50 |
| 3931-3933 18th St | 0.56mi | 3/3.0 | 2,908 (-7%) | 12mo | $1,250,000 | $430 | 48 |
| 514 Hill St | 0.47mi | 4/5.0 (+1) | 2,740 (-13%) | 10mo | $2,000,000 | $730 | 40 |
Match score weights: distance 35% · size 25% · config 20% · recency 20%. Top-matched comps best support the ARV.
Projected returns pro-forma
-3.0% appreciation · 8.0% rent growth · sell at horizon
- IRR
- -4.5%
- Equity multiple
- 0.82×
- Total profit
- $-79,106
- Equity at exit
- $238,565
- IRR
- 9.7%
- Equity multiple
- 1.90×
- Total profit
- $404,222
- Equity at exit
- $138,339
Cash invested: $448,000 (down + closing). Projections, not guarantees.
Landlord ↔ Tenant lean methodology
- Overall (CITY)
- 0 Strongly Tenant-Friendly
- State California
- 18 Strongly Tenant-Friendly · D+13
- County
- — inherits STATE
- City San Francisco
- 0 Strongly Tenant-Friendly · D+57
ZIP-level market 94110
- Rents YoY
- 14.5%
- Active inventory
- 161
- Price-to-rent
- 28.4×
Monthly cashflow live
- Estimated rent
- $14,102 high interval (Pro) →
- Mortgage (P&I)
- −$8,391
- Tax from tax record
- −$413 /mo · $4,953/yr
- Insurance
- −$667
- HOA
- −$0
- Vacancy / Maint / Mgmt
- −$2,961
- Net cashflow
- $1,671
Break-even live
3-unit breakdown (identical units grouped — click to expand)
| Units | Beds | Baths | Est. rent |
|---|---|---|---|
| 3× units | 1 | 1 | $14,103 |
| #1 | 1 | 1 | $4,701 |
| #2 | 1 | 1 | $4,701 |
| #3 | 1 | 1 | $4,701 |
| Total (3 units) | $14,102 | ||
UW: 25.0% down · 7.5% · 30yr · 1.5% tax · 5.0% vac · 8.0% maint · 8.0% mgmt
Financing live
Cash to close
- Down payment
- $400,000
- Closing costs
- $48,000
- Reserves months
- —
- Total cash needed
- —
Loan-product check · same deal, 3 products live
Conventional
25% down · 7.5% · 30yr
- Down + closing
- —
- Monthly P&I
- —
- Monthly cashflow
- —
- DSCR
- —
- Eligible?
- —
Personal DTI + credit; lowest rate.
DSCR
20% down · 8.5% · 30yr
- Down + closing
- —
- Monthly P&I
- —
- Monthly cashflow
- —
- DSCR
- —
- Eligible?
- —
No personal income docs; deal must DSCR.
Hard money
10% down · 12.0% · 12mo
- Down + closing
- —
- Monthly P&I
- —
- Monthly cashflow
- —
- DSCR
- —
- Eligible?
- —
Short-term bridge; refi at stabilization.
Rent comps 9 comps
| Address | Beds | Baths | Sqft | Rent | $/sqft | DOM | Units | Dist |
|---|---|---|---|---|---|---|---|---|
| 1076 S Van Ness Ave San Francisco, CA | 4.0 | 3.5 | 3776 | $19,950 | $5.28 | 2d | 1 | 0.39mi |
| 1059 Noe St San Francisco, CA | 3.0 | 2.5 | 2545 | $14,000 | $5.50 | 43d | 1 | 0.47mi |
| 753 Castro St San Francisco, CA | 4.0 | 3.0 | 2467 | $10,950 | $4.44 | 43d | 1 | 0.58mi |
| 471 S Van Ness Ave San Francisco, CA | 4.0 | 3.0 | 2140 | $11,000 | $5.14 | 15d | 1 | 0.83mi |
| 143 Corbett Ave San Francisco, CA | 4.0 | 4.0 | 2500 | $10,500 | $4.20 | 43d | 1 | 1.05mi |
| 65 High St Unit NA San Francisco, CA | 4.0 | 3.0 | 2315 | $9,950 | $4.30 | 43d | 1 | 1.15mi |
| 124 Alpine Ter San Francisco, CA | 3.0 | 2.0 | 2200 | $11,995 | $5.45 | 11d | 1 | 1.20mi |
| 124 Alpine Ter San Francisco, CA | 3.0 | 2.0 | 2200 | $12,500 | $5.68 | 24d | 1 | 1.20mi |
| 124 Alpine Ter San Francisco, CA | 3.0 | 2.0 | 2200 | $11,995 | $5.45 | 14d | 1 | 1.20mi |
Listing history 18 events
-
2026-06-18days on market $1,600,000 Active 394 DOM
-
2026-06-17days on market $1,600,000 Active 393 DOM
-
2026-06-16days on market $1,600,000 Active 392 DOM
-
2026-06-15days on market $1,600,000 Active 391 DOM
-
2026-06-13days on market $1,600,000 Active 389 DOM
-
2026-06-13days on market $1,600,000 Active 388 DOM
-
2026-06-09days on market $1,600,000 Active 385 DOM
-
2026-06-08days on market $1,600,000 Active 384 DOM
-
2026-06-07days on market $1,600,000 Active 383 DOM
-
2026-06-04days on market $1,600,000 Active 380 DOM
-
2026-06-03days on market $1,600,000 Active 379 DOM
-
2026-06-02days on market $1,600,000 Active 378 DOM
-
2026-06-01days on market $1,600,000 Active 377 DOM
-
2026-05-31days on market $1,600,000 Active 376 DOM
-
2026-03-05price $1,600,000 521-char remark
Show marketing remark (521 chars)
Three 1 bed apartments, an on site manager’s office, a garage, and laundromat — all just steps from iconic Dolores Park. Prime location, strong cash flow, and rare investment upside in the heart of San Francisco. Dolores Park is a vibrant and iconic green space in San Francisco’s Mission District, known for its sunny weather, scenic city views, and lively community atmosphere. Popular for picnics, people-watching, and weekend gatherings, it offers a perfect blend of natural beauty and urban energy.
-
2026-01-30price $1,700,000 521-char remark
Show marketing remark (521 chars)
Three 1 bed apartments, an on site manager’s office, a garage, and laundromat — all just steps from iconic Dolores Park. Prime location, strong cash flow, and rare investment upside in the heart of San Francisco. Dolores Park is a vibrant and iconic green space in San Francisco’s Mission District, known for its sunny weather, scenic city views, and lively community atmosphere. Popular for picnics, people-watching, and weekend gatherings, it offers a perfect blend of natural beauty and urban energy.
-
2025-05-20$1,800,000 Active 521-char remark
Show marketing remark (521 chars)
Three 1 bed apartments, an on site manager’s office, a garage, and laundromat — all just steps from iconic Dolores Park. Prime location, strong cash flow, and rare investment upside in the heart of San Francisco. Dolores Park is a vibrant and iconic green space in San Francisco’s Mission District, known for its sunny weather, scenic city views, and lively community atmosphere. Popular for picnics, people-watching, and weekend gatherings, it offers a perfect blend of natural beauty and urban energy.
-
2010-02-10soldstatus $875,000
ⓘ Source: listings_history table (triggers on properties + properties_extension) + one-shot
backfill from property_details.listing_events for pre-trigger history.
Tax reassessment forecast CA · Resets to sale price
- Current annual tax
- $4,953 · $413/mo
- Projected year-2 tax
- $12,160 · $1,013/mo
- Expected delta
- +$7,207/yr (+$601/mo · 145.5%)
ⓘ Screening estimate from a state-policy table — verify with the county assessor before closing.
Nearby sold comps map
Loading sold comps map…
Walkable amenities ~0.75 mi
Loading nearby amenities…
Taxation est. · year 1
- Rental income
- $169,224
- − Mortgage interest
- −$89,625
- − Property taxes
- −$4,953
- − Insurance
- −$8,000
- − Repairs & maintenance
- −$13,538
- − Management
- −$13,538
- − Depreciation
- −$46,545
- Taxable loss
- −$6,975
- Est. tax savings @ 24.0%
- +$1,674
- After-tax cash flow
- $21,721/yr
For passive investors: Depreciation is non-cash, so a rental often shows a tax loss while cash-flowing — sheltering income. Rental losses are passive: they offset passive income freely, and up to $25,000/yr can offset ordinary (W-2) income if you actively participate and your MAGI is under $100k (phasing out to $0 by $150k); unused losses carry forward. On sale, claimed depreciation is recaptured at up to 25%, and gains may owe capital-gains tax (a 1031 exchange can defer both). Figures are a year-1 estimate at your 24.0% rate — not tax advice; consult a CPA.
Schools (NCES district)
- District
- San Francisco Unified
- NCES district ID
- 0634410
- Math proficiency
- 50% ▬ 0.00%
- Reading proficiency
- 56% ▲ 1.00%
- Median HH income
- $81,249
- Composite
- 50.14/100
- National rank
- #4088
- State rank
- #322 of 1400 in CA
Livability — San Francisco
- Score
- 76/100
- State rank
- #90
- US rank
- #3143
Category grades
Schools grade is shown separately in the Schools card above.
Census & demographics
- Census place
- San Francisco, CA
- County
- San Francisco County · 827,552 people
- City population
- 827,552
- Metro
- San Francisco-Oakland-Berkeley, CA
- Population (ZIP)
- 66,865
- Household income
- $158,351
- Rent vs Own
- Severe rent burden
- 2732.0
Population outlook (San Francisco County) Hauer SSP2
- Today (2025)
- 1,030,936 people
- By 2030
- 1,110,409 · +7.7%
- By 2040
- 1,270,010 · +23.2%
- By 2050
- 1,435,001 · +39.2%
- By 2075
- 1,779,074 · +72.6%
- By 2100
- 1,966,767 · +90.8%
Race, ethnicity, and origin ACS 2023
- Neighborhood character
- Highly diverse neighborhood (Simpson 0.70)
- Race & ethnicity
- White 41% Hispanic / Latino 32% Asian 16% Two or more races 15% Black 4% Native American 1%
- Hispanic origin (detail)
- Mexican 16% Puerto Rican 1%
- Common ancestry
- Lithuanian 3% Italian 2% Romanian 2%
- Foreign-born
- 28% · Canada, China, Vietnam
- Languages at home
- 58% English-only · Spanish 27% Chinese 5% Other Indo-European 2%
Political lean MEDSL · San Francisco
- 2024 margin
- Solid D (+64.8) · D 80.3% · R 15.5% · Other 4.1%
- 2008→2024 swing
- -5.7pp toward R · 2008: 70.5pp · 2024: 64.8pp
- All cycles
- 2024: D+64.8 2020: D+72.5 2016: D+76.1 2012: D+70.2 2008: D+70.5
Not yet ingested
- Civics
- —
Market trends
- HPI YoY
- ▼ -1385.62%
- Current HPI
- 267.2424
- Rent YoY
- ▲ 14.54%
- Metro
- San Francisco-Oakland-Berkeley, CA
- State GDP YoY
- ▲ 3.21%
- F500 in state
- 116
Industry mix (Fortune 500 HQ in CA)
| Industry | F500 HQs | Revenue |
|---|---|---|
| Technology | 27 | $1,492B |
|
||
| Financial Services | 3 | $174B |
|
||
| Retail | 3 | $44B |
|
||
| Insurance | 3 | $26B |
|
||
| Media / Entertainment | 2 | $115B |
|
||
| Pharmaceuticals / Biotech | 2 | $62B |
|
||
Price history
+82.9% since first listed4 events — show timeline
- 2026-03-05 Price Changed $1,600,000 bridgeMLS, Bay East AOR, or Contra Costa AOR
- 2026-01-30 Price Changed $1,700,000 bridgeMLS, Bay East AOR, or Contra Costa AOR
- 2025-05-20 Listed $1,800,000 bridgeMLS, Bay East AOR, or Contra Costa AOR
- 2010-02-10 Sold (Public Records) $875,000 Public Records
Property tax history
+4.1%/yrLatest (2010): $4,953 · +2.1% YoY. Source: county tax records.
Cash-flow waterfall
monthlySold comps — $/sqft
last 12 mo · ≤1 miLoading sold comps…