150-29 72nd Rd Unit 4H · New York, NY
Flood risk 6/10 · Moderate
- FEMA flood zone
- X (unshaded)
- Chance of flooding over 30 yrs
- 0.57%
- Est. flood insurance / yr
- $507 – $1,088
Fire risk 1/10 · Minimal
- Est. fire insurance / yr
- $691 – $1,283
Heat risk 7/10 · Major
- Hot days now (above 99°F)
- 7 days/yr
- Hot days in 30 yrs
- 15 days/yr
Wind risk 6/10 · Moderate
- Chance of severe wind over 30 yrs
- 27.0%
Air-quality risk 4/10 · Minor
- Unhealthy air days now
- 6 days/yr
- Unhealthy air days in 30 yrs
- 6 days/yr
Risk factors via First Street. Map © Google.
Why this score? — see what drove the F grade
The composite is a weighted blend of 9 inputs, each scored 0–100. Each bar is that input's sub-score; the figure is the points it added to the 100-point composite (weight × sub-score).
- ARV discount +7.5/15.0
- 1% rule +5.2/10.0
- Schools +5.0/10.0
- Cash flow +4.8/30.0
- Livability +3.8/5.0
- Rent growth +2.5/5.0
- Condition / age +2.5/5.0
- DSCR +0.0/10.0
- Appreciation +0.0/10.0
$268,000
🖨 Deal sheet (PDF) 📄 Offer letter ✓ Due diligence
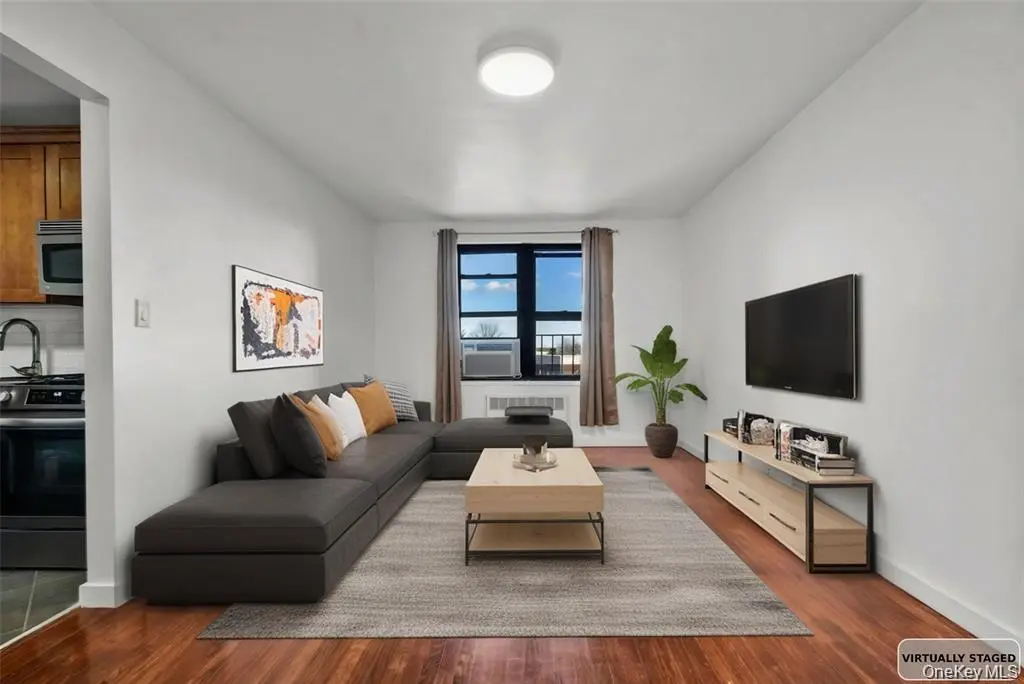
Listing remarks
This beautifully renovated 1-bedroom corner unit in Dara Gardens, a 24-hour gated community, offers abundant natural sunlight with east and south exposures, a modern open-concept kitchen featuring brand-new appliances, gleaming hardwood floors, a fully tiled windowed bathroom, and a bedroom with dual windows and a walk-in closet. Enjoy a wide open view of the sky from every room-bright natural light and endless blue skies make this home feel spacious and peaceful. Low monthly maintenance covers gas, heat, and hot water, while community perks include a pet-friendly atmosphere, on-site laundry, a children's playground, and parking (waitlisted). Conveniently located near shopping, parks, schoo
Key facts
- Built 1956
- Listed 13 days
Property features AI
Exterior
- Parking: No carport; Parking availability: waitlist
- Utilities: Electric service: Con-Edison; Public sewer; Natural gas available; Water available
- Home design: Stock cooperative; Entry level: 4
- Construction: Brick construction
- Exterior features: Brick construction; Not waterfront
Interior
- Kitchen: Dishwasher; Gas range; Refrigerator
- Bedrooms: Total rooms: 4
- Bathrooms: 1 full bathroom
- Heating & cooling: Baseboard heating; Wall/window air conditioning units
- Interior features: First-floor bedroom; Full basement
Neighborhood map
What this means for you Summary
Snapshot
- This is a 1-bed/1.0-bath condo listed at $268k.
Deal economics
- At list price, monthly cash flow is $-661 ($-8k/yr) — negative.
- The deal already cash-flows at list — no discount required.
- Meets the 1% rule at list price ($3k rent vs $268k).
- Cap rate 3.3% vs local median 2.6% in New York — meaningfully above typical; check what's discounted (condition, days-on-market, listing class) to confirm the premium yield is real.
Location & tenants
- Location reads 75/100 on livability (#268 in NY, #4,188 nationally) — a middle-class / working-renter tenant base. Strengths: amenities A+, commute A+, health & safety A; Watch: crime F, cost of living F.
- Market conditions: 260 active listings in the ZIP; 36 comparable units currently listed for rent nearby; rentals at typical pace (median 22d on market — plan ~3-4 weeks tenant-placement turnaround); solid renter incomes; 5,302 units permitted in Queens County in 2024 (4,918 in 5+ unit buildings).
- This rent runs 44% of the median local income ($75k/yr) — at the standard rent-burdened threshold; future hikes will face affordability resistance.
Forward outlook
- Local home prices are declining (-3.0%/yr); year-one equity from $2k of loan paydown is wiped out by about $8k of value loss. Plan a longer hold.
- Queens County population projected at +16% by 2050 — long-run rental-demand tailwind backs the buy-and-hold thesis.
Negotiation context
- Only 14 days on market — expect competitive offers; lowballing is unlikely to land.
- 6 sale attempts since 14y ago; this cycle's ask has dropped $20k (7%) from the opening price — seller is motivated, your offer sets the floor, not the list.
Risks & watch-outs
- Watch-outs: HOA is 35% of rent; built in 1956 — expect roof / HVAC / electrical / plumbing capex.
- Climate carrying-cost: major flood risk; major wind risk, 27% chance of damaging wind over 30y; extreme-heat days projected 7→15/yr by 2055 (HVAC capex compounding) — expect insurance premiums to compound above CPI over the hold.
Questions for the listing agent
- What do current leases actually rent for vs. the listed asking? Can we see a recent rent roll and the last 12 months of T-12 income?
- Built in 1956 — when were the roof, HVAC, electrical panel, plumbing, and water heater last replaced?
- What does the HOA fee cover, when was the last increase, and are there any pending special assessments or reserve-fund shortfalls?
- Any open or pending special assessments — roof, HVAC, plumbing, elevator, façade? What's the per-unit balance and payoff schedule, and is the seller paying it off at close or rolling it to the buyer?
- Is there a deadline driving the sale (1031 exchange, divorce, estate, relocation)? That informs how much negotiation room exists.
- Schools are B-rated — typically a magnet for longer-tenancy family renters. What's the average tenant stay here, and is there a school-zone premium baked into asking?
- Crime grade is F in this area — have there been break-ins, vandalism, or insurance claims at this property in the last 3 years? What carrier currently insures it and at what premium?
- The area grade is low — what's the realistic commute time and amenity access for the typical tenant pool here? Any planned neighborhood developments (good or bad) we should know about?
- What's the average days-on-market for RENTAL listings here right now (not sales)? A rising rental-DOM trend means longer vacancies and softer asking-rent achievability than the comps imply.
- What's the recent tenant-quality profile in this submarket — average credit score on applications, eviction rate, late-payment / NSF rate, and stable-employment percentage? A property-management company in the area should have these aggregated.
- How much new apartment / multifamily construction is in the pipeline within 1–3 miles? Heavy new supply (>2% of stock underway) typically softens rents 12–24 months out; light construction supports rent growth.
Investment metrics
- 1% rule
- 1.02% ✓
- Cap rate
- 3.33%
- Cash-on-cash
- -10.57%
- DSCR
- 0.53
- GRM
- 8.2
CMA / ARV
No comps found within radius.
Projected returns pro-forma
-3.0% appreciation · 3.0% rent growth · sell at horizon
- IRR
- -35.0%
- Equity multiple
- -0.13×
- Total profit
- $-84,886
- Equity at exit
- $39,960
- IRR
- -43.5%
- Equity multiple
- -0.67×
- Total profit
- $-125,546
- Equity at exit
- $23,172
Cash invested: $75,040 (down + closing). Projections, not guarantees.
Landlord ↔ Tenant lean methodology
- Overall (CITY)
- 0 Strongly Tenant-Friendly
- State New York
- 15 Strongly Tenant-Friendly · D+10
- County
- — inherits STATE
- City New York
- 0 Strongly Tenant-Friendly · D+34
ZIP-level market 11367
- Active inventory
- 260
- Price-to-rent
- 8.2×
Monthly cashflow live
- Estimated rent
- $2,727 high interval (Pro) →
- Mortgage (P&I)
- −$1,405
- Tax est. 1.5%
- −$335 /mo · $4,020/yr
- Insurance
- −$112
- HOA est. from 2 same-building comps
- −$963
- Vacancy / Maint / Mgmt
- −$573
- Net cashflow
- $-661
Break-even live
Sensitivity live
| Price | -10% $-476 | -5% $-568 | +0% $-661 | +5% $-753 | +10% $-846 |
|---|---|---|---|---|---|
| Rent | -10% $-876 | -5% $-769 | +0% $-661 | +5% $-553 | +10% $-445 |
| Rate | -1.0pp $-526 | -0.5pp $-593 | base $-661 | +0.5pp $-730 | +1.0pp $-801 |
UW: 25.0% down · 7.5% · 30yr · 1.5% tax · 5.0% vac · 8.0% maint · 8.0% mgmt
Financing live
Cash to close
- Down payment
- $67,000
- Closing costs
- $8,040
- Reserves months
- —
- Total cash needed
- —
Loan-product check · same deal, 3 products live
Conventional
25% down · 7.5% · 30yr
- Down + closing
- —
- Monthly P&I
- —
- Monthly cashflow
- —
- DSCR
- —
- Eligible?
- —
Personal DTI + credit; lowest rate.
DSCR
20% down · 8.5% · 30yr
- Down + closing
- —
- Monthly P&I
- —
- Monthly cashflow
- —
- DSCR
- —
- Eligible?
- —
No personal income docs; deal must DSCR.
Hard money
10% down · 12.0% · 12mo
- Down + closing
- —
- Monthly P&I
- —
- Monthly cashflow
- —
- DSCR
- —
- Eligible?
- —
Short-term bridge; refi at stabilization.
Rent comps 36 comps
| Address | Beds | Baths | Sqft | Rent | $/sqft | DOM | Units | Dist |
|---|---|---|---|---|---|---|---|---|
| 150-25 72nd Rd Flushing, NY | 1.0 | 1.0 | 700 | $2,300 | $3.29 | 25d | 1 | 0.02mi |
| 71-82 Parsons Blvd Unit 503 Kew Gardens Hills, NY | 2.0 | 1.5 | 900 | $4,000 | $4.44 | 25d | 1 | 0.25mi |
| 71-82 Parsons Blvd Unit 702 Kew Gardens Hills, NY | 1.0 | 1.0 | 1000 | $2,900 | $2.90 | 21d | 1 | 0.25mi |
| 71-82 Parsons Blvd Unit 303 Kew Gardens Hills, NY | 2.0 | 1.5 | 900 | $4,000 | $4.44 | 15d | 1 | 0.25mi |
| 71-82 Parsons Blvd Unit 516 Kew Gardens Hills, NY | 2.0 | 1.5 | 900 | $3,500 | $3.89 | 4d | 1 | 0.25mi |
| 7157 161 St Apt 5B Flushing, NY | 2.0 | 2.0 | 1100 | $2,600 | $2.36 | 25d | 1 | 0.43mi |
| 7133 162nd St Unit 3F Fresh Meadows, NY | 2.0 | 2.0 | 850 | $2,700 | $3.18 | 25d | 1 | 0.48mi |
| 163-07 72nd Ave Unit 3G Flushing, NY | 2.0 | 2.0 | 716 | $2,900 | $4.05 | 25d | 1 | 0.53mi |
| 7835 147th St Unit 2E Flushing, NY | 1.0 | 1.0 | 700 | $2,200 | $3.14 | 7d | 1 | 0.57mi |
| 7837 Main St Unit 2G Queens, NY | 1.0 | 1.0 | 700 | $2,300 | $3.29 | 25d | 1 | 0.60mi |
| 14112 78th Rd Unit 1G Flushing, NY | 1.0 | 1.0 | 700 | $2,200 | $3.14 | 25d | 1 | 0.67mi |
| 135-26 78th Ave Unit 2FL Flushing, NY | 2.0 | 1.0 | 900 | $2,800 | $3.11 | 3d | 1 | 0.74mi |
| 16525 Union Tpke Fresh Meadows, NY | 2.0 | 1.0 | 1000 | $2,900 | $2.90 | 25d | 1 | 0.80mi |
| 80-12 165th St Unit 3 Jamaica, NY | 2.0 | 1.5 | 960 | $2,800 | $2.92 | 25d | 1 | 0.82mi |
| 76-40 170th St #1 Flushing, NY | 2.0 | 1.0 | 924 | $2,800 | $3.03 | 0d | 1 | 0.91mi |
| 84-03 Lander St Unit 2B Jamaica, NY | 2.0 | 2.0 | 850 | $3,250 | $3.82 | 25d | 1 | 1.00mi |
| 13915 83rd Ave #717 Jamaica, NY | 1.0 | 1.0 | 800 | $2,400 | $3.00 | 5d | 1 | 1.03mi |
| 14160 84th Rd Unit 2G Jamaica, NY | 1.0 | 1.0 | 700 | $2,200 | $3.14 | 15d | 1 | 1.07mi |
| 141-35 Pershing Cres Unit 1B Jamaica, NY | 1.0 | 1.5 | 1100 | $2,800 | $2.55 | 21d | 1 | 1.09mi |
| 8455 Daniels St Unit 5H Jamaica, NY | 1.0 | 1.0 | 750 | $2,300 | $3.07 | 19d | 1 | 1.10mi |
| 61-41 173rd St Unit 3rd fl Flushing, NY | 2.0 | 1.0 | 1000 | $2,500 | $2.50 | 23d | 1 | 1.20mi |
| 123-40 83rd Ave Unit 2107 Jamaica, NY | 1.0 | 1.0 | 750 | $2,573 | $3.43 | 25d | 1 | 1.29mi |
| 123-40 83rd Ave Unit 8B Queens, NY | 1.0 | 1.0 | 800 | $2,450 | $3.06 | 25d | 1 | 1.29mi |
| 178-05 69th Ave Unit 2 Flushing, NY | 2.0 | 1.0 | 750 | $2,700 | $3.60 | 25d | 1 | 1.29mi |
| 11019 72nd Rd Unit 1B Forest Hills, NY | 1.0 | 1.0 | 750 | $3,200 | $4.27 | 15d | 1 | 1.36mi |
| 7540 Austin St Unit 4HR Forest Hills, NY | 1.0 | 1.0 | 841 | $2,600 | $3.09 | 0d | 1 | 1.39mi |
| 13828 Queens Blvd Unit 7A Briarwood, NY | 2.0 | 1.0 | 810 | $3,600 | $4.44 | 25d | 1 | 1.40mi |
| 13828 Queens Blvd Unit 2E Briarwood, NY | 1.0 | 1.0 | 700 | $2,600 | $3.71 | 8d | 1 | 1.40mi |
| 138-28 Queens Blvd Unit 5G Briarwood, NY | 1.0 | 1.0 | 650 | $2,750 | $4.23 | 25d | 1 | 1.40mi |
| 13828 Queens Blvd Jamaica, NY | 1.0 | 1.0 | 640 | $2,700 | $4.22 | 19d | 1 | 1.40mi |
| 11007 73rd Rd Forest Hills, NY | 1.0 | 1.0 | 950 | $1,800 | $1.89 | 19d | 1 | 1.42mi |
| 10919 72nd Rd Unit 6F Forest Hills, NY | 1.0 | 1.0 | 696 | $3,485 | $5.01 | 12d | 1 | 1.46mi |
| 14832 87th Ave Jamaica, NY | 2.0 | 1.0 | 768 | $2,800 | $3.65 | 19d | 1 | 1.47mi |
| 148-16 87th Ave Unit 2 Jamaica, NY | 2.0 | 1.0 | 700 | $2,300 | $3.29 | 18d | 1 | 1.47mi |
| 10825 72nd Ave Forest Hills, NY | 1.0–2.0 | 1.0 | 700 | $3,500 | $5.00 | 5d | 2 | 1.49mi |
| 108-25 72nd Ave Unit 6B Flushing, NY | 2.0 | 1.0 | 800 | $3,900 | $4.88 | 0d | 1 | 1.49mi |
HOA detail condo
- Monthly dues
- $0 · $0/yr
- Likely covers
- watergassecurity
- Assessments
- None detected in remarks — confirm with the listing agent.
Listing history 11 events
-
2026-06-21days on market $268,000 Active 14 DOM
-
2026-06-18days on market $268,000 Active 11 DOM
-
2026-06-17days on market $268,000 Active 10 DOM
-
2026-06-16days on market $268,000 Active 9 DOM
-
2026-06-15days on market $268,000 Active 8 DOM
-
2026-06-13days on market $268,000 Active 6 DOM
-
2026-06-09days on market $268,000 Active 2 DOM
-
2026-06-08statusdays on market $268,000 Active 1 DOM
-
2026-06-07days on market $268,000 Coming Soon 4 DOM
-
2026-06-04remarks 699-char remark
-
2026-06-04$268,000 Coming Soon 1 DOM
ⓘ Source: listings_history table (triggers on properties + properties_extension) + one-shot
backfill from property_details.listing_events for pre-trigger history.
Climate risk First Street
- Flood 6/10 Major FEMA zone X (unshaded) · 57% chance over 30 yrs
- Wildfire 1/10 Low
- Heat 7/10 Severe 7 d/yr ≥99°F today · 15 d/yr by 30 yrs out
- Wind 6/10 Major 27% chance of damaging wind over 30 yrs
- Air quality 4/10 Moderate 6 unhealthy d/yr today · 6 by 30 yrs out
Nearby sold comps map
Loading sold comps map…
Walkable amenities ~0.75 mi
Loading nearby amenities…
Taxation est. · year 1
- Rental income
- $32,722
- − Mortgage interest
- −$15,012
- − Property taxes
- −$4,020
- − Insurance
- −$1,340
- − Repairs & maintenance
- −$2,618
- − Management
- −$2,618
- − HOA
- −$11,556
- − Depreciation
- −$7,796
- Taxable loss
- −$12,238
- Est. tax savings @ 24.0%
- +$2,937
- After-tax cash flow
- $-4,993/yr
For passive investors: Depreciation is non-cash, so a rental often shows a tax loss while cash-flowing — sheltering income. Rental losses are passive: they offset passive income freely, and up to $25,000/yr can offset ordinary (W-2) income if you actively participate and your MAGI is under $100k (phasing out to $0 by $150k); unused losses carry forward. On sale, claimed depreciation is recaptured at up to 25%, and gains may owe capital-gains tax (a 1031 exchange can defer both). Figures are a year-1 estimate at your 24.0% rate — not tax advice; consult a CPA.
Schools (NCES district)
No district data.
Livability — New York
- Score
- 75/100
- State rank
- #268
- US rank
- #4188
Category grades
Schools grade is shown separately in the Schools card above.
Census & demographics
- Census place
- New York, NY
- County
- Queens County · 1,914,869 people
- City population
- 7,731,280
- Metro
- New York-Newark-Jersey City, NY-NJ-PA
- Population (ZIP)
- 40,923
- Household income
- $75,061
- Rent vs Own
- Severe rent burden
- 2010.0
Population outlook (Queens County) Hauer SSP2
- Today (2025)
- 2,546,320 people
- By 2030
- 2,643,059 · +3.8%
- By 2040
- 2,815,563 · +10.6%
- By 2050
- 2,944,423 · +15.6%
- By 2075
- 3,123,338 · +22.7%
- By 2100
- 3,098,688 · +21.7%
Race, ethnicity, and origin ACS 2023
- Neighborhood character
- Highly diverse neighborhood (Simpson 0.72)
- Race & ethnicity
- White 42% Asian 25% Hispanic / Latino 19% Black 7% Two or more races 7%
- Hispanic origin (detail)
- Puerto Rican 3% Dominican 6%
- Common ancestry
- Scotch-Irish 5% Romanian 3% Hispanic 1%
- Foreign-born
- 41% · China, Canada, Jamaica
- Languages at home
- 41% English-only · Chinese 16% Spanish 15% Russian/Polish/Slavic 9%
Political lean MEDSL · Queens
- 2024 margin
- Strong D (+24.6) · D 62.3% · R 37.7%
- 2008→2024 swing
- -26.2pp toward R · 2008: 50.8pp · 2024: 24.6pp
- All cycles
- 2024: D+24.6 2020: D+45.2 2016: D+53.4 2012: D+58.5 2008: D+50.8
Not yet ingested
- Civics
- —
Market trends
- HPI YoY
- ▼ -211.36%
- Current HPI
- 220.6177
- Rent YoY
- —
- Metro
- New York-Newark-Jersey City, NY-NJ-PA
- State GDP YoY
- ▲ 2.60%
- F500 in state
- 92
Industry mix (Fortune 500 HQ in NY)
| Industry | F500 HQs | Revenue |
|---|---|---|
| Financial Services | 10 | $950B |
|
||
| Consumer Goods | 9 | $162B |
|
||
| Insurance | 4 | $225B |
|
||
| Telecommunications | 2 | $144B |
|
||
| Pharmaceuticals | 2 | $112B |
|
||
| Media / Entertainment | 2 | $69B |
|
||
Price history
+58.8% since first listed16 events — show timeline
- 2026-06-04 Coming Soon $268,000 OneKey® MLS as Distributed by MLS Grid
- 2026-05-04 Listing Removed — OneKey® MLS as Distributed by MLS Grid
- 2025-11-07 Price Changed $269,000 OneKey® MLS as Distributed by MLS Grid
- 2025-08-12 Listed $288,000 OneKey® MLS as Distributed by MLS Grid
- 2025-07-01 Listing Removed — OneKey® MLS as Distributed by MLS Grid
- 2024-12-07 Listed $288,000 OneKey® MLS as Distributed by MLS Grid
- 2023-10-02 Sold (MLS) $240,000 OneKey® MLS as Distributed by MLS Grid
- 2023-07-26 Pending — OneKey® MLS as Distributed by MLS Grid
- 2023-07-08 Listed $255,000 OneKey® MLS as Distributed by MLS Grid
- 2013-11-07 Sold (MLS) $160,000 OneKey® MLS as Distributed by MLS Grid
- 2013-11-07 Sold (MLS) $160,000 MLSLI
- 2013-09-27 Pending — MLSLI
- 2013-09-06 Listed $160,000 MLSLI
- 2013-09-06 Listed $160,000 OneKey® MLS as Distributed by MLS Grid
- 2012-09-06 Listing Removed — OneKey® MLS as Distributed by MLS Grid
- 2012-03-06 Listed $168,800 OneKey® MLS as Distributed by MLS Grid
Cash-flow waterfall
monthlySold comps — $/sqft
last 12 mo · ≤1 miLoading sold comps…