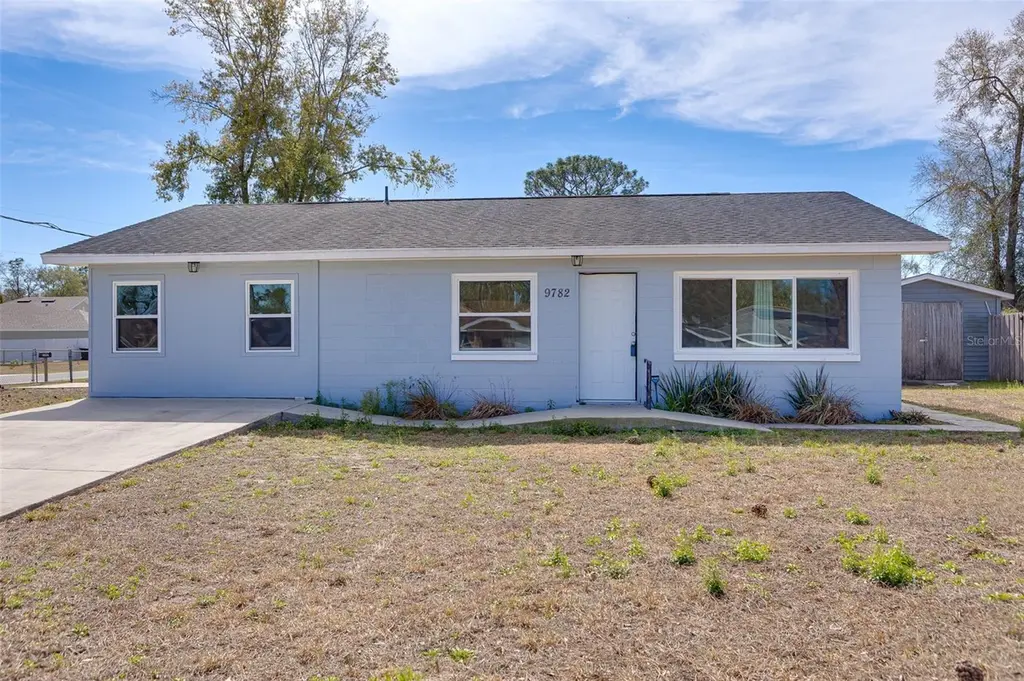
9782 SE 157th Ln · The Villages, FL
Flood risk 1/10 · Minimal
- FEMA flood zone
- X (unshaded)
- Chance of flooding over 30 yrs
- 0.0%
- Est. flood insurance / yr
- $507 – $1,088
Fire risk 4/10 · Minor
- Est. fire insurance / yr
- $947 – $1,759
Heat risk 8/10 · Major
- Hot days now (above 109°F)
- 7 days/yr
- Hot days in 30 yrs
- 21 days/yr
Wind risk 9/10 · Severe
- Chance of severe wind over 30 yrs
- 99.0%
Air-quality risk 3/10 · Minor
- Unhealthy air days now
- 2 days/yr
- Unhealthy air days in 30 yrs
- 2 days/yr
Risk factors via First Street. Map © Google.
Why this score? — see what drove the C- grade
The composite is a weighted blend of 9 inputs, each scored 0–100. Each bar is that input's sub-score; the figure is the points it added to the 100-point composite (weight × sub-score).
- Cash flow +16.8/30.0
- ARV discount +11.8/15.0
- DSCR +5.2/10.0
- 1% rule +4.4/10.0
- Schools +3.6/10.0
- Livability +3.5/5.0
- Rent growth +2.5/5.0
- Condition / age +2.5/5.0
- Appreciation +0.0/10.0
$209,900
🖨 Deal sheet 📄 Offer letter ✓ Due diligence
Listing remarks MLS
This cute 3/1 home has been completely updated: Roof - 2018, HVAC-2021, Water Pump/Tank -2020, Windows-2021. This home sits on a large corner lot, completely fenced with a storage shed, dog kennel, and a large dog run in the backyard. Did I mention location? Great location close to The Villages, Belleview, and less than one mile to Lake Weir. Call today and schedule your personal showing.
Key facts
- Large dog run
- Large corner lot
- Great location
Tags
Neighborhood map
What this means for you Summary
Snapshot
- This is a 3-bed/1.0-bath single-family listed at $210k.
Deal economics
- At list price, monthly cash flow is $134 ($2k/yr) — positive.
- The deal already cash-flows at list — no discount required.
- To meet the 1% rule (rent ≥ 1% of price), the offer needs to be $197k (6.2% below list).
- Recommended offer: $191k (9.0% below list) — sets the bar for market timing.
- Cap rate 7.1% vs local median 5.0% in The Villages — top-decile yield for the area; either an underpriced asset or a hidden risk that comps aren't pricing in. Stress-test before assuming the spread holds.
Location & tenants
- Location reads 70/100 on livability (#431 in FL) — a middle-class / working-renter tenant base. Strengths: schools A+, crime A+, housing A; Watch: amenities F, commute F, health & safety F.
- Marion (rural): math 42% / reading 43% proficiency, ranked #61 of 73 in FL (top 84%) — families likely to look elsewhere, expect single-tenant / working-renter base with shorter leases; 61% free/reduced lunch — lower-income household profile, screen leases tightly.
- Market conditions: 705 active listings in the ZIP; 12 comparable units currently listed for rent nearby; rentals at typical pace (median 21d on market — plan ~3-4 weeks tenant-placement turnaround); 7,071 units permitted in Marion County in 2024 (534 in 5+ unit buildings).
- This rent runs 35% of the median local income ($67k/yr) — at the standard rent-burdened threshold; future hikes will face affordability resistance.
Forward outlook
- Local home prices are declining (-3.0%/yr); year-one equity from $1k of loan paydown is wiped out by about $6k of value loss. Plan a longer hold.
- Marion County population projected at +13% by 2050 — modest demand growth; plan on rents tracking national, not racing it.
Negotiation context
- It's been on market 108 days — a 9% lower offer ($191k) is reasonable based on typical stale-listing flexibility.
- 4 sale attempts since 8y ago; this cycle's ask has dropped $15k (7%) from the opening price — seller is motivated, your offer sets the floor, not the list.
- Current owner paid $93k; list at $210k implies a 126% gain — meaningful room to come down on a strong offer.
Risks & watch-outs
- Climate carrying-cost: severe wind risk, 99% chance of damaging wind over 30y; extreme-heat days projected 7→21/yr by 2055 (HVAC capex compounding) — expect insurance premiums to compound above CPI over the hold.
Questions for the listing agent
- It's been on market 108 days. Have you received any prior offers? Is the seller open to a 9% concession, seller financing, or rate buy-down credit?
- Built in 1974 — when were the roof, HVAC, electrical panel, plumbing, and water heater last replaced?
- Why hasn't it sold? Are there any deal-killer items the seller is aware of (foundation, flood, title, zoning, code violations)?
- Is there a deadline driving the sale (1031 exchange, divorce, estate, relocation)? That informs how much negotiation room exists.
- Schools are A-rated — typically a magnet for longer-tenancy family renters. What's the average tenant stay here, and is there a school-zone premium baked into asking?
- What's the average days-on-market for RENTAL listings here right now (not sales)? A rising rental-DOM trend means longer vacancies and softer asking-rent achievability than the comps imply.
- What's the recent tenant-quality profile in this submarket — average credit score on applications, eviction rate, late-payment / NSF rate, and stable-employment percentage? A property-management company in the area should have these aggregated.
- How much new for-sale + rental construction is in the pipeline within 1–3 miles? Heavy new supply typically softens prices + rents 12–24 months out; constrained supply supports both.
Investment metrics
- 1% rule
- 0.94% ✗
- Cap rate
- 7.06%
- Cash-on-cash
- 2.73%
- DSCR
- 1.12
- GRM
- 8.9
CMA / ARV
- ARV (median comp)
- $232,189
- List price
- $209,900
- Delta
- -9.60%
- Verdict
- FAIR
- Comps
- 20 within 1.0 mi
Show comp detail 7 sales within ~0.75 mi
| Address | Dist | Beds/Ba | Sqft | Sold | Price | $/sf | Match |
|---|---|---|---|---|---|---|---|
| 15641 SE 97th Ave | 0.16mi | 3/2.0 | 1,232 (+5%) | 17mo | $228,980 | $186 | 66 |
| 15828 SE 98th Ter | 0.12mi | 3/2.0 | 1,349 (+15%) | 12mo | $287,000 | $213 | 56 |
| 9140 SE 155th Pl | 0.68mi | 3/2.0 | 1,140 (-3%) | 4mo | $125,000 | $110 | 56 |
| 9289 SE 159th Ln | 0.42mi | 3/2.0 | 1,232 (+5%) | 17mo | $232,500 | $189 | 54 |
| 10496 SE Sunset Harbor Rd | 0.74mi | 3/2.0 | 1,092 (-7%) | 2mo | $206,000 | $189 | 48 |
| 9558 SE 161st St | 0.37mi | 2/1.0 (-1) | 1,066 (-9%) | 20mo | $77,000 | $72 | 45 |
| 10201 SE Sunset Harbor Rd | 0.75mi | 2/1.0 (-1) | 1,056 (-10%) | 6mo | $150,000 | $142 | 38 |
Match score weights: distance 35% · size 25% · config 20% · recency 20%. Top-matched comps best support the ARV.
Projected returns pro-forma
-3.0% appreciation · 3.0% rent growth · sell at horizon
- IRR
- -12.0%
- Equity multiple
- 0.57×
- Total profit
- $-25,476
- Equity at exit
- $31,297
- IRR
- -2.8%
- Equity multiple
- 0.81×
- Total profit
- $-11,158
- Equity at exit
- $18,148
Cash invested: $58,772 (down + closing). Projections, not guarantees.
Landlord ↔ Tenant lean methodology
- Overall (STATE)
- 87 Strongly Landlord-Friendly
- State Florida
- 87 Strongly Landlord-Friendly · R+3
- County
- — inherits STATE
- City
- — inherits STATE
ZIP-level market 34491
- Home prices YoY
- -35.0%
- Active inventory
- 705
- Price-to-rent
- 8.9×
Monthly cashflow live
- Estimated rent
- $1,969 high interval (Pro) →
- Mortgage (P&I)
- −$1,101
- Tax from tax record
- −$234 /mo · $2,806/yr
- Insurance
- −$87
- HOA
- −$0
- Vacancy / Maint / Mgmt
- −$414
- Net cashflow
- $134
Break-even live
UW: 25.0% down · 7.5% · 30yr · 1.5% tax · 5.0% vac · 8.0% maint · 8.0% mgmt
Financing live
Cash to close
- Down payment
- $52,475
- Closing costs
- $6,297
- Reserves months
- —
- Total cash needed
- —
Loan-product check · same deal, 3 products live
Conventional
25% down · 7.5% · 30yr
- Down + closing
- —
- Monthly P&I
- —
- Monthly cashflow
- —
- DSCR
- —
- Eligible?
- —
Personal DTI + credit; lowest rate.
DSCR
20% down · 8.5% · 30yr
- Down + closing
- —
- Monthly P&I
- —
- Monthly cashflow
- —
- DSCR
- —
- Eligible?
- —
No personal income docs; deal must DSCR.
Hard money
10% down · 12.0% · 12mo
- Down + closing
- —
- Monthly P&I
- —
- Monthly cashflow
- —
- DSCR
- —
- Eligible?
- —
Short-term bridge; refi at stabilization.
Rent comps 12 comps
| Address | Beds | Baths | Sqft | Rent | $/sqft | DOM | Units | Dist |
|---|---|---|---|---|---|---|---|---|
| 10326 SE 162nd Place Rd Summerfield, FL | 3.0 | 2.0 | 1419 | $2,300 | $1.62 | 13d | 1 | 0.68mi |
| 9195 SE 163rd St Summerfield, FL | 3.0 | 2.0 | 1410 | $1,800 | $1.28 | 21d | 1 | 0.77mi |
| 9990 SE 166th St Summerfield, FL | 3.0 | 2.0 | 962 | $1,395 | $1.45 | 13d | 1 | 0.82mi |
| 8721 SE 157th St Summerfield, FL | 3.0 | 2.0 | 1236 | $1,650 | $1.33 | 21d | 1 | 1.08mi |
| 9523 SE 168th Maplesong Ln The Villages, FL | 3.0 | 2.0 | 1265 | $1,975 | $1.56 | 21d | 1 | 1.09mi |
| 16962 SE 94th Sunnybrook Cir The Villages, FL | 2.0 | 2.0 | 1160 | $2,000 | $1.72 | 21d | 1 | 1.19mi |
| 11001 SE Sunset Harbor Rd Unit A08 Summerfield, FL | 2.0 | 1.5 | 1200 | $2,000 | $1.67 | 21d | 1 | 1.26mi |
| 11001 SE Sunset Harbor Rd Unit H52 Summerfield, FL | 2.0 | 2.5 | 1224 | $1,440 | $1.18 | 21d | 1 | 1.26mi |
| 11001 SE Sunset Harbor Rd Summerfield, FL | 2.0 | 1.5–2.0 | 1244 | $1,770 | $1.42 | 21d | 2 | 1.29mi |
| 17199 SE 97th Ter Summerfield, FL | 3.0 | 2.0 | 1404 | $1,990 | $1.42 | 21d | 1 | 1.39mi |
| 8364 SE 158th Pl Summerfield, FL | 3.0 | 2.0 | 1374 | $2,000 | $1.46 | 13d | 1 | 1.42mi |
| 8352 SE 158th Pl Summerfield, FL | 3.0 | 2.0 | 1232 | $2,000 | $1.62 | 13d | 1 | 1.43mi |
Listing history 28 events
-
2026-06-18days on market $209,900 Active 108 DOM
-
2026-06-17days on market $209,900 Active 107 DOM
-
2026-06-16days on market $209,900 Active 106 DOM
-
2026-06-15days on market $209,900 Active 105 DOM
-
2026-06-14days on market $209,900 Active 103 DOM
-
2026-06-13pricedays on market $209,900 Active 102 DOM
-
2026-06-10days on market $215,000 Active 100 DOM
-
2026-06-09days on market $215,000 Active 99 DOM
-
2026-06-08days on market $215,000 Active 98 DOM
-
2026-06-07days on market $215,000 Active 97 DOM
-
2026-06-03days on market $215,000 Active 93 DOM
-
2026-06-02days on market $215,000 Active 92 DOM
-
2026-06-01days on market $215,000 Active 91 DOM
-
2026-05-31days on market $215,000 Active 90 DOM
-
2026-05-30days on market $215,000 Active 89 DOM
-
2026-04-17price $215,000 394-char remark
Show marketing remark (394 chars)
This cute 3/1 home has been completely updated: Roof - 2018, HVAC-2021, Water Pump/Tank -2020, Windows-2021. This home sits on a large corner lot, completely fenced with a storage shed, dog kennel, and a large dog run in the backyard. Did I mention location? Great location close to The Villages, Belleview, and less than one mile to Lake Weir. Call today and schedule your personal showing.
-
2026-03-18price $219,900 394-char remark
Show marketing remark (394 chars)
This cute 3/1 home has been completely updated: Roof - 2018, HVAC-2021, Water Pump/Tank -2020, Windows-2021. This home sits on a large corner lot, completely fenced with a storage shed, dog kennel, and a large dog run in the backyard. Did I mention location? Great location close to The Villages, Belleview, and less than one mile to Lake Weir. Call today and schedule your personal showing.
-
2026-03-02$224,900 Active 394-char remark
Show marketing remark (394 chars)
This cute 3/1 home has been completely updated: Roof - 2018, HVAC-2021, Water Pump/Tank -2020, Windows-2021. This home sits on a large corner lot, completely fenced with a storage shed, dog kennel, and a large dog run in the backyard. Did I mention location? Great location close to The Villages, Belleview, and less than one mile to Lake Weir. Call today and schedule your personal showing.
-
2025-07-14historical $1,550
-
2025-05-28$1,550
-
2023-08-15historical
-
2023-05-08$229,900 Active
-
2018-11-29soldstatus $93,000
-
2018-11-28soldstatus $93,000
-
2018-06-18$100,000
-
2000-12-27soldstatus $46,900
-
1986-03-01soldstatus $38,500
-
1982-05-01soldstatus $23,000
ⓘ Source: listings_history table (triggers on properties + properties_extension) + one-shot
backfill from property_details.listing_events for pre-trigger history.
Tax reassessment forecast FL · Resets to sale price
- Current annual tax
- $2,806 · $234/mo
- Projected year-2 tax
- $2,806 · $234/mo
- Expected delta
- $0/yr ($0/mo · 0.0%)
ⓘ Screening estimate from a state-policy table — verify with the county assessor before closing.
Climate risk First Street
- Flood 1/10 Low FEMA zone X (unshaded) · 0% chance over 30 yrs
- Wildfire 4/10 Moderate
- Heat 8/10 Severe 7 d/yr ≥109°F today · 21 d/yr by 30 yrs out
- Wind 9/10 Extreme 99% chance of damaging wind over 30 yrs
- Air quality 3/10 Moderate 2 unhealthy d/yr today · 2 by 30 yrs out
Nearby sold comps map
Loading sold comps map…
Walkable amenities ~0.75 mi
Loading nearby amenities…
Taxation est. · year 1
- Rental income
- $23,633
- − Mortgage interest
- −$11,758
- − Property taxes
- −$2,806
- − Insurance
- −$1,050
- − Repairs & maintenance
- −$1,891
- − Management
- −$1,891
- − Depreciation
- −$6,106
- Taxable loss
- −$1,867
- Est. tax savings @ 24.0%
- +$448
- After-tax cash flow
- $2,054/yr
For passive investors: Depreciation is non-cash, so a rental often shows a tax loss while cash-flowing — sheltering income. Rental losses are passive: they offset passive income freely, and up to $25,000/yr can offset ordinary (W-2) income if you actively participate and your MAGI is under $100k (phasing out to $0 by $150k); unused losses carry forward. On sale, claimed depreciation is recaptured at up to 25%, and gains may owe capital-gains tax (a 1031 exchange can defer both). Figures are a year-1 estimate at your 24.0% rate — not tax advice; consult a CPA.
Schools (NCES district)
- District
- Marion
- NCES district ID
- 1201260
- Math proficiency
- 42% ▼ -7.00%
- Reading proficiency
- 43% ▼ -4.00%
- Median HH income
- $40,015
- Composite
- 35.61/100
- National rank
- #4890
- State rank
- #61 of 73 in FL
Livability — The Villages
- Score
- 70/100
- State rank
- #431
- US rank
- #7363
Category grades
Schools grade is shown separately in the Schools card above.
Census & demographics
- County
- Marion County · 315,796 people
- City population
- 83,973
- Metro
- Ocala, FL
- Population (ZIP)
- 33,318
- Household income
- $66,679
- Rent vs Own
- Severe rent burden
- 256.0
Population outlook (Marion County) Hauer SSP2
- Today (2025)
- 365,905 people
- By 2030
- 376,768 · +3.0%
- By 2040
- 396,555 · +8.4%
- By 2050
- 412,723 · +12.8%
- By 2075
- 446,090 · +21.9%
- By 2100
- 436,193 · +19.2%
Race, ethnicity, and origin ACS 2023
- Neighborhood character
- Predominantly White (77%)
- Race & ethnicity
- White 77% Hispanic / Latino 14% Two or more races 9% Black 4% Asian 2%
- Hispanic origin (detail)
- Mexican 3% Puerto Rican 6% Cuban 1%
- Common ancestry
- Lithuanian 3% Slovak 2% Romanian 2%
- Foreign-born
- 8% · Canada, Vietnam, Jamaica
- Languages at home
- 85% English-only · Spanish 11% Vietnamese 1% French/Haitian/Cajun 1%
Political lean MEDSL · Marion
- 2024 margin
- Solid R (+31.6) · D 33.8% · R 65.5%
- 2008→2024 swing
- -20.0pp toward R · 2008: -11.6pp · 2024: -31.6pp
- All cycles
- 2024: R+31.6 2020: R+25.9 2016: R+26.2 2012: R+16.2 2008: R+11.6
Not yet ingested
- Civics
- —
Market trends
- HPI YoY
- ▼ -107.67%
- Current HPI
- 200.0792
- Rent YoY
- —
- Metro
- Ocala, FL
- State GDP YoY
- ▲ 3.28%
- F500 in state
- 36
Industry mix (Fortune 500 HQ in FL)
| Industry | F500 HQs | Revenue |
|---|---|---|
| Industrial Technology | 2 | $29B |
|
||
| Insurance | 2 | $17B |
|
||
| Retail | 1 | $60B |
|
||
| Technology Distribution | 1 | $58B |
|
||
| Homebuilding | 1 | $35B |
|
||
| Technology Manufacturing | 1 | $35B |
|
||
Price history
+834.8% since first listed13 events — show timeline
- 2026-04-17 Price Changed $215,000 Stellar MLS as Distributed by MLS Grid
- 2026-03-18 Price Changed $219,900 Stellar MLS as Distributed by MLS Grid
- 2026-03-02 Listed $224,900 Stellar MLS as Distributed by MLS Grid
- 2025-07-14 Rental Removed $1,550 STELLARMLS
- 2025-05-28 Listed for Rent $1,550 STELLARMLS
- 2023-08-15 Listing Removed — Stellar MLS as Distributed by MLS Grid
- 2023-05-08 Listed $229,900 Stellar MLS as Distributed by MLS Grid
- 2018-11-29 Sold (Public Records) $93,000 Public Records
- 2018-11-28 Sold (MLS) $93,000 Stellar MLS as Distributed by MLS Grid
- 2018-06-18 Listed $100,000 Stellar MLS as Distributed by MLS Grid
- 2000-12-27 Sold (Public Records) $46,900 Public Records
- 1986-03-01 Sold (Public Records) $38,500 Public Records
- 1982-05-01 Sold (Public Records) $23,000 Public Records
Property tax history
+6.7%/yrLatest (2025): $2,806 · +9.3% YoY. Source: county tax records.
Cash-flow waterfall
monthlySold comps — $/sqft
last 12 mo · ≤1 miLoading sold comps…