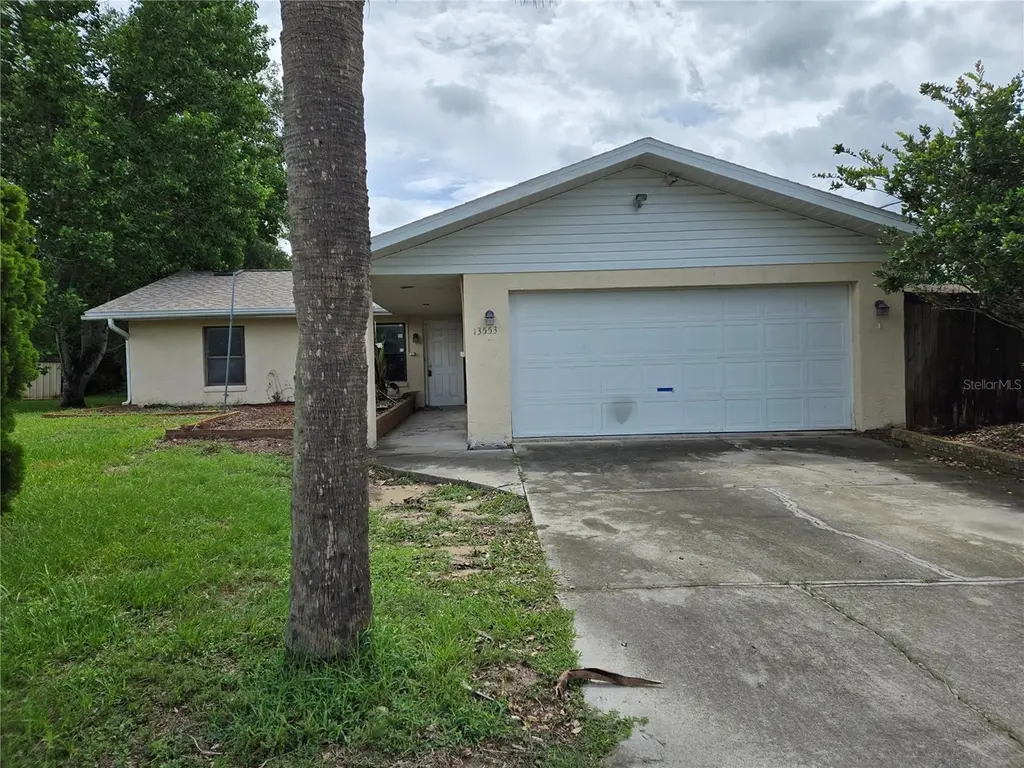
13553 SE 39th Ter · Belleview, FL
Flood risk 1/10 · Minimal
- FEMA flood zone
- X (unshaded)
- Chance of flooding over 30 yrs
- 0.0%
- Est. flood insurance / yr
- $507 – $1,088
Fire risk 4/10 · Minor
- Est. fire insurance / yr
- $947 – $1,759
Heat risk 8/10 · Major
- Hot days now (above 108°F)
- 7 days/yr
- Hot days in 30 yrs
- 22 days/yr
Wind risk 9/10 · Severe
- Chance of severe wind over 30 yrs
- 99.0%
Air-quality risk 3/10 · Minor
- Unhealthy air days now
- 3 days/yr
- Unhealthy air days in 30 yrs
- 4 days/yr
Risk factors via First Street. Map © Google.
Why this score? — see what drove the B grade
The composite is a weighted blend of 9 inputs, each scored 0–100. Each bar is that input's sub-score; the figure is the points it added to the 100-point composite (weight × sub-score).
- Cash flow +27.5/30.0
- ARV discount +15.0/15.0
- DSCR +9.7/10.0
- 1% rule +6.7/10.0
- Schools +3.6/10.0
- Livability +3.5/5.0
- Rent growth +2.5/5.0
- Condition / age +2.5/5.0
- Appreciation +0.0/10.0
$163,275
🖨 Deal sheet 📄 Offer letter ✓ Due diligence
Listing remarks MLS
BELLEVIEW SCHOOL DISTRICT GREAT ACCESS TO I-75, BELLEVIEW, OCALA AND THE VILLAGES. SPACIOUS CORNER LOT, 12 X 24 FLORIDA ROOM, NEW ROOF IN 2004, NEW A/C SHOW AND SELL, SOLD AS IS WITH RIGHT RIGHT TO INSPECT.
Key facts
- Covered deck
- Huge bonus room
- Massive living room
Tags
Property features AI
Finance
- Other: Property zoning: R1; Property type/subtype: Residential — Single Family Residence; Furnished status: Unfurnished
- HOA & community: No association indicated
Exterior
- Parking: Attached 2-car garage (20 x 22)
- Utilities: Electricity connected; Water connected; Septic tank
- Home design: Single family residence; Residential property; One story; South-facing
- Construction: Block and stucco construction; Shingle roof; Slab foundation; Built on 0.3-acre lot (approx. 1/4 to less than 1/2 acre)
- Exterior features: Covered patio/porch; Deck; Private mailbox; Property located in-county; Asphalt road access
Interior
- Kitchen: Appliances: Other
- Bedrooms: 3 bedrooms
- Flooring: Carpet; Laminate
- Bathrooms: 2 full bathrooms
- Heating & cooling: Central heating (electric); Central air conditioning
- Interior features: Ceiling fans; Open floorplan; Living room/dining room combo; Split bedroom layout; Walk-in closet(s)
- Laundry & utility: Laundry located in the garage
Neighborhood map
What this means for you Summary
Snapshot
- This is a 3-bed/2.0-bath single-family listed at $163k.
Deal economics
- At list price, monthly cash flow is $485 ($6k/yr) — positive.
- The deal already cash-flows at list — no discount required.
- Meets the 1% rule at list price ($2k rent vs $163k).
- Recommended offer: $161k (1.5% below list) — sets the bar for market timing.
- Cap rate 9.9% vs local median 4.5% in Belleview — top-decile yield for the area; either an underpriced asset or a hidden risk that comps aren't pricing in. Stress-test before assuming the spread holds.
Location & tenants
- Location reads 69/100 on livability (#458 in FL) — a middle-class / working-renter tenant base. Strengths: cost of living A+, housing A+, health & safety A+; Watch: crime F, amenities F, commute F.
- Marion (rural): math 42% / reading 43% proficiency, ranked #61 of 73 in FL (top 84%) — families likely to look elsewhere, expect single-tenant / working-renter base with shorter leases; 61% free/reduced lunch — lower-income household profile, screen leases tightly.
- Zoned schools: Belleview-Santos Elementary School (math 41% / reading 41%, grade F, #1,454 of 2,144 statewide, top 69%, 570 students, 66% FRL); Belleview High School (math 31% / reading 46%, grade F, #321 of 667 statewide, top 49%, 1,783 students, 56% FRL) — zoned schools at 61% FRL track the district average.
- Market conditions: 705 active listings in the ZIP; 9 comparable units currently listed for rent nearby; rentals at typical pace (median 21d on market — plan ~3-4 weeks tenant-placement turnaround); 7,071 units permitted in Marion County in 2024 (534 in 5+ unit buildings).
- This rent runs 34% of the median local income ($67k/yr) — at the standard rent-burdened threshold; future hikes will face affordability resistance.
Forward outlook
- Local home prices are declining (-3.0%/yr); year-one equity from $1k of loan paydown is wiped out by about $5k of value loss. Plan a longer hold.
- Marion County population projected at +13% by 2050 — modest demand growth; plan on rents tracking national, not racing it.
- At projected returns (-3.0% appreciation + 3.0% rent growth), your $46k cash investment doubles in ~9 years — after that, you're playing with house money.
Negotiation context
- It's been on market 20 days — a 2% lower offer ($161k) is reasonable based on typical stale-listing flexibility.
- 3 sale attempts since 16y ago with the ask held roughly flat each time — persistent listings suggest the price (not the market) is what's stuck; bring a comps-based counter.
- Current owner paid $60k; list at $163k implies a 172% gain — meaningful room to come down on a strong offer.
Risks & watch-outs
- Climate carrying-cost: severe wind risk, 99% chance of damaging wind over 30y; extreme-heat days projected 7→22/yr by 2055 (HVAC capex compounding) — expect insurance premiums to compound above CPI over the hold.
Questions for the listing agent
- Is there a deadline driving the sale (1031 exchange, divorce, estate, relocation)? That informs how much negotiation room exists.
- Schools are D-rated, which usually means shorter tenancies and higher turnover. Who's the typical renter profile here, and what's been the actual vacancy rate?
- Crime grade is F in this area — have there been break-ins, vandalism, or insurance claims at this property in the last 3 years? What carrier currently insures it and at what premium?
- What's the average days-on-market for RENTAL listings here right now (not sales)? A rising rental-DOM trend means longer vacancies and softer asking-rent achievability than the comps imply.
- What's the recent tenant-quality profile in this submarket — average credit score on applications, eviction rate, late-payment / NSF rate, and stable-employment percentage? A property-management company in the area should have these aggregated.
- How much new for-sale + rental construction is in the pipeline within 1–3 miles? Heavy new supply typically softens prices + rents 12–24 months out; constrained supply supports both.
Investment metrics
- 1% rule
- 1.17% ✓
- Cap rate
- 9.86%
- Cash-on-cash
- 12.73%
- DSCR
- 1.57
- GRM
- 7.2
CMA / ARV
- ARV (on-the-fly)
- $243,432
- Comps found
- 12
Show comp detail 12 sales within ~0.75 mi
| Address | Dist | Beds/Ba | Sqft | Sold | Price | $/sf | Match |
|---|---|---|---|---|---|---|---|
| 3647 SE 132nd Pl | 0.44mi | 3/2.0 | 1,286 (-0%) | 1mo | $231,800 | $180 | 79 |
| 3839 SE 132nd Pl | 0.34mi | 3/2.0 | 1,334 (+4%) | 10mo | $269,990 | $202 | 70 |
| 3435 SE 137th St | 0.51mi | 3/2.0 | 1,212 (-6%) | 0mo | $225,000 | $186 | 66 |
| 4333 SE 140th St | 0.53mi | 3/2.0 | 1,240 (-4%) | 5mo | $180,900 | $146 | 65 |
| 4025 SE 139th Ln | 0.41mi | 3/2.0 | 1,380 (+7%) | 9mo | $245,000 | $178 | 62 |
| 13792 SE 42nd Ave | 0.44mi | 3/2.0 | 1,439 (+12%) | 1mo | $272,500 | $189 | 59 |
| 4387 SE 132nd Pl | 0.42mi | 3/2.0 | 1,439 (+12%) | 12mo | $279,300 | $194 | 51 |
| 14173 SE 41st Ter | 0.66mi | 2/2.0 (-1) | 1,200 (-7%) | 3mo | $200,000 | $167 | 50 |
| 13520 SE 47th Ave | 0.64mi | 3/2.0 | 1,408 (+9%) | 6mo | $150,000 | $107 | 50 |
| 4381 SE 132nd Pl | 0.47mi | 3/2.0 | 1,439 (+12%) | 12mo | $285,900 | $199 | 48 |
| 14060 SE 44th Ave | 0.63mi | 3/2.0 | 1,121 (-13%) | 6mo | $224,900 | $201 | 44 |
| 14289 SE 43rd Ter | 0.73mi | 3/2.0 | 1,119 (-13%) | 1mo | $227,900 | $204 | 43 |
Match score weights: distance 35% · size 25% · config 20% · recency 20%. Top-matched comps best support the ARV.
Projected returns pro-forma
-3.0% appreciation · 3.0% rent growth · sell at horizon
- IRR
- 2.5%
- Equity multiple
- 1.10×
- Total profit
- $4,389
- Equity at exit
- $24,345
- IRR
- 12.1%
- Equity multiple
- 1.95×
- Total profit
- $43,434
- Equity at exit
- $14,117
Cash invested: $45,717 (down + closing). Projections, not guarantees.
Landlord ↔ Tenant lean methodology
- Overall (STATE)
- 87 Strongly Landlord-Friendly
- State Florida
- 87 Strongly Landlord-Friendly · R+3
- County
- — inherits STATE
- City
- — inherits STATE
ZIP-level market 34491
- Home prices YoY
- -35.0%
- Active inventory
- 705
- Price-to-rent
- 7.2×
Monthly cashflow live
- Estimated rent
- $1,902 high interval (Pro) →
- Mortgage (P&I)
- −$856
- Tax from tax record
- −$94 /mo · $1,123/yr
- Insurance
- −$68
- HOA
- −$0
- Vacancy / Maint / Mgmt
- −$399
- Net cashflow
- $485
Break-even live
UW: 25.0% down · 7.5% · 30yr · 1.5% tax · 5.0% vac · 8.0% maint · 8.0% mgmt
Financing live
Cash to close
- Down payment
- $40,819
- Closing costs
- $4,898
- Reserves months
- —
- Total cash needed
- —
Loan-product check · same deal, 3 products live
Conventional
25% down · 7.5% · 30yr
- Down + closing
- —
- Monthly P&I
- —
- Monthly cashflow
- —
- DSCR
- —
- Eligible?
- —
Personal DTI + credit; lowest rate.
DSCR
20% down · 8.5% · 30yr
- Down + closing
- —
- Monthly P&I
- —
- Monthly cashflow
- —
- DSCR
- —
- Eligible?
- —
No personal income docs; deal must DSCR.
Hard money
10% down · 12.0% · 12mo
- Down + closing
- —
- Monthly P&I
- —
- Monthly cashflow
- —
- DSCR
- —
- Eligible?
- —
Short-term bridge; refi at stabilization.
Rent comps 9 comps
| Address | Beds | Baths | Sqft | Rent | $/sqft | DOM | Units | Dist |
|---|---|---|---|---|---|---|---|---|
| 3820 SE 136th Pl Summerfield, FL | 3.0 | 2.0 | 1265 | $1,745 | $1.38 | 21d | 1 | 0.17mi |
| 3384 SE 138th St Summerfield, FL | 3.0 | 2.0 | 1265 | $1,745 | $1.38 | 21d | 1 | 0.61mi |
| 3780 SE 141st Ln Summerfield, FL | 3.0 | 2.0 | 1066 | $1,525 | $1.43 | 13d | 1 | 0.65mi |
| 3780 SE 141st Ln Summerfield, FL | 3.0 | 2.0 | 1066 | $1,595 | $1.50 | 21d | 1 | 0.65mi |
| 3934 SE 142nd St Summerfield, FL | 3.0 | 2.0 | 1000 | $1,499 | $1.50 | 13d | 1 | 0.68mi |
| 13609 SE 53rd Ave Summerfield, FL | 3.0 | 2.0 | 1270 | $1,940 | $1.53 | 21d | 1 | 1.21mi |
| 13705 SE 54th Ct Summerfield, FL | 3.0 | 2.0 | 1416 | $1,895 | $1.34 | 21d | 1 | 1.34mi |
| 13678 SE 55th Ave Summerfield, FL | 3.0 | 2.0 | 960 | $1,499 | $1.56 | 21d | 1 | 1.37mi |
| 14025 SE 54th Ct Summerfield, FL | 2.0 | 1.5 | 1008 | $1,500 | $1.49 | 13d | 1 | 1.41mi |
Listing history 16 events
-
2026-06-18days on market $163,275 Active 20 DOM
-
2026-06-17days on market $163,275 Active 19 DOM
-
2026-06-16days on market $163,275 Active 18 DOM
-
2026-06-15days on market $163,275 Active 17 DOM
-
2026-06-14days on market $163,275 Active 15 DOM
-
2026-06-13days on market $163,275 Active 14 DOM
-
2026-06-10days on market $163,275 Active 12 DOM
-
2026-06-09days on market $163,275 Active 11 DOM
-
2026-06-08days on market $163,275 Active 10 DOM
-
2026-06-07days on market $163,275 Active 9 DOM
-
2026-06-03days on market $163,275 Active 5 DOM
-
2026-06-02days on market $163,275 Active 4 DOM
-
2026-06-01days on market $163,275 Active 3 DOM
-
2026-05-31days on market $163,275 Active 2 DOM
-
2026-05-30remarks 246-char remark
-
2026-05-30$163,275 Active 1 DOM
ⓘ Source: listings_history table (triggers on properties + properties_extension) + one-shot
backfill from property_details.listing_events for pre-trigger history.
Tax reassessment forecast FL · Resets to sale price
- Current annual tax
- $1,123 · $94/mo
- Projected year-2 tax
- $1,355 · $113/mo
- Expected delta
- +$232/yr (+$19/mo · 20.6%)
ⓘ Screening estimate from a state-policy table — verify with the county assessor before closing.
Climate risk First Street
- Flood 1/10 Low FEMA zone X (unshaded) · 0% chance over 30 yrs
- Wildfire 4/10 Moderate
- Heat 8/10 Severe 7 d/yr ≥108°F today · 22 d/yr by 30 yrs out
- Wind 9/10 Extreme 99% chance of damaging wind over 30 yrs
- Air quality 3/10 Moderate 3 unhealthy d/yr today · 4 by 30 yrs out
Nearby sold comps map
Loading sold comps map…
Walkable amenities ~0.75 mi
Loading nearby amenities…
Taxation est. · year 1
- Rental income
- $22,828
- − Mortgage interest
- −$9,146
- − Property taxes
- −$1,123
- − Insurance
- −$816
- − Repairs & maintenance
- −$1,826
- − Management
- −$1,826
- − Depreciation
- −$4,750
- Taxable income
- $3,340
- Est. tax owed @ 24.0%
- −$802
- After-tax cash flow
- $5,018/yr
For passive investors: Depreciation is non-cash, so a rental often shows a tax loss while cash-flowing — sheltering income. Rental losses are passive: they offset passive income freely, and up to $25,000/yr can offset ordinary (W-2) income if you actively participate and your MAGI is under $100k (phasing out to $0 by $150k); unused losses carry forward. On sale, claimed depreciation is recaptured at up to 25%, and gains may owe capital-gains tax (a 1031 exchange can defer both). Figures are a year-1 estimate at your 24.0% rate — not tax advice; consult a CPA.
Schools (NCES district)
- District
- Marion
- NCES district ID
- 1201260
- Math proficiency
- 42% ▼ -7.00%
- Reading proficiency
- 43% ▼ -4.00%
- Median HH income
- $40,015
- Composite
- 35.61/100
- National rank
- #4890
- State rank
- #61 of 73 in FL
Livability — Belleview
- Score
- 69/100
- State rank
- #458
- US rank
- #8314
Category grades
Schools grade is shown separately in the Schools card above.
Census & demographics
- County
- Marion County · 315,796 people
- City population
- 19,167
- Metro
- Ocala, FL
- Population (ZIP)
- 33,318
- Household income
- $66,679
- Rent vs Own
- Severe rent burden
- 256.0
Population outlook (Marion County) Hauer SSP2
- Today (2025)
- 365,905 people
- By 2030
- 376,768 · +3.0%
- By 2040
- 396,555 · +8.4%
- By 2050
- 412,723 · +12.8%
- By 2075
- 446,090 · +21.9%
- By 2100
- 436,193 · +19.2%
Race, ethnicity, and origin ACS 2023
- Neighborhood character
- Predominantly White (77%)
- Race & ethnicity
- White 77% Hispanic / Latino 14% Two or more races 9% Black 4% Asian 2%
- Hispanic origin (detail)
- Mexican 3% Puerto Rican 6% Cuban 1%
- Common ancestry
- Lithuanian 3% Slovak 2% Romanian 2%
- Foreign-born
- 8% · Canada, Vietnam, Jamaica
- Languages at home
- 85% English-only · Spanish 11% Vietnamese 1% French/Haitian/Cajun 1%
Political lean MEDSL · Marion
- 2024 margin
- Solid R (+31.6) · D 33.8% · R 65.5%
- 2008→2024 swing
- -20.0pp toward R · 2008: -11.6pp · 2024: -31.6pp
- All cycles
- 2024: R+31.6 2020: R+25.9 2016: R+26.2 2012: R+16.2 2008: R+11.6
Not yet ingested
- Civics
- —
Market trends
- HPI YoY
- ▼ -107.67%
- Current HPI
- 200.0792
- Rent YoY
- —
- Metro
- Ocala, FL
- State GDP YoY
- ▲ 3.28%
- F500 in state
- 36
Industry mix (Fortune 500 HQ in FL)
| Industry | F500 HQs | Revenue |
|---|---|---|
| Industrial Technology | 2 | $29B |
|
||
| Insurance | 2 | $17B |
|
||
| Retail | 1 | $60B |
|
||
| Technology Distribution | 1 | $58B |
|
||
| Homebuilding | 1 | $35B |
|
||
| Technology Manufacturing | 1 | $35B |
|
||
Price history
+271.1% since first listed7 events — show timeline
- 2026-05-29 Listed $163,275 Stellar MLS as Distributed by MLS Grid
- 2025-05-08 Listing Removed — GAMLS
- 2025-05-01 Listed $5,000 GAMLS
- 2011-06-21 Sold (Public Records) $60,000 Public Records
- 2011-06-17 Sold (MLS) $60,000 Stellar MLS as Distributed by MLS Grid
- 2010-11-22 Listed $69,900 Stellar MLS as Distributed by MLS Grid
- 1992-02-01 Sold (Public Records) $44,000 Public Records
Property tax history
+3.7%/yrLatest (2025): $1,123 · +26.1% YoY. Source: county tax records.
Cash-flow waterfall
monthlySold comps — $/sqft
last 12 mo · ≤1 miLoading sold comps…