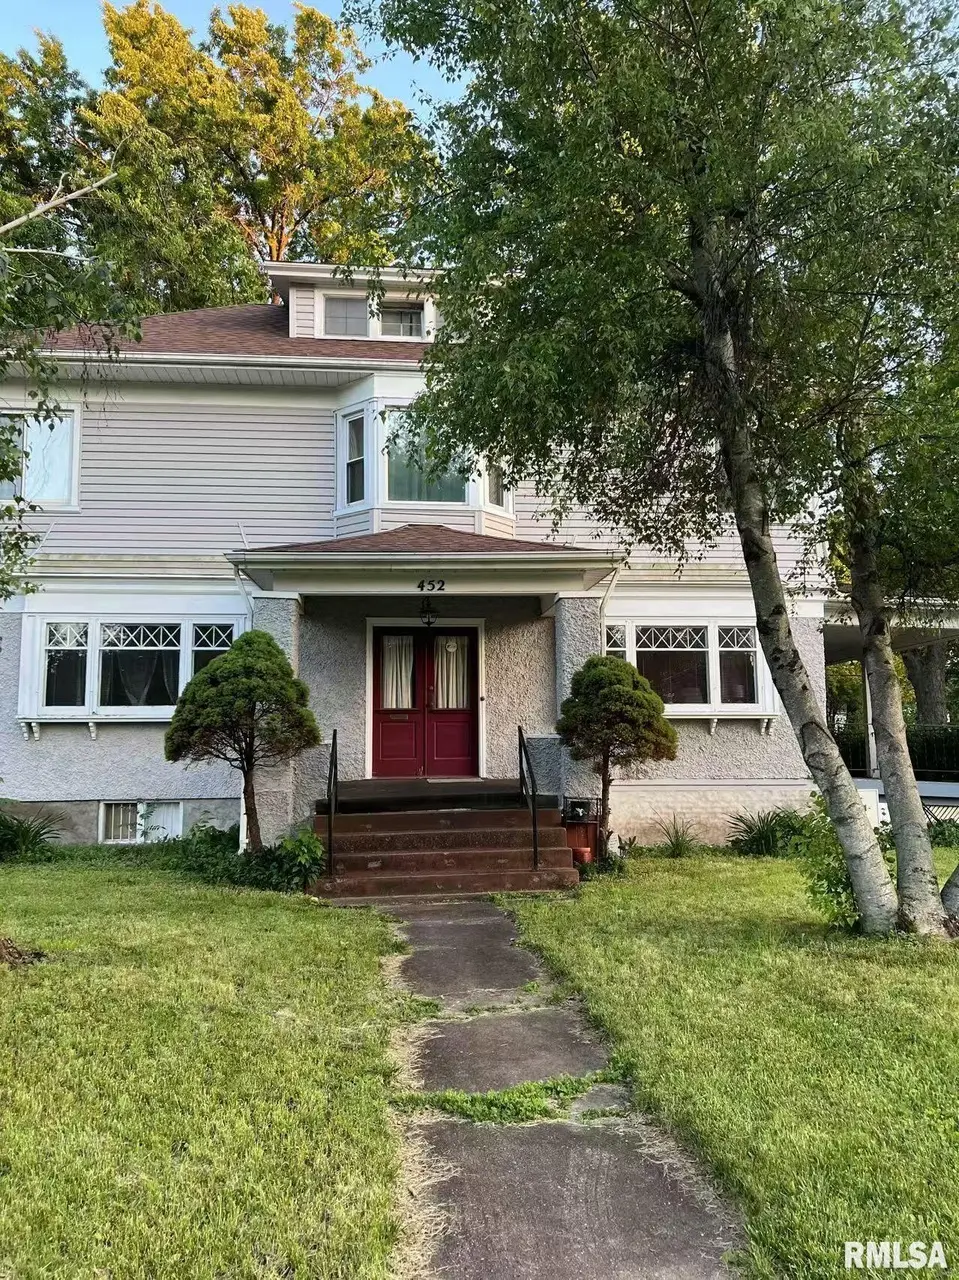
452 S Grand Avenue West · Springfield, IL
Flood risk 1/10 · Minimal
- FEMA flood zone
- X (unshaded)
- Chance of flooding over 30 yrs
- 0.0%
- Est. flood insurance / yr
- $473 – $860
Fire risk 1/10 · Minimal
- Est. fire insurance / yr
- $804 – $1,492
Heat risk 4/10 · Minor
- Hot days now (above 105°F)
- 7 days/yr
- Hot days in 30 yrs
- 20 days/yr
Wind risk 2/10 · Minimal
- Chance of severe wind over 30 yrs
- 1.0%
Air-quality risk 2/10 · Minimal
- Unhealthy air days now
- 1 days/yr
- Unhealthy air days in 30 yrs
- 2 days/yr
Risk factors via First Street. Map © Google.
Why this score? — see what drove the B- grade
The composite is a weighted blend of 9 inputs, each scored 0–100. Each bar is that input's sub-score; the figure is the points it added to the 100-point composite (weight × sub-score).
- Cash flow +25.1/30.0
- ARV discount +15.0/15.0
- DSCR +8.2/10.0
- 1% rule +6.0/10.0
- Rent growth +4.1/5.0
- Livability +4.0/5.0
- Condition / age +2.5/5.0
- Schools +1.7/10.0
- Appreciation +0.0/10.0
$179,900
🖨 Deal sheet 📄 Offer letter ✓ Due diligence
Listing remarks MLS
Check out this adorable home with all this space! This amazing 2 story home is in the heart of town, close to shopping, restaurants, and Washington Park. Hardwood floors, wood burning fireplace, some new windows, roof in 2018, zoned HVAC replaced in 2017. Sq Ft believed to be accurate but not warranted.
Key facts
- Roof in 2018
- Zoned hvac
- Hardwood floors
Tags
Neighborhood map
What this means for you Summary
Snapshot
- This is a 4-bed/1.5-bath single-family listed at $180k.
Deal economics
- At list price, monthly cash flow is $400 ($5k/yr) — positive.
- The deal already cash-flows at list — no discount required.
- Meets the 1% rule at list price ($2k rent vs $180k).
- Recommended offer: $158k (12.0% below list) — sets the bar for market timing.
- Cap rate 9.0% vs local median 4.9% in Springfield — top-decile yield for the area; either an underpriced asset or a hidden risk that comps aren't pricing in. Stress-test before assuming the spread holds.
Location & tenants
- Location reads 79/100 on livability (#122 in IL, #2,138 nationally) — a middle-class / working-renter tenant base. Strengths: amenities A+, commute A+, cost of living A+; Watch: schools D+, crime F.
- Springfield SD 186 (urban): math 17% / reading 22% proficiency, ranked #438 of 620 in IL (top 71%) — low school quality limits family demand, transient renter base, plan for 1-2y turnover; 64% free/reduced lunch — lower-income household profile, screen leases tightly.
- Market conditions: Rents rising fast (+6.3%/yr); 177 active listings in the ZIP; 2 comparable units currently listed for rent nearby; 225 units permitted in Sangamon County in 2024 (48 in 5+ unit buildings).
- This rent runs 34% of the median local income ($70k/yr) — at the standard rent-burdened threshold; future hikes will face affordability resistance.
Forward outlook
- Local home prices are declining (-3.0%/yr); year-one equity from $1k of loan paydown is wiped out by about $5k of value loss. Plan a longer hold.
- Sangamon County population projected to shrink 9% by 2050 — rents likely to lag national; underwrite the cash flow, not the appreciation.
- At projected returns (-3.0% appreciation + 6.3% rent growth), your $50k cash investment doubles in ~9 years — after that, you're playing with house money.
Negotiation context
- It's been on market 309 days — a 12% lower offer ($158k) is reasonable based on typical stale-listing flexibility.
- 3 sale attempts since 11y ago; this cycle's ask has dropped $28k (14%) from the opening price — seller is motivated, your offer sets the floor, not the list.
- Current owner paid $30k; list at $180k implies a 500% gain — meaningful room to come down on a strong offer.
Risks & watch-outs
- Watch-outs: built in 1917 — expect roof / HVAC / electrical / plumbing capex.
Questions for the listing agent
- It's been on market 309 days. Have you received any prior offers? Is the seller open to a 12% concession, seller financing, or rate buy-down credit?
- Built in 1917 — when were the roof, HVAC, electrical panel, plumbing, and water heater last replaced?
- Why hasn't it sold? Are there any deal-killer items the seller is aware of (foundation, flood, title, zoning, code violations)?
- Is there a deadline driving the sale (1031 exchange, divorce, estate, relocation)? That informs how much negotiation room exists.
- Schools are D-rated, which usually means shorter tenancies and higher turnover. Who's the typical renter profile here, and what's been the actual vacancy rate?
- Crime grade is F in this area — have there been break-ins, vandalism, or insurance claims at this property in the last 3 years? What carrier currently insures it and at what premium?
- What's the average days-on-market for RENTAL listings here right now (not sales)? A rising rental-DOM trend means longer vacancies and softer asking-rent achievability than the comps imply.
- What's the recent tenant-quality profile in this submarket — average credit score on applications, eviction rate, late-payment / NSF rate, and stable-employment percentage? A property-management company in the area should have these aggregated.
- How much new for-sale + rental construction is in the pipeline within 1–3 miles? Heavy new supply typically softens prices + rents 12–24 months out; constrained supply supports both.
Investment metrics
- 1% rule
- 1.10% ✓
- Cap rate
- 8.96%
- Cash-on-cash
- 9.52%
- DSCR
- 1.42
- GRM
- 7.6
CMA / ARV
- ARV (median comp)
- $216,080
- List price
- $179,900
- Delta
- -16.74%
- Verdict
- UNDERPRICED
- Comps
- 20 within 1.0 mi
Show comp detail 12 sales within ~0.75 mi
| Address | Dist | Beds/Ba | Sqft | Sold | Price | $/sf | Match |
|---|---|---|---|---|---|---|---|
| 909 S Walnut St | 0.40mi | 5/2.0 (+1) | 2,698 (-0%) | 4mo | $257,500 | $95 | 71 |
| 1532 S Lowell Ave | 0.20mi | 4/2.5 | 2,474 (-8%) | 10mo | $250,000 | $101 | 64 |
| 711 Fayette Ave | 0.44mi | 4/2.0 | 2,467 (-9%) | 8mo | $208,000 | $84 | 57 |
| 814 W Edwards St | 0.68mi | 4/2.0 | 2,766 (+2%) | 9mo | $150,000 | $54 | 55 |
| 710 S Walnut St | 0.57mi | 5/3.0 (+1) | 2,752 (+2%) | 6mo | $195,000 | $71 | 54 |
| 2120 S Whittier Ave | 0.66mi | 4/2.0 | 2,581 (-4%) | 8mo | $200,900 | $78 | 53 |
| 1516 S Lincoln Ave | 0.65mi | 3/2.5 (-1) | 2,771 (+3%) | 4mo | $166,000 | $60 | 53 |
| 1604 S Lowell Ave | 0.22mi | 3/1.5 (-1) | 2,327 (-14%) | 11mo | $210,000 | $90 | 53 |
| 1501 Dial Ct | 0.51mi | 3/2.5 (-1) | 2,596 (-4%) | 12mo | $370,000 | $143 | 51 |
| 1900 S Walnut St | 0.46mi | 3/1.0 (-1) | 2,376 (-12%) | 5mo | $179,900 | $76 | 47 |
| 1025 S Macarthur Blvd | 0.44mi | 4/4.0 | 2,322 (-14%) | 10mo | $215,000 | $93 | 38 |
| 819 S Douglas Ave | 0.70mi | 5/4.5 (+1) | 2,500 (-7%) | 11mo | $228,900 | $92 | 29 |
Match score weights: distance 35% · size 25% · config 20% · recency 20%. Top-matched comps best support the ARV.
Projected returns pro-forma
-3.0% appreciation · 6.32% rent growth · sell at horizon
- IRR
- 1.6%
- Equity multiple
- 1.06×
- Total profit
- $3,129
- Equity at exit
- $26,824
- IRR
- 14.1%
- Equity multiple
- 2.30×
- Total profit
- $65,500
- Equity at exit
- $15,554
Cash invested: $50,372 (down + closing). Projections, not guarantees.
Landlord ↔ Tenant lean methodology
- Overall (STATE)
- 43 Moderately Tenant-Leaning
- State Illinois
- 43 Moderately Tenant-Leaning · D+7
- County
- — inherits STATE
- City
- — inherits STATE
ZIP-level market 62704
- Home prices YoY
- -31.1%
- Rents YoY
- 6.3%
- Active inventory
- 177
- Price-to-rent
- 7.6×
Monthly cashflow live
- Estimated rent
- $1,983 medium interval (Pro) →
- Mortgage (P&I)
- −$943
- Tax from tax record
- −$148 /mo · $1,781/yr
- Insurance
- −$75
- HOA
- −$0
- Vacancy / Maint / Mgmt
- −$416
- Net cashflow
- $400
Break-even live
UW: 25.0% down · 7.5% · 30yr · 1.5% tax · 5.0% vac · 8.0% maint · 8.0% mgmt
Financing live
Cash to close
- Down payment
- $44,975
- Closing costs
- $5,397
- Reserves months
- —
- Total cash needed
- —
Loan-product check · same deal, 3 products live
Conventional
25% down · 7.5% · 30yr
- Down + closing
- —
- Monthly P&I
- —
- Monthly cashflow
- —
- DSCR
- —
- Eligible?
- —
Personal DTI + credit; lowest rate.
DSCR
20% down · 8.5% · 30yr
- Down + closing
- —
- Monthly P&I
- —
- Monthly cashflow
- —
- DSCR
- —
- Eligible?
- —
No personal income docs; deal must DSCR.
Hard money
10% down · 12.0% · 12mo
- Down + closing
- —
- Monthly P&I
- —
- Monthly cashflow
- —
- DSCR
- —
- Eligible?
- —
Short-term bridge; refi at stabilization.
Rent comps 2 comps
| Address | Beds | Baths | Sqft | Rent | $/sqft | DOM | Units | Dist |
|---|---|---|---|---|---|---|---|---|
| 1213 E Ash St Springfield, IL | 3.0 | 2.0 | 1861 | $2,030 | $1.09 | 20d | 1 | 1.27mi |
| 1329 South St Springfield, IL | 5.0 | 2.0 | 2462 | $2,450 | $1.00 | 20d | 1 | 1.46mi |
Listing history 23 events
-
2026-06-19days on market $179,900 Active 309 DOM
-
2026-06-18days on market $179,900 Active 308 DOM
-
2026-06-17days on market $179,900 Active 307 DOM
-
2026-06-16days on market $179,900 Active 306 DOM
-
2026-06-15days on market $179,900 Active 305 DOM
-
2026-06-14days on market $179,900 Active 303 DOM
-
2026-06-13days on market $179,900 Active 302 DOM
-
2026-06-10days on market $179,900 Active 300 DOM
-
2026-06-09days on market $179,900 Active 299 DOM
-
2026-06-08days on market $179,900 Active 298 DOM
-
2026-06-07days on market $179,900 Active 297 DOM
-
2026-06-05days on market $179,900 Active 294 DOM
-
2026-06-03days on market $179,900 Active 293 DOM
-
2026-06-02pricedays on market $179,900 Active 292 DOM
-
2026-06-01days on market $185,000 Active 291 DOM
-
2026-05-31days on market $185,000 Active 290 DOM
-
2026-05-30days on market $185,000 Active 289 DOM
-
2026-04-13status Active 304-char remark
Show marketing remark (304 chars)
Check out this adorable home with all this space! This amazing 2 story home is in the heart of town, close to shopping, restaurants, and Washington Park. Hardwood floors, wood burning fireplace, some new windows, roof in 2018, zoned HVAC replaced in 2017. Sq Ft believed to be accurate but not warranted.
-
2026-04-06status Pending 304-char remark
Show marketing remark (304 chars)
Check out this adorable home with all this space! This amazing 2 story home is in the heart of town, close to shopping, restaurants, and Washington Park. Hardwood floors, wood burning fireplace, some new windows, roof in 2018, zoned HVAC replaced in 2017. Sq Ft believed to be accurate but not warranted.
-
2026-04-01price $185,000 304-char remark
Show marketing remark (304 chars)
Check out this adorable home with all this space! This amazing 2 story home is in the heart of town, close to shopping, restaurants, and Washington Park. Hardwood floors, wood burning fireplace, some new windows, roof in 2018, zoned HVAC replaced in 2017. Sq Ft believed to be accurate but not warranted.
-
2025-08-07$208,000 Active 304-char remark
Show marketing remark (304 chars)
Check out this adorable home with all this space! This amazing 2 story home is in the heart of town, close to shopping, restaurants, and Washington Park. Hardwood floors, wood burning fireplace, some new windows, roof in 2018, zoned HVAC replaced in 2017. Sq Ft believed to be accurate but not warranted.
-
2015-08-14soldstatus $30,000 271-char remark
Show marketing remark (271 chars)
The home has been used as a Law Office for many years. This home needs a major face lift but has lots of potential. Could be great flip home. Hardwood floor under carpet in almost all rooms. 3rd floor not included in square footage. Taxes based on 137K fair market value.
-
2015-04-20$50,000 271-char remark
Show marketing remark (271 chars)
The home has been used as a Law Office for many years. This home needs a major face lift but has lots of potential. Could be great flip home. Hardwood floor under carpet in almost all rooms. 3rd floor not included in square footage. Taxes based on 137K fair market value.
ⓘ Source: listings_history table (triggers on properties + properties_extension) + one-shot
backfill from property_details.listing_events for pre-trigger history.
Tax reassessment forecast IL · Partial reset (capped growth)
- Current annual tax
- $1,781 · $148/mo
- Projected year-2 tax
- $2,932 · $244/mo
- Expected delta
- +$1,152/yr (+$96/mo · 64.7%)
ⓘ Screening estimate from a state-policy table — verify with the county assessor before closing.
Climate risk First Street
- Flood 1/10 Low FEMA zone X (unshaded) · 0% chance over 30 yrs
- Wildfire 1/10 Low
- Heat 4/10 Moderate 7 d/yr ≥105°F today · 20 d/yr by 30 yrs out
- Wind 2/10 Low 100% chance of damaging wind over 30 yrs
- Air quality 2/10 Low 1 unhealthy d/yr today · 2 by 30 yrs out
Nearby sold comps map
Loading sold comps map…
Walkable amenities ~0.75 mi
Loading nearby amenities…
Taxation est. · year 1
- Rental income
- $23,794
- − Mortgage interest
- −$10,077
- − Property taxes
- −$1,781
- − Insurance
- −$900
- − Repairs & maintenance
- −$1,903
- − Management
- −$1,903
- − Depreciation
- −$5,233
- Taxable income
- $1,996
- Est. tax owed @ 24.0%
- −$479
- After-tax cash flow
- $4,317/yr
For passive investors: Depreciation is non-cash, so a rental often shows a tax loss while cash-flowing — sheltering income. Rental losses are passive: they offset passive income freely, and up to $25,000/yr can offset ordinary (W-2) income if you actively participate and your MAGI is under $100k (phasing out to $0 by $150k); unused losses carry forward. On sale, claimed depreciation is recaptured at up to 25%, and gains may owe capital-gains tax (a 1031 exchange can defer both). Figures are a year-1 estimate at your 24.0% rate — not tax advice; consult a CPA.
Schools (NCES district)
- District
- Springfield SD 186
- NCES district ID
- 1737080
- Math proficiency
- 17% ▼ -7.00%
- Reading proficiency
- 22% ▼ -5.00%
- Median HH income
- $43,744
- Composite
- 16.89/100
- National rank
- #9142
- State rank
- #438 of 620 in IL
Livability — Springfield
- Score
- 79/100
- State rank
- #122
- US rank
- #2138
Category grades
Schools grade is shown separately in the Schools card above.
Census & demographics
- Census place
- Springfield, IL
- County
- Sangamon County · 115,414 people
- City population
- 59,955
- Metro
- Springfield, IL
- Population (ZIP)
- 40,046
- Household income
- $69,976
- Rent vs Own
- Severe rent burden
- 1529.0
Population outlook (Sangamon County) Hauer SSP2
- Today (2025)
- 198,317 people
- By 2030
- 196,127 · -1.1%
- By 2040
- 188,664 · -4.9%
- By 2050
- 179,624 · -9.4%
- By 2075
- 155,027 · -21.8%
- By 2100
- 122,588 · -38.2%
Race, ethnicity, and origin ACS 2023
- Neighborhood character
- Predominantly White (74%)
- Race & ethnicity
- White 74% Black 15% Two or more races 5% Hispanic / Latino 4% Asian 4%
- Common ancestry
- Lithuanian 2% Romanian 2% Slovak 2%
- Foreign-born
- 6% · Canada, China, Vietnam
- Languages at home
- 92% English-only · Spanish 2% Other Indo-European 1% Tagalog/Filipino 1%
Political lean MEDSL · Sangamon
- 2024 margin
- Toss-up / Even · D 46.6% · R 51.6% · Other 1.8%
- 2008→2024 swing
- -9.3pp toward R · 2008: 4.4pp · 2024: -5.0pp
- All cycles
- 2024: R+5.0 2020: R+4.4 2016: R+9.4 2012: R+8.7 2008: D+4.4
Not yet ingested
- Civics
- —
Market trends
- HPI YoY
- ▼ -70.79%
- Current HPI
- 156.7086
- Rent YoY
- ▲ 6.32%
- Metro
- Springfield, IL
- State GDP YoY
- ▲ 1.59%
- F500 in state
- 60
Industry mix (Fortune 500 HQ in IL)
| Industry | F500 HQs | Revenue |
|---|---|---|
| Insurance | 4 | $201B |
|
||
| Consumer Goods | 4 | $87B |
|
||
| Industrial Machinery | 3 | $64B |
|
||
| Healthcare | 2 | $55B |
|
||
| Retail / Pharmacy | 1 | $148B |
|
||
| Agriculture / Food | 1 | $86B |
|
||
Price history
+270.0% since first listed6 events — show timeline
- 2026-04-13 Relisted — RMLSA as Distributed by MLS Grid
- 2026-04-06 Pending — RMLSA as Distributed by MLS Grid
- 2026-04-01 Price Changed $185,000 RMLSA as Distributed by MLS Grid
- 2025-08-07 Listed $208,000 RMLSA as Distributed by MLS Grid
- 2015-08-14 Sold (MLS) $30,000 RMLSA as Distributed by MLS Grid
- 2015-04-20 Listed $50,000 RMLSA as Distributed by MLS Grid
Property tax history
-6.4%/yrLatest (2024): $1,781 · +6.9% YoY. Source: county tax records.
Cash-flow waterfall
monthlySold comps — $/sqft
last 12 mo · ≤1 miLoading sold comps…