10333 Farm Road 1102 Unit Parcel 3 · Cassville, MO
Flood risk No data
- FEMA flood zone
- —
- Chance of flooding over 30 yrs
- —
- Est. flood insurance / yr
- —
Fire risk No data
- Est. fire insurance / yr
- —
Heat risk No data
- Hot days now (above threshold)
- —
- Hot days in 30 yrs
- —
Wind risk No data
- Chance of severe wind over 30 yrs
- —
Air-quality risk No data
- Unhealthy air days now
- —
- Unhealthy air days in 30 yrs
- —
Risk factors via First Street. Map © Google.
Why this score? — see what drove the B- grade
The composite is a weighted blend of 9 inputs, each scored 0–100. Each bar is that input's sub-score; the figure is the points it added to the 100-point composite (weight × sub-score).
- Cash flow +30.0/30.0
- 1% rule +10.0/10.0
- DSCR +10.0/10.0
- ARV discount +7.5/15.0
- Schools +3.3/10.0
- Livability +3.3/5.0
- Rent growth +2.5/5.0
- Condition / age +2.2/5.0
- Appreciation +0.0/10.0
$69,900
🖨 Deal sheet 📄 Offer letter ✓ Due diligence
Listing remarks MLS
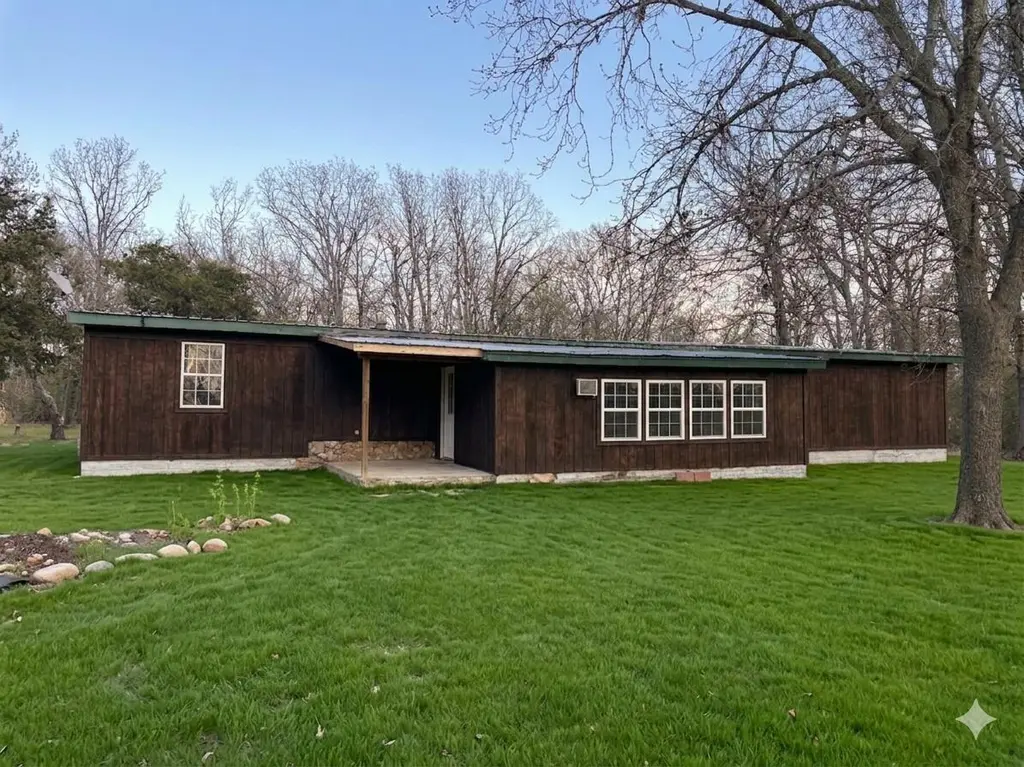
Hilltop North Estates. Inexpensive homes like this are hard to find! 3 bed 2 bath needs some TLC. Great mini farm opportunity, 4 barns, concrete floored shop. 3 sides fenced, shared well, no restrictions. Partially wooded, close to town, but outside of city limits. Cassville schools, power and fiber optic internet at the road.
Key facts
- 4 barns
- Shared well
- 3 sides fenced
Tags
Neighborhood map
What this means for you Summary
Snapshot
- This is a 3-bed/2.0-bath manufactured listed at $70k. Condition is rated fair.
Deal economics
- At list price, monthly cash flow is $539 ($6k/yr) — positive.
- The deal already cash-flows at list — no discount required.
- Meets the 1% rule at list price ($1k rent vs $70k).
- Recommended offer: $68k (3.0% below list) — sets the bar for market timing.
- Cap rate 15.5% vs local median 2.6% in Cassville — top-decile yield for the area; either an underpriced asset or a hidden risk that comps aren't pricing in. Stress-test before assuming the spread holds.
Location & tenants
- Location reads 66/100 on livability (#243 in MO) — a middle-class / working-renter tenant base. Strengths: cost of living A+, housing A-, crime B; Watch: schools C-, health & safety C-, amenities F.
- Cassville R-IV (town): math 33% / reading 47% proficiency, ranked #157 of 324 in MO (top 48%) — families likely to look elsewhere, expect single-tenant / working-renter base with shorter leases.
- Market conditions: 90 active listings in the ZIP; 57 units permitted in Barry County in 2024 (0 in 5+ unit buildings).
Forward outlook
- Local home prices are declining (-3.0%/yr); year-one equity from $483 of loan paydown is wiped out by about $2k of value loss. Plan a longer hold.
- Barry County population projected at -13% by 2050 — secular population decline; favor cash flow + early exit over multi-decade hold.
- At projected returns (-3.0% appreciation + 3.0% rent growth), your $20k cash investment doubles in ~4 years — after that, you're playing with house money.
Negotiation context
- It's been on market 42 days — a 3% lower offer ($68k) is reasonable based on typical stale-listing flexibility.
- 2 sale attempts with the ask held roughly flat each time — persistent listings suggest the price (not the market) is what's stuck; bring a comps-based counter.
Questions for the listing agent
- It's been on market 42 days. Have you received any prior offers? Is the seller open to a 3% concession, seller financing, or rate buy-down credit?
- Have any recent inspections been done? Can we get a copy of the seller's disclosures and any deferred-maintenance estimates?
- Is there a deadline driving the sale (1031 exchange, divorce, estate, relocation)? That informs how much negotiation room exists.
- What's the average days-on-market for RENTAL listings here right now (not sales)? A rising rental-DOM trend means longer vacancies and softer asking-rent achievability than the comps imply.
- What's the recent tenant-quality profile in this submarket — average credit score on applications, eviction rate, late-payment / NSF rate, and stable-employment percentage? A property-management company in the area should have these aggregated.
- How much new for-sale + rental construction is in the pipeline within 1–3 miles? Heavy new supply typically softens prices + rents 12–24 months out; constrained supply supports both.
Investment metrics
- 1% rule
- 1.85% ✓
- Cap rate
- 15.55%
- Cash-on-cash
- 33.06%
- DSCR
- 2.47
- GRM
- 4.5
CMA / ARV
No comps found within radius.
Projected returns pro-forma
-3.0% appreciation · 3.0% rent growth · sell at horizon
- IRR
- 28.3%
- Equity multiple
- 2.18×
- Total profit
- $23,031
- Equity at exit
- $10,422
- IRR
- 35.7%
- Equity multiple
- 4.29×
- Total profit
- $64,350
- Equity at exit
- $6,044
Cash invested: $19,572 (down + closing). Projections, not guarantees.
Landlord ↔ Tenant lean methodology
- Overall (STATE)
- 81 Strongly Landlord-Friendly
- State Missouri
- 81 Strongly Landlord-Friendly · R+10
- County
- — inherits STATE
- City
- — inherits STATE
ZIP-level market 65625
- Home prices YoY
- -6.8%
- Active inventory
- 90
- Price-to-rent
- 4.5×
Monthly cashflow live
- Estimated rent
- $1,294 medium interval (Pro) →
- Mortgage (P&I)
- −$367
- Tax est. 1.5%
- −$87 /mo · $1,048/yr
- Insurance
- −$29
- HOA
- −$0
- Vacancy / Maint / Mgmt
- −$272
- Net cashflow
- $539
Break-even live
UW: 25.0% down · 7.5% · 30yr · 1.5% tax · 5.0% vac · 8.0% maint · 8.0% mgmt
Financing live
Cash to close
- Down payment
- $17,475
- Closing costs
- $2,097
- Reserves months
- —
- Total cash needed
- —
Loan-product check · same deal, 3 products live
Conventional
25% down · 7.5% · 30yr
- Down + closing
- —
- Monthly P&I
- —
- Monthly cashflow
- —
- DSCR
- —
- Eligible?
- —
Personal DTI + credit; lowest rate.
DSCR
20% down · 8.5% · 30yr
- Down + closing
- —
- Monthly P&I
- —
- Monthly cashflow
- —
- DSCR
- —
- Eligible?
- —
No personal income docs; deal must DSCR.
Hard money
10% down · 12.0% · 12mo
- Down + closing
- —
- Monthly P&I
- —
- Monthly cashflow
- —
- DSCR
- —
- Eligible?
- —
Short-term bridge; refi at stabilization.
Listing history 3 events
-
2026-05-04status Active 328-char remark
Show marketing remark (328 chars)
Hilltop North Estates. Inexpensive homes like this are hard to find! 3 bed 2 bath needs some TLC. Great mini farm opportunity, 4 barns, concrete floored shop. 3 sides fenced, shared well, no restrictions. Partially wooded, close to town, but outside of city limits. Cassville schools, power and fiber optic internet at the road.
-
2026-04-25status Pending 328-char remark
Show marketing remark (328 chars)
Hilltop North Estates. Inexpensive homes like this are hard to find! 3 bed 2 bath needs some TLC. Great mini farm opportunity, 4 barns, concrete floored shop. 3 sides fenced, shared well, no restrictions. Partially wooded, close to town, but outside of city limits. Cassville schools, power and fiber optic internet at the road.
-
2026-03-31$69,900 Active 328-char remark
Show marketing remark (328 chars)
Hilltop North Estates. Inexpensive homes like this are hard to find! 3 bed 2 bath needs some TLC. Great mini farm opportunity, 4 barns, concrete floored shop. 3 sides fenced, shared well, no restrictions. Partially wooded, close to town, but outside of city limits. Cassville schools, power and fiber optic internet at the road.
ⓘ Source: listings_history table (triggers on properties + properties_extension) + one-shot
backfill from property_details.listing_events for pre-trigger history.
Nearby sold comps map
Loading sold comps map…
Walkable amenities ~0.75 mi
Loading nearby amenities…
Taxation est. · year 1
- Rental income
- $15,527
- − Mortgage interest
- −$3,915
- − Property taxes
- −$1,048
- − Insurance
- −$350
- − Repairs & maintenance
- −$1,242
- − Management
- −$1,242
- − Depreciation
- −$2,033
- Taxable income
- $5,696
- Est. tax owed @ 24.0%
- −$1,367
- After-tax cash flow
- $5,103/yr
For passive investors: Depreciation is non-cash, so a rental often shows a tax loss while cash-flowing — sheltering income. Rental losses are passive: they offset passive income freely, and up to $25,000/yr can offset ordinary (W-2) income if you actively participate and your MAGI is under $100k (phasing out to $0 by $150k); unused losses carry forward. On sale, claimed depreciation is recaptured at up to 25%, and gains may owe capital-gains tax (a 1031 exchange can defer both). Figures are a year-1 estimate at your 24.0% rate — not tax advice; consult a CPA.
Condition & rehab AI · 13 photos
This manufactured home requires significant repairs and updates to its exterior, interior, and landscaping to improve its condition and value.
Repairs flagged
- Major roof — Severe wear visible
- Major exterior siding — Severe weathering
- Major interior walls — Worn paint and surfaces
- Major bathrooms — Old fixtures and worn surfaces
- Major landscaping — Overgrown and unkempt
- Major fencing — Old and worn
- Major shed — Graffiti and poor condition
Value-add opportunities
- Resale Paint exterior — Fresh paint enhances curb appeal
- Resale Replace carpet — Fresh carpet improves interior aesthetics
- Resale Update bathrooms — Modern fixtures and surfaces attract buyers
- Both Trim landscaping — Neat landscaping enhances curb appeal and property value
- Both Repair fencing — Aesthetically pleasing fencing improves property value
- Both Renovate shed — A functional and attractive shed enhances property value
Renovation cost estimate screening
| Repair item | Severity | Est. cost |
|---|---|---|
| roof · Severe wear visible | Major | $15,000–50,000 |
| exterior siding · Severe weathering | Major | $15,000–50,000 |
| interior walls · Worn paint and surfaces | Major | $15,000–50,000 |
| bathrooms · Old fixtures and worn surfaces | Major | $15,000–50,000 |
| landscaping · Overgrown and unkempt | Major | $15,000–50,000 |
| fencing · Old and worn | Major | $15,000–50,000 |
| shed · Graffiti and poor condition | Major | $15,000–50,000 |
| Total estimated repair cost · 7 items | $105,000–350,000 |
Value-add ROI direction
- Resale Paint exterior — Fresh paint enhances curb appeal ↑
- Resale Replace carpet — Fresh carpet improves interior aesthetics ↑
- Resale Update bathrooms — Modern fixtures and surfaces attract buyers ↑
- Both Trim landscaping — Neat landscaping enhances curb appeal and property value ↑
- Both Repair fencing — Aesthetically pleasing fencing improves property value ↑
- Both Renovate shed — A functional and attractive shed enhances property value ↑
ⓘ Cost ranges are severity-bucket heuristics (US national rule-of-thumb). Get contractor quotes + a written scope before underwriting a rehab budget.
Schools (NCES district)
- District
- Cassville R-IV
- NCES district ID
- 2908170
- Math proficiency
- 33% ▬ 0.00%
- Reading proficiency
- 47% ▲ 1.00%
- Median HH income
- $38,738
- Composite
- 33.36/100
- National rank
- #5484
- State rank
- #157 of 324 in MO
Livability — Cassville
- Score
- 66/100
- State rank
- #243
- US rank
- #11916
Category grades
Schools grade is shown separately in the Schools card above.
Census & demographics
- Census place
- Cassville, MO
- Population (ZIP)
- 7,186
Population outlook (Barry County) Hauer SSP2
- Today (2025)
- 35,207 people
- By 2030
- 34,460 · -2.1%
- By 2040
- 32,643 · -7.3%
- By 2050
- 30,688 · -12.8%
- By 2075
- 26,898 · -23.6%
- By 2100
- 22,000 · -37.5%
Race, ethnicity, and origin ACS 2023
- Neighborhood character
- Predominantly White (90%)
- Race & ethnicity
- White 90% Hispanic / Latino 5% Two or more races 4%
- Common ancestry
- Italian 6% Lithuanian 3% Slovak 2%
- Foreign-born
- 2% · Canada, Philippines
- Languages at home
- 96% English-only · Spanish 3% German/W. Germanic 1%
Political lean MEDSL · Barry
- 2024 margin
- Solid R (+63.5) · D 17.8% · R 81.3%
- 2008→2024 swing
- -28.5pp toward R · 2008: -35.0pp · 2024: -63.5pp
- All cycles
- 2024: R+63.5 2020: R+60.8 2016: R+59.7 2012: R+44.7 2008: R+35.0
Not yet ingested
- Civics
- —
Market trends
- HPI YoY
- ▼ -16.59%
- Current HPI
- 225.8478
- Rent YoY
- —
- Metro
- —
- State GDP YoY
- ▲ 1.84%
- F500 in state
- 20
Industry mix (Fortune 500 HQ in MO)
| Industry | F500 HQs | Revenue |
|---|---|---|
| Healthcare | 1 | $163B |
|
||
| Insurance | 1 | $21B |
|
||
| Industrial Technology | 1 | $17B |
|
||
| Retail | 1 | $16B |
|
||
| Industrial Distribution | 1 | $10B |
|
||
| Utilities | 1 | $9B |
|
||
Price history
3 events — show timeline
- 2026-05-04 Relisted — SOMO
- 2026-04-25 Pending — SOMO
- 2026-03-31 Listed $69,900 SOMO
Cash-flow waterfall
monthlySold comps — $/sqft
last 12 mo · ≤1 miLoading sold comps…