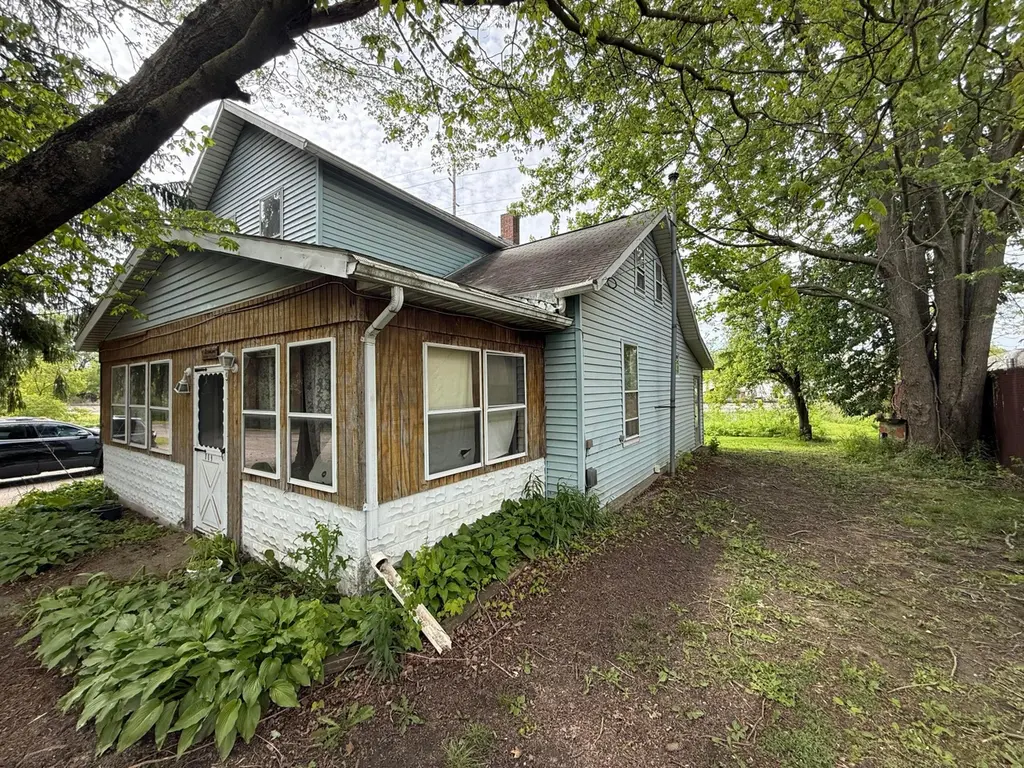
809 E Bucyrus St · Crestline, OH
Flood risk 6/10 · Moderate
- FEMA flood zone
- X (unshaded)
- Chance of flooding over 30 yrs
- 0.73%
- Est. flood insurance / yr
- $473 – $860
Fire risk 1/10 · Minimal
- Est. fire insurance / yr
- $713 – $1,323
Heat risk 3/10 · Minor
- Hot days now (above 98°F)
- 7 days/yr
- Hot days in 30 yrs
- 17 days/yr
Wind risk 2/10 · Minimal
- Chance of severe wind over 30 yrs
- —
Air-quality risk 2/10 · Minimal
- Unhealthy air days now
- 1 days/yr
- Unhealthy air days in 30 yrs
- 2 days/yr
Risk factors via First Street. Map © Google.
Why this score? — see what drove the B- grade
The composite is a weighted blend of 9 inputs, each scored 0–100. Each bar is that input's sub-score; the figure is the points it added to the 100-point composite (weight × sub-score).
- Cash flow +30.0/30.0
- 1% rule +10.0/10.0
- DSCR +10.0/10.0
- ARV discount +7.5/15.0
- Livability +3.7/5.0
- Schools +3.4/10.0
- Rent growth +2.5/5.0
- Condition / age +2.5/5.0
- Appreciation +0.0/10.0
$59,000
🖨 Deal sheet 📄 Offer letter ✓ Due diligence
Listing remarks
Located in the heart of Crestline, 809 E Bucyrus St offers a great opportunity for investors, flippers, or buyers looking to bring new life to a property with character. The home is in need of updates and improvements, giving the next owner the chance to renovate and customize it to their vision. Situated near the railroad tracks, the property has a unique small-town industrial charm and setting that stands out from the typical neighborhood feel. It is conveniently located near local shops, restaurants, and main routes through town. This property offers strong potential for someone ready to take on their next project!
Key facts
- Near restaurants
- Near local shops
- Near main routes
Tags
Property features AI
Finance
- Other: Standard special listing conditions
- Financial info: Annual taxes reported (2025): $1,265
Exterior
- Parking: Detached 2-car garage
- Utilities: Public water; Public sewer
- Home design: Single family residence; Two levels; No common walls
- Construction: Year built not specified; Foundation described as Other
- Exterior features: Lot of about 0.6 acre; Additional parcel reference 24-0021354.000
Interior
- Bathrooms: 1 full bathroom
- Interior features: Crawl space basement; Total living area reported as 1192
Neighborhood map
What this means for you Summary
Snapshot
- This is a 2-bed/1.0-bath single-family listed at $59k.
Deal economics
- At list price, monthly cash flow is $347 ($4k/yr) — positive.
- The deal already cash-flows at list — no discount required.
- Meets the 1% rule at list price ($995 rent vs $59k).
- Recommended offer: $58k (1.5% below list) — sets the bar for market timing.
Location & tenants
- Location reads 73/100 on livability (#328 in OH) — a middle-class / working-renter tenant base. Strengths: crime A+, cost of living A+, housing A+; Watch: employment D+, amenities F, commute F.
- Crestline Exempted Village (rural): math 34% / reading 48% proficiency, ranked #539 of 656 in OH (top 82%) — families likely to look elsewhere, expect single-tenant / working-renter base with shorter leases.
- Market conditions: 21 active listings in the ZIP; 2 comparable units currently listed for rent nearby; 8 units permitted in Crawford County in 2024 (0 in 5+ unit buildings).
Forward outlook
- Local home prices are declining (-3.0%/yr); year-one equity from $408 of loan paydown is wiped out by about $2k of value loss. Plan a longer hold.
- Crawford County population projected at -22% by 2050 — secular population decline; favor cash flow + early exit over multi-decade hold.
- At projected returns (-3.0% appreciation + 3.0% rent growth), your $17k cash investment doubles in ~5 years — after that, you're playing with house money.
Negotiation context
- It's been on market 26 days — a 2% lower offer ($58k) is reasonable based on typical stale-listing flexibility.
- Current owner paid $34k; list at $59k implies a 75% gain — meaningful room to come down on a strong offer.
Risks & watch-outs
- Climate carrying-cost: major flood risk — expect insurance premiums to compound above CPI over the hold.
Questions for the listing agent
- Is there a deadline driving the sale (1031 exchange, divorce, estate, relocation)? That informs how much negotiation room exists.
- What's the average days-on-market for RENTAL listings here right now (not sales)? A rising rental-DOM trend means longer vacancies and softer asking-rent achievability than the comps imply.
- What's the recent tenant-quality profile in this submarket — average credit score on applications, eviction rate, late-payment / NSF rate, and stable-employment percentage? A property-management company in the area should have these aggregated.
- How much new for-sale + rental construction is in the pipeline within 1–3 miles? Heavy new supply typically softens prices + rents 12–24 months out; constrained supply supports both.
Investment metrics
- 1% rule
- 1.69% ✓
- Cap rate
- 13.35%
- Cash-on-cash
- 25.19%
- DSCR
- 2.12
- GRM
- 4.9
CMA / ARV
- ARV (on-the-fly)
- $141,848
- Comps found
- 9
Show comp detail 9 sales within ~0.75 mi
| Address | Dist | Beds/Ba | Sqft | Sold | Price | $/sf | Match |
|---|---|---|---|---|---|---|---|
| 523 Cloverdale Ave | 0.55mi | 2/2.0 | 1,144 (-4%) | 3mo | $145,000 | $127 | 61 |
| 213 High St | 0.18mi | 3/1.0 (+1) | 1,100 (-8%) | 16mo | $45,000 | $41 | 61 |
| 221 E Arnold St | 0.60mi | 3/2.0 (+1) | 1,120 (-6%) | 1mo | $150,900 | $135 | 52 |
| 515 Scott St | 0.20mi | 3/1.0 (+1) | 1,320 (+11%) | 19mo | $94,000 | $71 | 52 |
| 619 Cloverdale Ave | 0.55mi | 2/2.0 | 1,348 (+13%) | 3mo | $145,000 | $108 | 46 |
| 5450 Lincoln Hwy | 0.75mi | 3/1.0 (+1) | 1,274 (+7%) | 7mo | $151,400 | $119 | 42 |
| 424 S Seltzer | 0.62mi | 3/2.0 (+1) | 1,248 (+5%) | 23mo | $161,000 | $129 | 35 |
| 207 N Henry St | 0.72mi | 3/2.0 (+1) | 1,344 (+13%) | 14mo | $170,600 | $127 | 24 |
| 115 Arnold St | 0.74mi | 3/2.0 (+1) | 1,032 (-13%) | 12mo | $116,500 | $113 | 24 |
Match score weights: distance 35% · size 25% · config 20% · recency 20%. Top-matched comps best support the ARV.
Projected returns pro-forma
-3.0% appreciation · 3.0% rent growth · sell at horizon
- IRR
- 18.7%
- Equity multiple
- 1.76×
- Total profit
- $12,561
- Equity at exit
- $8,797
- IRR
- 27.1%
- Equity multiple
- 3.39×
- Total profit
- $39,518
- Equity at exit
- $5,101
Cash invested: $16,520 (down + closing). Projections, not guarantees.
Landlord ↔ Tenant lean methodology
- Overall (STATE)
- 73 Landlord-Friendly
- State Ohio
- 73 Landlord-Friendly · R+6
- County
- — inherits STATE
- City
- — inherits STATE
ZIP-level market 44827
- Home prices YoY
- -23.6%
- Active inventory
- 21
- Price-to-rent
- 4.9×
Monthly cashflow live
- Estimated rent
- $995 medium interval (Pro) →
- Mortgage (P&I)
- −$309
- Tax from tax record
- −$105 /mo · $1,265/yr
- Insurance
- −$25
- HOA
- −$0
- Vacancy / Maint / Mgmt
- −$209
- Net cashflow
- $347
Break-even live
UW: 25.0% down · 7.5% · 30yr · 1.5% tax · 5.0% vac · 8.0% maint · 8.0% mgmt
Financing live
Cash to close
- Down payment
- $14,750
- Closing costs
- $1,770
- Reserves months
- —
- Total cash needed
- —
Loan-product check · same deal, 3 products live
Conventional
25% down · 7.5% · 30yr
- Down + closing
- —
- Monthly P&I
- —
- Monthly cashflow
- —
- DSCR
- —
- Eligible?
- —
Personal DTI + credit; lowest rate.
DSCR
20% down · 8.5% · 30yr
- Down + closing
- —
- Monthly P&I
- —
- Monthly cashflow
- —
- DSCR
- —
- Eligible?
- —
No personal income docs; deal must DSCR.
Hard money
10% down · 12.0% · 12mo
- Down + closing
- —
- Monthly P&I
- —
- Monthly cashflow
- —
- DSCR
- —
- Eligible?
- —
Short-term bridge; refi at stabilization.
Rent comps 2 comps
| Address | Beds | Baths | Sqft | Rent | $/sqft | DOM | Units | Dist |
|---|---|---|---|---|---|---|---|---|
| 57 Oak St Crestline, OH | 3.0 | 2.0 | 1056 | $1,000 | $0.95 | 43d | 1 | 1.29mi |
| 26 Locust St Crestline, OH | 3.0 | 2.0 | 1056 | $990 | $0.94 | 43d | 1 | 1.40mi |
Listing history 17 events
-
2026-06-17days on market $59,000 Active 26 DOM
-
2026-06-16days on market $59,000 Active 25 DOM
-
2026-06-15days on market $59,000 Active 24 DOM
-
2026-06-14days on market $59,000 Active 22 DOM
-
2026-06-12days on market $59,000 Active 21 DOM
-
2026-06-09days on market $59,000 Active 18 DOM
-
2026-06-08days on market $59,000 Active 17 DOM
-
2026-06-07days on market $59,000 Active 16 DOM
-
2026-06-05days on market $59,000 Active 13 DOM
-
2026-06-03pricedays on market $59,000 Active 12 DOM
-
2026-06-02days on market $67,000 Active 11 DOM
-
2026-06-01days on market $67,000 Active 10 DOM
-
2026-05-31days on market $67,000 Active 9 DOM
-
2026-05-30days on market $67,000 Active 8 DOM
-
2026-05-22$74,000 Active
-
2021-08-27soldstatus $33,800
-
1998-06-24soldstatus $26,000
ⓘ Source: listings_history table (triggers on properties + properties_extension) + one-shot
backfill from property_details.listing_events for pre-trigger history.
Tax reassessment forecast OH · Partial reset (capped growth)
- Current annual tax
- $1,265 · $105/mo
- Projected year-2 tax
- $1,265 · $105/mo
- Expected delta
- $0/yr ($0/mo · 0.0%)
ⓘ Screening estimate from a state-policy table — verify with the county assessor before closing.
Climate risk First Street
- Flood 6/10 Major FEMA zone X (unshaded) · 73% chance over 30 yrs
- Wildfire 1/10 Low
- Heat 3/10 Moderate 7 d/yr ≥98°F today · 17 d/yr by 30 yrs out
- Wind 2/10 Low
- Air quality 2/10 Low 1 unhealthy d/yr today · 2 by 30 yrs out
Nearby sold comps map
Loading sold comps map…
Walkable amenities ~0.75 mi
Loading nearby amenities…
Taxation est. · year 1
- Rental income
- $11,943
- − Mortgage interest
- −$3,305
- − Property taxes
- −$1,265
- − Insurance
- −$295
- − Repairs & maintenance
- −$955
- − Management
- −$955
- − Depreciation
- −$1,716
- Taxable income
- $3,450
- Est. tax owed @ 24.0%
- −$828
- After-tax cash flow
- $3,333/yr
For passive investors: Depreciation is non-cash, so a rental often shows a tax loss while cash-flowing — sheltering income. Rental losses are passive: they offset passive income freely, and up to $25,000/yr can offset ordinary (W-2) income if you actively participate and your MAGI is under $100k (phasing out to $0 by $150k); unused losses carry forward. On sale, claimed depreciation is recaptured at up to 25%, and gains may owe capital-gains tax (a 1031 exchange can defer both). Figures are a year-1 estimate at your 24.0% rate — not tax advice; consult a CPA.
Schools (NCES district)
- District
- Crestline Exempted Village
- NCES district ID
- 3910008
- Math proficiency
- 34% ▼ -12.00%
- Reading proficiency
- 48% ▼ -14.00%
- Median HH income
- $39,422
- Composite
- 34.26/100
- National rank
- #5251
- State rank
- #539 of 656 in OH
Livability — Crestline
- Score
- 73/100
- State rank
- #328
- US rank
- #5382
Category grades
Schools grade is shown separately in the Schools card above.
Census & demographics
- Census place
- Crestline, OH
- County
- Crawford · 26,873 people
- Population (ZIP)
- 7,009
- Household income
- $53,089
- Rent vs Own
- Severe rent burden
- 17.0
Population outlook (Crawford County) Hauer SSP2
- Today (2025)
- 39,421 people
- By 2030
- 37,656 · -4.5%
- By 2040
- 34,043 · -13.6%
- By 2050
- 30,617 · -22.3%
- By 2075
- 23,652 · -40.0%
- By 2100
- 17,786 · -54.9%
Race, ethnicity, and origin ACS 2023
- Neighborhood character
- Predominantly White (93%)
- Race & ethnicity
- White 93% Two or more races 4% Hispanic / Latino 2%
- Common ancestry
- Slovak 2% English 2% Romanian 2%
- Foreign-born
- 2% · China, Vietnam
Political lean MEDSL · Crawford
- 2024 margin
- Solid R (+53.0) · D 23.1% · R 76.1%
- 2008→2024 swing
- -33.9pp toward R · 2008: -19.0pp · 2024: -53.0pp
- All cycles
- 2024: R+53.0 2020: R+50.9 2016: R+46.8 2012: R+22.7 2008: R+19.0
Not yet ingested
- Civics
- —
Market trends
- HPI YoY
- ▼ -82.15%
- Current HPI
- 265.55
- Rent YoY
- —
- Metro
- —
- State GDP YoY
- ▲ 1.98%
- F500 in state
- 48
Industry mix (Fortune 500 HQ in OH)
| Industry | F500 HQs | Revenue |
|---|---|---|
| Insurance | 3 | $145B |
|
||
| Industrial Machinery | 3 | $49B |
|
||
| Financial Services | 3 | $24B |
|
||
| Consumer Goods | 2 | $93B |
|
||
| Aerospace / Defense | 2 | $47B |
|
||
| Utilities | 2 | $33B |
|
||
Price history
+184.6% since first listed3 events — show timeline
- 2026-05-22 Listed $74,000 CBRMLS
- 2021-08-27 Sold (Public Records) $33,800 Public Records
- 1998-06-24 Sold (Public Records) $26,000 Public Records
Property tax history
+0.9%/yrLatest (2025): $1,265 · -0.9% YoY. Source: county tax records.
Cash-flow waterfall
monthlySold comps — $/sqft
last 12 mo · ≤1 miLoading sold comps…