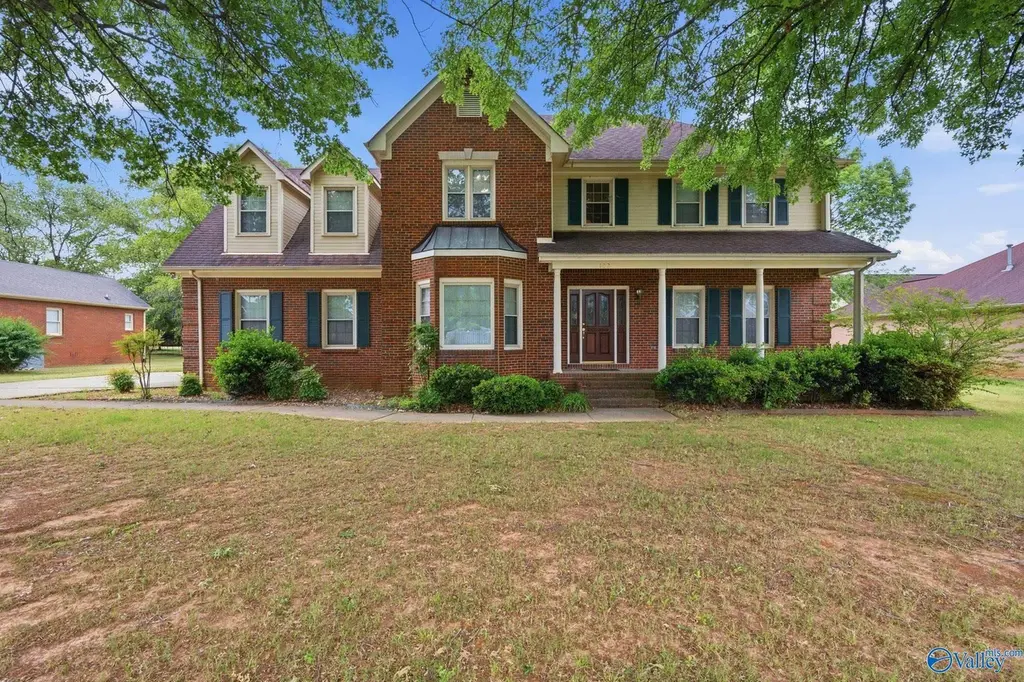
102 Redcliffe Dr NW · Huntsville, AL
Flood risk 1/10 · Minimal
- FEMA flood zone
- X (unshaded)
- Chance of flooding over 30 yrs
- 0.0%
- Est. flood insurance / yr
- $507 – $1,088
Fire risk 3/10 · Minor
- Est. fire insurance / yr
- $916 – $1,700
Heat risk 6/10 · Moderate
- Hot days now (above 106°F)
- 7 days/yr
- Hot days in 30 yrs
- 20 days/yr
Wind risk 4/10 · Minor
- Chance of severe wind over 30 yrs
- 19.0%
Air-quality risk 2/10 · Minimal
- Unhealthy air days now
- 0 days/yr
- Unhealthy air days in 30 yrs
- 1 days/yr
Risk factors via First Street. Map © Google.
Why this score? — see what drove the D grade
The composite is a weighted blend of 9 inputs, each scored 0–100. Each bar is that input's sub-score; the figure is the points it added to the 100-point composite (weight × sub-score).
- ARV discount +10.5/15.0
- Appreciation +10.0/10.0
- Cash flow +6.6/30.0
- Livability +4.1/5.0
- Schools +3.7/10.0
- Rent growth +3.1/5.0
- Condition / age +2.5/5.0
- DSCR +0.9/10.0
- 1% rule +0.5/10.0
$460,000
🖨 Deal sheet (PDF) 📄 Offer letter ✓ Due diligence
Listing remarks
Spacious full brick home in desirable Thomas Manor situated on a large lot with no HOA! Conveniently located near Providence, Research Park, MidCity, Redstone, shopping and dining. This home features a welcoming front porch, soaring 2-story foyer, hardwood flooring, crown molding and multiple living spaces including a family room with fireplace and formal living room. Formal dining room with bay window. The kitchen has abundant cabinet/counter space, and pantry. Master suite with trey ceiling, hardwoods, glamour bath with double vanities, soaking tub, separate shower and large walk-in closet. Upstairs offers 3 additional spacious bedrooms. Huge backyard with deck perfect for entertaining!
Key facts
- Hardwood flooring
- 2-story foyer
- Large lot
Tags
Property features AI
Finance
- HOA & community: No homeowners association; Subdivision: Thomas Manor; Community curbs
Exterior
- Parking: Two-car garage; Garage faces side; Concrete driveway
- Utilities: Public water; Septic tank
- Home design: Single-family residence; Two levels; Built in 1994; Residential property
- Construction: Brick construction; One fireplace
- Exterior features: Curb and gutters; Sidewalk; Deck; Front porch
Interior
- Kitchen: Range; Dishwasher
- Bedrooms: 10 total rooms (includes bedrooms and living spaces)
- Bathrooms: 2 full bathrooms; 1 half bathroom
- Heating & cooling: Central heating (2 units); Central cooling (2 units)
- Interior features: Crawl space basement; Fireplace (one)
Neighborhood map
What this means for you Summary
Snapshot
- This is a 4-bed/1.0-bath single-family listed at $460k.
Deal economics
- At list price, monthly cash flow is $-749 ($-9k/yr) — negative.
- To cash-flow at today's rent, offer at most $328k (28.8% below list).
- To meet the 1% rule (rent ≥ 1% of price), the offer needs to be $251k (45.4% below list).
- Recommended offer: $251k (45.4% below list) — sets the bar for 1% rule.
Location & tenants
- Location reads 82/100 on livability (#3 in AL, #1,082 nationally) — a professional / high-income tenant draw. Strengths: commute A+, cost of living A+, housing A+; Watch: crime F.
- Madison County (rural): math 27% / reading 56% proficiency, ranked #19 of 129 in AL (top 15%) — families likely to look elsewhere, expect single-tenant / working-renter base with shorter leases.
- Zoned schools: Monrovia Elementary School (math 37% / reading 69%, grade C, #100 of 627 statewide, top 16%, 495 students, 29% FRL); Monrovia Middle School (math 29% / reading 66%, grade C-, #32 of 257 statewide, top 12%, 1,003 students, 31% FRL); Sparkman High School (math 28% / reading 37%, grade F, #58 of 305 statewide, top 19%, 1,738 students, 37% FRL) — zoned schools at 32% FRL track the district average.
- Market conditions: Rents rising (+2.6%/yr); 216 active listings in the ZIP; 6 comparable units currently listed for rent nearby; rentals lingering (median 46d on market — plan ~5-8 weeks vacancy on turnover, expect pricing pressure); 50% of comp listings sitting > 30 days — soft ceiling on asking rent; solid renter incomes; 4,709 units permitted in Madison County in 2024 (1,186 in 5+ unit buildings).
- This rent runs 35% of the median local income ($87k/yr) — at the standard rent-burdened threshold; future hikes will face affordability resistance.
Forward outlook
- In year one you build about $49k of equity ($3k loan paydown + $46k appreciation (10.0% local appreciation)).
- Madison County population projected at +18% by 2050 — long-run rental-demand tailwind backs the buy-and-hold thesis.
- By year 2, paydown + projected appreciation supports a ~$79k cash-out refi (75% LTV) — recoverable capital for the next deal without selling this one.
Negotiation context
- It's been on market 39 days — a 3% lower offer ($446k) is reasonable based on typical stale-listing flexibility.
Risks & watch-outs
- Climate carrying-cost: extreme-heat days projected 7→20/yr by 2055 (HVAC capex compounding) — expect insurance premiums to compound above CPI over the hold.
Questions for the listing agent
- What do current leases actually rent for vs. the listed asking? Can we see a recent rent roll and the last 12 months of T-12 income?
- It's been on market 39 days. Have you received any prior offers? Is the seller open to a 45% concession, seller financing, or rate buy-down credit?
- Is there a deadline driving the sale (1031 exchange, divorce, estate, relocation)? That informs how much negotiation room exists.
- Crime grade is F in this area — have there been break-ins, vandalism, or insurance claims at this property in the last 3 years? What carrier currently insures it and at what premium?
- The area grade is low — what's the realistic commute time and amenity access for the typical tenant pool here? Any planned neighborhood developments (good or bad) we should know about?
- What's the average days-on-market for RENTAL listings here right now (not sales)? A rising rental-DOM trend means longer vacancies and softer asking-rent achievability than the comps imply.
- What's the recent tenant-quality profile in this submarket — average credit score on applications, eviction rate, late-payment / NSF rate, and stable-employment percentage? A property-management company in the area should have these aggregated.
- How much new for-sale + rental construction is in the pipeline within 1–3 miles? Heavy new supply typically softens prices + rents 12–24 months out; constrained supply supports both.
Investment metrics
- 1% rule
- 0.55% ✗
- Cap rate
- 4.34%
- Cash-on-cash
- -6.98%
- DSCR
- 0.69
- GRM
- 15.3
CMA / ARV
- ARV (median comp)
- $492,426
- List price
- $460,000
- Delta
- -6.59%
- Verdict
- FAIR
- Comps
- 20 within 1.0 mi
Show comp detail 12 sales within ~0.75 mi
| Address | Dist | Beds/Ba | Sqft | Sold | Price | $/sf | Match |
|---|---|---|---|---|---|---|---|
| 222 Lee Bowden Dr | 0.11mi | 4/3.0 | 2,910 (-0%) | 5mo | $516,000 | $177 | 82 |
| 103 Nobleton Ln NW | 0.17mi | 3/2.5 (-1) | 3,004 (+3%) | 9mo | $435,000 | $145 | 69 |
| 120 Preswick Pl | 0.23mi | 4/3.5 | 2,817 (-4%) | 6mo | $520,000 | $185 | 68 |
| 154 Redcliffe Dr | 0.53mi | 4/2.5 | 2,944 (+1%) | 2mo | $462,500 | $157 | 66 |
| 227 Lee Bowden Dr | 0.18mi | 4/2.0 | 2,623 (-10%) | 10mo | $510,000 | $194 | 62 |
| 112 Vaughnwood Trce | 0.47mi | 4/2.5 | 2,900 (-1%) | 12mo | $487,500 | $168 | 61 |
| 128 Holbrook Dr | 0.50mi | 4/3.5 | 3,118 (+7%) | 0mo | $540,000 | $173 | 55 |
| 108 Holbrook Dr | 0.57mi | 4/3.5 | 3,066 (+5%) | 7mo | $470,000 | $153 | 49 |
| 117 Kretzer Ct | 0.72mi | 4/2.5 | 3,141 (+8%) | 2mo | $405,000 | $129 | 46 |
| 138 Holbrook Dr | 0.49mi | 4/3.5 | 3,220 (+10%) | 6mo | $545,000 | $169 | 45 |
| 110 Holbrook Dr | 0.56mi | 4/2.5 | 3,214 (+10%) | 10mo | $535,000 | $166 | 43 |
| 107 Orton Spring Ct | 0.48mi | 4/3.0 | 3,286 (+13%) | 11mo | $595,000 | $181 | 40 |
Match score weights: distance 35% · size 25% · config 20% · recency 20%. Top-matched comps best support the ARV.
Projected returns pro-forma
10.0% appreciation · 2.57% rent growth · sell at horizon
- IRR
- 19.2%
- Equity multiple
- 2.56×
- Total profit
- $201,517
- Equity at exit
- $414,404
- IRR
- 17.7%
- Equity multiple
- 5.88×
- Total profit
- $628,312
- Equity at exit
- $893,679
Cash invested: $128,800 (down + closing). Projections, not guarantees.
Landlord ↔ Tenant lean methodology
- Overall (STATE)
- 90 Strongly Landlord-Friendly
- State Alabama
- 90 Strongly Landlord-Friendly · R+15
- County
- — inherits STATE
- City
- — inherits STATE
ZIP-level market 35806
- Home prices YoY
- 20.0%
- Rents YoY
- 2.6%
- Active inventory
- 216
- Price-to-rent
- 15.3×
Monthly cashflow live
- Estimated rent
- $2,510 high interval (Pro) →
- Mortgage (P&I)
- −$2,412
- Tax from tax record
- −$128 /mo · $1,536/yr
- Insurance
- −$192
- HOA
- −$0
- Vacancy / Maint / Mgmt
- −$527
- Net cashflow
- $-749
Break-even live
Sensitivity live
| Price | -10% $-488 | -5% $-619 | +0% $-749 | +5% $-879 | +10% $-1,009 |
|---|---|---|---|---|---|
| Rent | -10% $-947 | -5% $-848 | +0% $-749 | +5% $-650 | +10% $-551 |
| Rate | -1.0pp $-517 | -0.5pp $-632 | base $-749 | +0.5pp $-868 | +1.0pp $-989 |
UW: 25.0% down · 7.5% · 30yr · 1.5% tax · 5.0% vac · 8.0% maint · 8.0% mgmt
Financing live
Cash to close
- Down payment
- $115,000
- Closing costs
- $13,800
- Reserves months
- —
- Total cash needed
- —
Loan-product check · same deal, 3 products live
Conventional
25% down · 7.5% · 30yr
- Down + closing
- —
- Monthly P&I
- —
- Monthly cashflow
- —
- DSCR
- —
- Eligible?
- —
Personal DTI + credit; lowest rate.
DSCR
20% down · 8.5% · 30yr
- Down + closing
- —
- Monthly P&I
- —
- Monthly cashflow
- —
- DSCR
- —
- Eligible?
- —
No personal income docs; deal must DSCR.
Hard money
10% down · 12.0% · 12mo
- Down + closing
- —
- Monthly P&I
- —
- Monthly cashflow
- —
- DSCR
- —
- Eligible?
- —
Short-term bridge; refi at stabilization.
Rent comps 6 comps
| Address | Beds | Baths | Sqft | Rent | $/sqft | DOM | Units | Dist |
|---|---|---|---|---|---|---|---|---|
| 171 Kingswood Dr Huntsville, AL | 4.0 | 2.5 | 2850 | $2,500 | $0.88 | 15d | 1 | 0.68mi |
| 102 Fred Atkinson Rd Huntsville, AL | 4.0 | 3.0 | 3022 | $2,700 | $0.89 | 45d | 1 | 0.76mi |
| 67 Town Center Dr NW Huntsville, AL | 3.0 | 2.5 | 2970 | $2,495 | $0.84 | 45d | 1 | 1.17mi |
| 351 Lofton Rd NW Huntsville, AL | 4.0 | 2.5 | 2186 | $2,315 | $1.06 | 15d | 1 | 1.18mi |
| 445 Providence Main St NW Unit 409a Huntsville, AL | 3.0 | 2.5 | 2797 | $3,995 | $1.43 | 45d | 1 | 1.25mi |
| 1589 Old Monrovia Rd NW Huntsville, AL | 2.0–3.0 | 2.5–3.5 | 1657 | $2,448 | $1.48 | 15d | 17 | 1.46mi |
Listing history 15 events
-
2026-06-22days on market $460,000 Active 39 DOM
-
2026-06-18days on market $460,000 Active 36 DOM
-
2026-06-17days on market $460,000 Active 35 DOM
-
2026-06-16days on market $460,000 Active 34 DOM
-
2026-06-15days on market $460,000 Active 33 DOM
-
2026-06-14days on market $460,000 Active 31 DOM
-
2026-06-10days on market $460,000 Active 28 DOM
-
2026-06-09days on market $460,000 Active 27 DOM
-
2026-06-08days on market $460,000 Active 26 DOM
-
2026-06-07days on market $460,000 Active 25 DOM
-
2026-06-02days on market $460,000 Active 20 DOM
-
2026-06-01days on market $460,000 Active 19 DOM
-
2026-05-31days on market $460,000 Active 18 DOM
-
2026-05-30days on market $460,000 Active 17 DOM
-
2026-05-13$460,000 Active 697-char remark
ⓘ Source: listings_history table (triggers on properties + properties_extension) + one-shot
backfill from property_details.listing_events for pre-trigger history.
Tax reassessment forecast AL · Resets to sale price
- Current annual tax
- $1,536 · $128/mo
- Projected year-2 tax
- $1,886 · $157/mo
- Expected delta
- +$350/yr (+$29/mo · 22.8%)
ⓘ Screening estimate from a state-policy table — verify with the county assessor before closing.
Climate risk First Street
- Flood 1/10 Low FEMA zone X (unshaded) · 0% chance over 30 yrs
- Wildfire 3/10 Moderate
- Heat 6/10 Major 7 d/yr ≥106°F today · 20 d/yr by 30 yrs out
- Wind 4/10 Moderate 19% chance of damaging wind over 30 yrs
- Air quality 2/10 Low 0 unhealthy d/yr today · 1 by 30 yrs out
Nearby sold comps map
Loading sold comps map…
Walkable amenities ~0.75 mi
Loading nearby amenities…
Taxation est. · year 1
- Rental income
- $30,124
- − Mortgage interest
- −$25,767
- − Property taxes
- −$1,536
- − Insurance
- −$2,300
- − Repairs & maintenance
- −$2,410
- − Management
- −$2,410
- − Depreciation
- −$13,382
- Taxable loss
- −$17,681
- Est. tax savings @ 24.0%
- +$4,243
- After-tax cash flow
- $-4,742/yr
For passive investors: Depreciation is non-cash, so a rental often shows a tax loss while cash-flowing — sheltering income. Rental losses are passive: they offset passive income freely, and up to $25,000/yr can offset ordinary (W-2) income if you actively participate and your MAGI is under $100k (phasing out to $0 by $150k); unused losses carry forward. On sale, claimed depreciation is recaptured at up to 25%, and gains may owe capital-gains tax (a 1031 exchange can defer both). Figures are a year-1 estimate at your 24.0% rate — not tax advice; consult a CPA.
Schools (NCES district)
- District
- Madison County
- NCES district ID
- 0102220
- Math proficiency
- 27% ▼ -32.00%
- Reading proficiency
- 56% ▼ -1.00%
- Median HH income
- $66,058
- Composite
- 37.15/100
- National rank
- #4483
- State rank
- #19 of 129 in AL
Livability — Huntsville
- Score
- 82/100
- State rank
- #3
- US rank
- #1082
Category grades
Schools grade is shown separately in the Schools card above.
Census & demographics
- County
- Madison County · 380,832 people
- City population
- 220,435
- Metro
- Huntsville, AL
- Population (ZIP)
- 29,161
- Household income
- $86,768
- Rent vs Own
- Severe rent burden
- 1249.0
Population outlook (Madison County) Hauer SSP2
- Today (2025)
- 392,086 people
- By 2030
- 409,788 · +4.5%
- By 2040
- 440,557 · +12.4%
- By 2050
- 460,990 · +17.6%
- By 2075
- 502,872 · +28.3%
- By 2100
- 513,623 · +31.0%
Race, ethnicity, and origin ACS 2023
- Neighborhood character
- Diverse neighborhood (Simpson 0.57)
- Race & ethnicity
- White 58% Black 30% Hispanic / Latino 5% Two or more races 5% Asian 4%
- Hispanic origin (detail)
- Mexican 2% Puerto Rican 2%
- Common ancestry
- Slovak 2% Italian 2% Serbian 2%
- Foreign-born
- 7% · Canada, Vietnam, China
- Languages at home
- 93% English-only · Spanish 2% Other Indo-European 1% Other Asian/Pacific 1%
Political lean MEDSL · Madison
- 2024 margin
- Lean R (+9.0) · D 44.7% · R 53.7% · Other 1.6%
- 2008→2024 swing
- +6.0pp toward D · 2008: -14.9pp · 2024: -9.0pp
- All cycles
- 2024: R+9.0 2020: R+8.0 2016: R+16.8 2012: R+18.7 2008: R+14.9
Not yet ingested
- Civics
- —
Market trends
- HPI YoY
- ▲ 71.67%
- Current HPI
- 430.5866
- Rent YoY
- ▲ 2.57%
- Metro
- Huntsville, AL
- State GDP YoY
- ▲ 2.94%
- F500 in state
- 4
Industry mix (Fortune 500 HQ in AL)
| Industry | F500 HQs | Revenue |
|---|---|---|
| Financial Services | 1 | $8B |
|
||
| Healthcare | 1 | $5B |
|
||
Price history
1 event — show timeline
- 2026-05-13 Listed $460,000 VMLS
Property tax history
+5.9%/yrLatest (2024): $1,536 · +3.2% YoY. Source: county tax records.
Cash-flow waterfall
monthlySold comps — $/sqft
last 12 mo · ≤1 miLoading sold comps…