571 NE 172nd St · North Miami Beach, FL
Flood risk 4/10 · Minor
- FEMA flood zone
- X (unshaded)
- Chance of flooding over 30 yrs
- 0.13%
- Est. flood insurance / yr
- $507 – $1,088
Fire risk 1/10 · Minimal
- Est. fire insurance / yr
- $947 – $1,759
Heat risk 10/10 · Severe
- Hot days now (above 104°F)
- 7 days/yr
- Hot days in 30 yrs
- 27 days/yr
Wind risk 10/10 · Severe
- Chance of severe wind over 30 yrs
- 99.0%
Air-quality risk 2/10 · Minimal
- Unhealthy air days now
- 1 days/yr
- Unhealthy air days in 30 yrs
- 2 days/yr
Risk factors via First Street. Map © Google.
Why this score? — see what drove the D grade
The composite is a weighted blend of 9 inputs, each scored 0–100. Each bar is that input's sub-score; the figure is the points it added to the 100-point composite (weight × sub-score).
- Cash flow +13.8/30.0
- ARV discount +5.9/15.0
- DSCR +4.2/10.0
- Schools +4.2/10.0
- Livability +4.1/5.0
- 1% rule +3.9/10.0
- Condition / age +2.5/5.0
- Rent growth +2.1/5.0
- Appreciation +0.0/10.0
$570,000
🖨 Deal sheet (PDF) 📄 Offer letter ✓ Due diligence
Listing remarks MLS
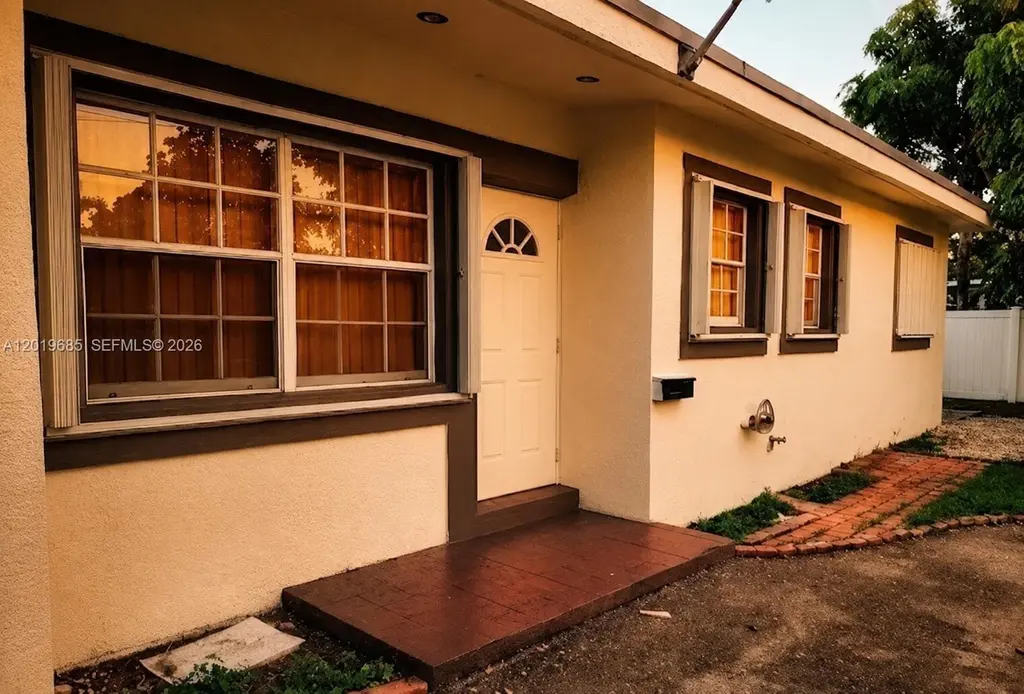
AMAZING SINGLE FAMILY HOME 3 BEDROOMS/2 BATHS WITH TILE FLOORING THROUGHOUT AND RENOVATED KITCHEN. SPACIOUS BACKYARD WITH ROOM FOR POOL.
Key facts
- Central ac system
- Large backyard
- Covered patio
Tags
Property features AI
Finance
- HOA & community: Sidewalks
Exterior
- Parking: Driveway
- Utilities: Public water; Public sewer
- Home design: Block construction; Faces east; Resale property
- Construction: Block construction
- Exterior features: Fence; Patio; Patio/porch
Interior
- Kitchen: Dishwasher; Refrigerator
- Bedrooms: One room listed (12 x 14)
- Flooring: Tile
- Bathrooms: 2 full bathrooms
- Heating & cooling: Central heating; Central air conditioning
- Interior features: Bedroom on main level; Closet cabinetry; First-floor entry; Pantry
- Laundry & utility: Washer; Dryer
Neighborhood map
What this means for you Summary
Snapshot
- This is a 3-bed/1.0-bath single-family listed at $570k.
Deal economics
- At list price, monthly cash flow is $50 ($599/yr) — positive.
- The deal already cash-flows at list — no discount required.
- To meet the 1% rule (rent ≥ 1% of price), the offer needs to be $509k (10.7% below list).
- Recommended offer: $509k (10.7% below list) — sets the bar for 1% rule.
- Cap rate 6.4% vs local median 5.2% in North Miami Beach — meaningfully above typical; check what's discounted (condition, days-on-market, listing class) to confirm the premium yield is real.
Location & tenants
- Location reads 82/100 on livability (#71 in FL, #1,177 nationally) — a professional / high-income tenant draw. Strengths: commute A+, housing A+, health & safety A+; Watch: employment D+, crime F.
- Miami-Dade (suburban): math 45% / reading 54% proficiency, ranked #40 of 73 in FL (top 55%) — families likely to look elsewhere, expect single-tenant / working-renter base with shorter leases; 64% free/reduced lunch — lower-income household profile, screen leases tightly.
- Zoned schools: Gertrude K. Edelman/Sabal Palm (math 28% / reading 38%, grade F, #1,773 of 2,144 statewide, top 83%, 504 students, 76% FRL); Andover Middle School (math 16% / reading 33%, grade F, #522 of 571 statewide, top 93%, 452 students, 71% FRL); North Miami Beach Senior High (math 13% / reading 24%, grade F, #568 of 667 statewide, top 85%, 1,149 students, 66% FRL).
- Zoned-school proficiency averages 25% at this address vs 50% district-wide (-24 pts) — the specific schools serving this property underperform the Miami-Dade average; the district grade overstates school quality for this exact location.
- Market conditions: Rents soft (-1.6%/yr); 287 active listings in the ZIP; 10,051 units permitted in Miami-Dade County in 2024 (7,758 in 5+ unit buildings).
Forward outlook
- Local home prices are declining (-3.0%/yr); year-one equity from $4k of loan paydown is wiped out by about $17k of value loss. Plan a longer hold.
- Miami-Dade County population projected at +28% by 2050 — long-run rental-demand tailwind backs the buy-and-hold thesis.
Negotiation context
- It's been on market 37 days — a 3% lower offer ($553k) is reasonable based on typical stale-listing flexibility.
- 2 sale attempts since 17y ago with the ask held roughly flat each time — persistent listings suggest the price (not the market) is what's stuck; bring a comps-based counter.
- Current owner paid $156k; list at $570k implies a 265% gain — meaningful room to come down on a strong offer.
Risks & watch-outs
- Watch-outs: built in 1955 — expect roof / HVAC / electrical / plumbing capex.
- Climate carrying-cost: severe wind risk, 99% chance of damaging wind over 30y; extreme-heat days projected 7→27/yr by 2055 (HVAC capex compounding) — expect insurance premiums to compound above CPI over the hold.
Questions for the listing agent
- It's been on market 37 days. Have you received any prior offers? Is the seller open to a 11% concession, seller financing, or rate buy-down credit?
- Built in 1955 — when were the roof, HVAC, electrical panel, plumbing, and water heater last replaced?
- Is there a deadline driving the sale (1031 exchange, divorce, estate, relocation)? That informs how much negotiation room exists.
- Crime grade is F in this area — have there been break-ins, vandalism, or insurance claims at this property in the last 3 years? What carrier currently insures it and at what premium?
- The area grade is low — what's the realistic commute time and amenity access for the typical tenant pool here? Any planned neighborhood developments (good or bad) we should know about?
- What's the average days-on-market for RENTAL listings here right now (not sales)? A rising rental-DOM trend means longer vacancies and softer asking-rent achievability than the comps imply.
- What's the recent tenant-quality profile in this submarket — average credit score on applications, eviction rate, late-payment / NSF rate, and stable-employment percentage? A property-management company in the area should have these aggregated.
- How much new for-sale + rental construction is in the pipeline within 1–3 miles? Heavy new supply typically softens prices + rents 12–24 months out; constrained supply supports both.
Investment metrics
- 1% rule
- 0.89% ✗
- Cap rate
- 6.40%
- Cash-on-cash
- 0.38%
- DSCR
- 1.02
- GRM
- 9.3
CMA / ARV
- ARV (on-the-fly)
- $550,342
- Comps found
- 9
Show comp detail 9 sales within ~0.75 mi
| Address | Dist | Beds/Ba | Sqft | Sold | Price | $/sf | Match |
|---|---|---|---|---|---|---|---|
| 17001 NE 8th Pl | 0.41mi | 3/2.0 | 1,562 (-2%) | 14mo | $802,000 | $513 | 63 |
| 850 NE 173rd Ter | 0.38mi | 3/2.0 | 1,756 (+11%) | 1mo | $766,000 | $436 | 60 |
| 631 NE 171st St | 0.18mi | 4/2.0 (+1) | 1,468 (-7%) | 13mo | $490 | — | 60 |
| 535 NE 162nd St | 0.65mi | 3/2.0 | 1,601 (+1%) | 7mo | $505,000 | $315 | 59 |
| 17800 NE 6th Ct | 0.35mi | 3/2.0 | 1,526 (-4%) | 20mo | $665,000 | $436 | 57 |
| 711 NE 170th St | 0.23mi | 4/3.0 (+1) | 1,702 (+7%) | 9mo | $504,000 | $296 | 57 |
| 285 NE 165th St | 0.57mi | 3/2.0 | 1,380 (-13%) | 1mo | $405,000 | $293 | 47 |
| 280 NE 172nd St | 0.35mi | 3/3.0 | 1,356 (-14%) | 7mo | $470,000 | $347 | 45 |
| 1020 NE 165th Ter | 0.73mi | 3/2.0 | 1,687 (+6%) | 13mo | $475,000 | $282 | 40 |
Match score weights: distance 35% · size 25% · config 20% · recency 20%. Top-matched comps best support the ARV.
Projected returns pro-forma
-3.0% appreciation · 0.0% rent growth · sell at horizon
- IRR
- -19.1%
- Equity multiple
- 0.35×
- Total profit
- $-104,005
- Equity at exit
- $84,989
- IRR
- -19.7%
- Equity multiple
- 0.10×
- Total profit
- $-143,728
- Equity at exit
- $49,283
Cash invested: $159,600 (down + closing). Projections, not guarantees.
Landlord ↔ Tenant lean methodology
- Overall (STATE)
- 87 Strongly Landlord-Friendly
- State Florida
- 87 Strongly Landlord-Friendly · R+3
- County
- — inherits STATE
- City
- — inherits STATE
ZIP-level market 33162
- Rents YoY
- -1.6%
- Active inventory
- 287
- Price-to-rent
- 9.3×
Monthly cashflow live
- Estimated rent
- $5,090 medium interval (Pro) →
- Mortgage (P&I)
- −$2,989
- Tax from tax record
- −$745 /mo · $8,936/yr
- Insurance
- −$238
- HOA
- −$0
- Vacancy / Maint / Mgmt
- −$1,069
- Net cashflow
- $50
Break-even live
Sensitivity live
| Price | -10% $373 | -5% $211 | +0% $50 | +5% $-111 | +10% $-273 |
|---|---|---|---|---|---|
| Rent | -10% $-352 | -5% $-151 | +0% $50 | +5% $251 | +10% $452 |
| Rate | -1.0pp $337 | -0.5pp $195 | base $50 | +0.5pp $-98 | +1.0pp $-248 |
UW: 25.0% down · 7.5% · 30yr · 1.5% tax · 5.0% vac · 8.0% maint · 8.0% mgmt
Financing live
Cash to close
- Down payment
- $142,500
- Closing costs
- $17,100
- Reserves months
- —
- Total cash needed
- —
Loan-product check · same deal, 3 products live
Conventional
25% down · 7.5% · 30yr
- Down + closing
- —
- Monthly P&I
- —
- Monthly cashflow
- —
- DSCR
- —
- Eligible?
- —
Personal DTI + credit; lowest rate.
DSCR
20% down · 8.5% · 30yr
- Down + closing
- —
- Monthly P&I
- —
- Monthly cashflow
- —
- DSCR
- —
- Eligible?
- —
No personal income docs; deal must DSCR.
Hard money
10% down · 12.0% · 12mo
- Down + closing
- —
- Monthly P&I
- —
- Monthly cashflow
- —
- DSCR
- —
- Eligible?
- —
Short-term bridge; refi at stabilization.
Listing history 24 events
-
2026-06-21days on market $570,000 Active 37 DOM
-
2026-06-18days on market $570,000 Active 34 DOM
-
2026-06-17days on market $570,000 Active 33 DOM
-
2026-06-16days on market $570,000 Active 32 DOM
-
2026-06-15days on market $570,000 Active 31 DOM
-
2026-06-13days on market $570,000 Active 29 DOM
-
2026-06-10price $570,000 Active 25 DOM
-
2026-06-09days on market $590,000 Active 25 DOM
-
2026-06-08days on market $590,000 Active 24 DOM
-
2026-06-07days on market $590,000 Active 23 DOM
-
2026-06-04days on market $590,000 Active 20 DOM
-
2026-06-03days on market $590,000 Active 19 DOM
-
2026-06-02days on market $590,000 Active 18 DOM
-
2026-06-01days on market $590,000 Active 17 DOM
-
2026-05-31days on market $590,000 Active 16 DOM
-
2026-05-15$590,000 Active
-
2022-11-12historical
-
2010-05-11soldstatus $156,000 138-char remark
Show marketing remark (138 chars)
AMAZING SINGLE FAMILY HOME 3 BEDROOMS/2 BATHS WITH TILE FLOORING THROUGHOUT AND RENOVATED KITCHEN. SPACIOUS BACKYARD WITH ROOM FOR POOL.
-
2009-10-30$169,000 138-char remark
Show marketing remark (138 chars)
AMAZING SINGLE FAMILY HOME 3 BEDROOMS/2 BATHS WITH TILE FLOORING THROUGHOUT AND RENOVATED KITCHEN. SPACIOUS BACKYARD WITH ROOM FOR POOL.
-
2007-01-30soldstatus $360,000
-
2004-03-31soldstatus $165,000
-
2003-06-27soldstatus $150,000
-
1997-03-10soldstatus $83,000
-
1974-08-01soldstatus $45,000
ⓘ Source: listings_history table (triggers on properties + properties_extension) + one-shot
backfill from property_details.listing_events for pre-trigger history.
Tax reassessment forecast FL · Resets to sale price
- Current annual tax
- $8,936 · $745/mo
- Projected year-2 tax
- $8,936 · $745/mo
- Expected delta
- $0/yr ($0/mo · 0.0%)
ⓘ Screening estimate from a state-policy table — verify with the county assessor before closing.
Climate risk First Street
- Flood 4/10 Moderate FEMA zone X (unshaded) · 13% chance over 30 yrs
- Wildfire 1/10 Low
- Heat 10/10 Extreme 7 d/yr ≥104°F today · 27 d/yr by 30 yrs out
- Wind 10/10 Extreme 99% chance of damaging wind over 30 yrs
- Air quality 2/10 Low 1 unhealthy d/yr today · 2 by 30 yrs out
Nearby sold comps map
Loading sold comps map…
Walkable amenities ~0.75 mi
Loading nearby amenities…
Taxation est. · year 1
- Rental income
- $61,082
- − Mortgage interest
- −$31,929
- − Property taxes
- −$8,936
- − Insurance
- −$2,850
- − Repairs & maintenance
- −$4,887
- − Management
- −$4,887
- − Depreciation
- −$16,582
- Taxable loss
- −$8,988
- Est. tax savings @ 24.0%
- +$2,157
- After-tax cash flow
- $2,756/yr
For passive investors: Depreciation is non-cash, so a rental often shows a tax loss while cash-flowing — sheltering income. Rental losses are passive: they offset passive income freely, and up to $25,000/yr can offset ordinary (W-2) income if you actively participate and your MAGI is under $100k (phasing out to $0 by $150k); unused losses carry forward. On sale, claimed depreciation is recaptured at up to 25%, and gains may owe capital-gains tax (a 1031 exchange can defer both). Figures are a year-1 estimate at your 24.0% rate — not tax advice; consult a CPA.
Schools (NCES district)
- District
- Miami-Dade
- NCES district ID
- 1200390
- Math proficiency
- 45% ▼ -16.00%
- Reading proficiency
- 54% ▼ -5.00%
- Median HH income
- $43,928
- Composite
- 41.76/100
- National rank
- #3397
- State rank
- #40 of 73 in FL
Livability — North Miami Beach
- Score
- 82/100
- State rank
- #71
- US rank
- #1177
Category grades
Schools grade is shown separately in the Schools card above.
Census & demographics
- Census place
- North Miami Beach, FL
- County
- Miami-Dade County · 2,697,751 people
- City population
- 90,324
- Metro
- Miami-Fort Lauderdale-Pompano Beach, FL
- Population (ZIP)
- 46,606
- Household income
- $60,692
- Rent vs Own
- Severe rent burden
- 2509.0
Population outlook (Miami-Dade County) Hauer SSP2
- Today (2025)
- 3,126,439 people
- By 2030
- 3,325,765 · +6.4%
- By 2040
- 3,697,561 · +18.3%
- By 2050
- 4,012,134 · +28.3%
- By 2075
- 4,605,612 · +47.3%
- By 2100
- 4,866,598 · +55.7%
Race, ethnicity, and origin ACS 2023
- Neighborhood character
- Diverse neighborhood (Simpson 0.62)
- Race & ethnicity
- Black 53% Hispanic / Latino 30% Two or more races 15% White 12% Asian 2%
- Hispanic origin (detail)
- Puerto Rican 4% Cuban 7% Dominican 3%
- Common ancestry
- Hispanic 31% Romanian 1% Scotch-Irish 1%
- Foreign-born
- 52% · Canada, Jamaica, Dominican Republic
- Languages at home
- 29% English-only · French/Haitian/Cajun 35% Spanish 30% Other Indo-European 2%
Political lean MEDSL · Miami-Dade
- 2024 margin
- R (+11.4) · D 43.9% · R 55.4%
- 2008→2024 swing
- -27.6pp toward R · 2008: 16.1pp · 2024: -11.4pp
- All cycles
- 2024: R+11.4 2020: D+7.3 2016: D+29.6 2012: D+23.7 2008: D+16.1
Not yet ingested
- Civics
- —
Market trends
- HPI YoY
- ▼ -445.57%
- Current HPI
- 596.6178
- Rent YoY
- ▼ -1.59%
- Metro
- Miami-Fort Lauderdale-Pompano Beach, FL
- State GDP YoY
- ▲ 3.28%
- F500 in state
- 36
Industry mix (Fortune 500 HQ in FL)
| Industry | F500 HQs | Revenue |
|---|---|---|
| Industrial Technology | 2 | $29B |
|
||
| Insurance | 2 | $17B |
|
||
| Retail | 1 | $60B |
|
||
| Technology Distribution | 1 | $58B |
|
||
| Homebuilding | 1 | $35B |
|
||
| Technology Manufacturing | 1 | $35B |
|
||
Price history
+1211.1% since first listed9 events — show timeline
- 2026-05-15 Listed $590,000 MARMLS
- 2022-11-12 Rental Removed — RENT.
- 2010-05-11 Sold (MLS) $156,000 MARMLS
- 2009-10-30 Listed $169,000 MARMLS
- 2007-01-30 Sold (Public Records) $360,000 Public Records
- 2004-03-31 Sold (Public Records) $165,000 Public Records
- 2003-06-27 Sold (Public Records) $150,000 Public Records
- 1997-03-10 Sold (Public Records) $83,000 Public Records
- 1974-08-01 Sold (Public Records) $45,000 Public Records
Property tax history
+9.6%/yrLatest (2025): $8,936 · +35.4% YoY. Source: county tax records.
Cash-flow waterfall
monthlySold comps — $/sqft
last 12 mo · ≤1 miLoading sold comps…