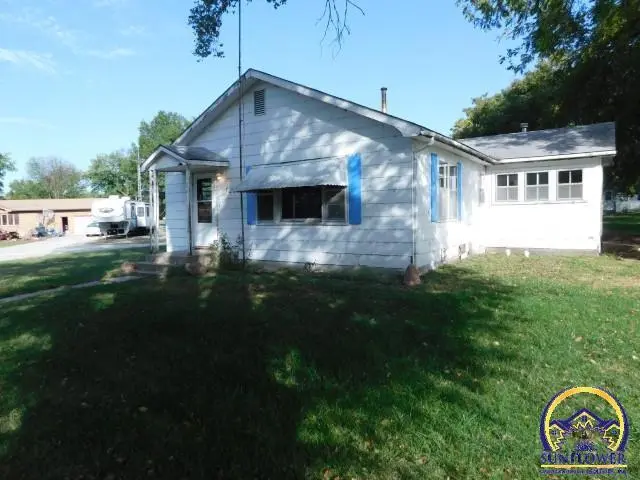
504 2nd St · Whiting, KS
Flood risk 1/10 · Minimal
- FEMA flood zone
- X (unshaded)
- Chance of flooding over 30 yrs
- 0.0%
- Est. flood insurance / yr
- $507 – $1,088
Fire risk 4/10 · Minor
- Est. fire insurance / yr
- $1,154 – $2,142
Heat risk 4/10 · Minor
- Hot days now (above 107°F)
- 7 days/yr
- Hot days in 30 yrs
- 17 days/yr
Wind risk 2/10 · Minimal
- Chance of severe wind over 30 yrs
- —
Air-quality risk 2/10 · Minimal
- Unhealthy air days now
- 1 days/yr
- Unhealthy air days in 30 yrs
- 1 days/yr
Risk factors via First Street. Map © Google.
Why this score? — see what drove the B grade
The composite is a weighted blend of 9 inputs, each scored 0–100. Each bar is that input's sub-score; the figure is the points it added to the 100-point composite (weight × sub-score).
- Cash flow +30.0/30.0
- DSCR +10.0/10.0
- 1% rule +8.7/10.0
- ARV discount +7.5/15.0
- Appreciation +4.6/10.0
- Schools +4.1/10.0
- Livability +2.9/5.0
- Rent growth +2.5/5.0
- Condition / age +2.5/5.0
$70,000
🖨 Deal sheet (PDF) 📄 Offer letter ✓ Due diligence
Key facts
- Enclosed back porch
- Shade trees
- Corner lot
Tags
Property features AI
Finance
- Other: Listing broker: Kellerman Real Estate
Exterior
- Parking: Detached 2-car garage
- Utilities: Public water; Public sewer
- Home design: Single-family residence; Residential property; Single house
- Construction: Composition roof; Construction materials: Other; Above-grade finished area reported
- Exterior features: Corner lot; Lot dimensions approximately 112.5 x 150; Approximately 0.5 acre lot
Interior
- Flooring: Hardwood; Vinyl; Carpet
- Bathrooms: 1 full bathroom
- Heating & cooling: Central air conditioning
- Interior features: Gas water heater; Crawl space basement
- Laundry & utility: Main-level laundry
Neighborhood map
What this means for you Summary
Snapshot
- This is a 3-bed/1.0-bath single-family listed at $70k.
Deal economics
- At list price, monthly cash flow is $300 ($4k/yr) — positive.
- The deal already cash-flows at list — no discount required.
- Meets the 1% rule at list price ($962 rent vs $70k).
Location & tenants
- Location reads 58/100 on livability (#495 in KS) — a working-class tenant base; expect higher turnover. Strengths: cost of living A+, housing A+; Watch: crime F, amenities F, commute F.
- North Jackson (rural): math 40% / reading 50% proficiency, ranked #28 of 280 in KS (top 10%) — families likely to look elsewhere, expect single-tenant / working-renter base with shorter leases.
- Zoned schools: Jackson Heights Elementary School (math 52% / reading 52%, grade C-, #131 of 684 statewide, top 23%, 228 students, 40% FRL); Jackson Heights High School And Middle School (math 17% / reading 32%, grade F, #105 of 327 statewide, top 49%, 176 students, 42% FRL).
- Market conditions: 4 active listings in the ZIP; 28 units permitted in Jackson County in 2024 (0 in 5+ unit buildings).
Forward outlook
- Local home prices are declining (-0.7%/yr); year-one equity from $484 of loan paydown is wiped out by about $494 of value loss. Plan a longer hold.
- Jackson County population projected at -13% by 2050 — secular population decline; favor cash flow + early exit over multi-decade hold.
- At projected returns (-0.7% appreciation + 3.0% rent growth), your $20k cash investment doubles in ~5 years — after that, you're playing with house money.
Negotiation context
- Only 11 days on market — expect competitive offers; lowballing is unlikely to land.
Risks & watch-outs
- Watch-outs: built in 1919 — expect roof / HVAC / electrical / plumbing capex.
Questions for the listing agent
- Built in 1919 — when were the roof, HVAC, electrical panel, plumbing, and water heater last replaced?
- Is there a deadline driving the sale (1031 exchange, divorce, estate, relocation)? That informs how much negotiation room exists.
- Schools are F-rated, which usually means shorter tenancies and higher turnover. Who's the typical renter profile here, and what's been the actual vacancy rate?
- Crime grade is F in this area — have there been break-ins, vandalism, or insurance claims at this property in the last 3 years? What carrier currently insures it and at what premium?
- What's the average days-on-market for RENTAL listings here right now (not sales)? A rising rental-DOM trend means longer vacancies and softer asking-rent achievability than the comps imply.
- What's the recent tenant-quality profile in this submarket — average credit score on applications, eviction rate, late-payment / NSF rate, and stable-employment percentage? A property-management company in the area should have these aggregated.
- How much new for-sale + rental construction is in the pipeline within 1–3 miles? Heavy new supply typically softens prices + rents 12–24 months out; constrained supply supports both.
Investment metrics
- 1% rule
- 1.37% ✓
- Cap rate
- 11.44%
- Cash-on-cash
- 18.38%
- DSCR
- 1.82
- GRM
- 6.1
CMA / ARV
No comps found within radius.
Projected returns pro-forma
-0.71% appreciation · 3.0% rent growth · sell at horizon
- IRR
- 16.3%
- Equity multiple
- 1.75×
- Total profit
- $14,781
- Equity at exit
- $17,889
- IRR
- 21.7%
- Equity multiple
- 3.25×
- Total profit
- $44,165
- Equity at exit
- $19,645
Cash invested: $19,600 (down + closing). Projections, not guarantees.
Landlord ↔ Tenant lean methodology
- Overall (STATE)
- 83 Strongly Landlord-Friendly
- State Kansas
- 83 Strongly Landlord-Friendly · R+10
- County
- — inherits STATE
- City
- — inherits STATE
ZIP-level market 66552
- Home prices YoY
- -0.3%
- Active inventory
- 4
- Price-to-rent
- 6.1×
Monthly cashflow live
- Estimated rent
- $962 medium interval (Pro) →
- Mortgage (P&I)
- −$367
- Tax from tax record
- −$63 /mo · $762/yr
- Insurance
- −$29
- HOA
- −$0
- Vacancy / Maint / Mgmt
- −$202
- Net cashflow
- $300
Break-even live
Sensitivity live
| Price | -10% $340 | -5% $320 | +0% $300 | +5% $280 | +10% $261 |
|---|---|---|---|---|---|
| Rent | -10% $224 | -5% $262 | +0% $300 | +5% $338 | +10% $376 |
| Rate | -1.0pp $335 | -0.5pp $318 | base $300 | +0.5pp $282 | +1.0pp $264 |
UW: 25.0% down · 7.5% · 30yr · 1.5% tax · 5.0% vac · 8.0% maint · 8.0% mgmt
Financing live
Cash to close
- Down payment
- $17,500
- Closing costs
- $2,100
- Reserves months
- —
- Total cash needed
- —
Loan-product check · same deal, 3 products live
Conventional
25% down · 7.5% · 30yr
- Down + closing
- —
- Monthly P&I
- —
- Monthly cashflow
- —
- DSCR
- —
- Eligible?
- —
Personal DTI + credit; lowest rate.
DSCR
20% down · 8.5% · 30yr
- Down + closing
- —
- Monthly P&I
- —
- Monthly cashflow
- —
- DSCR
- —
- Eligible?
- —
No personal income docs; deal must DSCR.
Hard money
10% down · 12.0% · 12mo
- Down + closing
- —
- Monthly P&I
- —
- Monthly cashflow
- —
- DSCR
- —
- Eligible?
- —
Short-term bridge; refi at stabilization.
Listing history 3 events
-
2026-05-01status Pending
-
2026-04-20$70,000 Active
-
1996-09-01soldstatus
ⓘ Source: listings_history table (triggers on properties + properties_extension) + one-shot
backfill from property_details.listing_events for pre-trigger history.
Tax reassessment forecast KS · Resets to sale price
- Current annual tax
- $762 · $63/mo
- Projected year-2 tax
- $987 · $82/mo
- Expected delta
- +$225/yr (+$19/mo · 29.5%)
ⓘ Screening estimate from a state-policy table — verify with the county assessor before closing.
Climate risk First Street
- Flood 1/10 Low FEMA zone X (unshaded) · 0% chance over 30 yrs
- Wildfire 4/10 Moderate
- Heat 4/10 Moderate 7 d/yr ≥107°F today · 17 d/yr by 30 yrs out
- Wind 2/10 Low
- Air quality 2/10 Low 1 unhealthy d/yr today · 1 by 30 yrs out
Nearby sold comps map
Loading sold comps map…
Walkable amenities ~0.75 mi
Loading nearby amenities…
Taxation est. · year 1
- Rental income
- $11,543
- − Mortgage interest
- −$3,921
- − Property taxes
- −$762
- − Insurance
- −$350
- − Repairs & maintenance
- −$923
- − Management
- −$923
- − Depreciation
- −$2,036
- Taxable income
- $2,627
- Est. tax owed @ 24.0%
- −$630
- After-tax cash flow
- $2,972/yr
For passive investors: Depreciation is non-cash, so a rental often shows a tax loss while cash-flowing — sheltering income. Rental losses are passive: they offset passive income freely, and up to $25,000/yr can offset ordinary (W-2) income if you actively participate and your MAGI is under $100k (phasing out to $0 by $150k); unused losses carry forward. On sale, claimed depreciation is recaptured at up to 25%, and gains may owe capital-gains tax (a 1031 exchange can defer both). Figures are a year-1 estimate at your 24.0% rate — not tax advice; consult a CPA.
Schools (NCES district)
- District
- North Jackson
- NCES district ID
- 2004830
- Math proficiency
- 40% ▼ -5.00%
- Reading proficiency
- 50% ▲ 2.00%
- Median HH income
- $52,194
- Composite
- 41.05/100
- National rank
- #7452
- State rank
- #28 of 280 in KS
Livability — Whiting
- Score
- 58/100
- State rank
- #495
- US rank
- #20756
Category grades
Schools grade is shown separately in the Schools card above.
Census & demographics
- Census place
- Whiting, KS
- Population (ZIP)
- 592
Population outlook (Jackson County) Hauer SSP2
- Today (2025)
- 12,926 people
- By 2030
- 12,611 · -2.4%
- By 2040
- 11,931 · -7.7%
- By 2050
- 11,227 · -13.1%
- By 2075
- 9,901 · -23.4%
- By 2100
- 8,469 · -34.5%
Race, ethnicity, and origin ACS 2023
- Neighborhood character
- Predominantly White (92%)
- Race & ethnicity
- White 92% Two or more races 5% Black 3%
- Common ancestry
- Slovak 4% Italian 2% Lithuanian 1%
Political lean MEDSL · Jackson
- 2024 margin
- Solid R (+42.6) · D 27.8% · R 70.4% · Other 1.8%
- 2008→2024 swing
- -18.6pp toward R · 2008: -24.0pp · 2024: -42.6pp
- All cycles
- 2024: R+42.6 2020: R+39.9 2016: R+41.9 2012: R+29.3 2008: R+24.0
Not yet ingested
- Civics
- —
Market trends
- HPI YoY
- ▼ -0.71%
- Current HPI
- 241.9327
- Rent YoY
- —
- Metro
- —
- State GDP YoY
- —
- F500 in state
- 0
Price history
3 events — show timeline
- 2026-05-01 Pending — Sunflower MLS as distributed by MLS GRID
- 2026-04-20 Listed $70,000 Sunflower MLS as distributed by MLS GRID
- 1996-09-01 Sold (Public Records) — Public Records
Property tax history
+0.2%/yrLatest (2025): $762 · -2.4% YoY. Source: county tax records.
Cash-flow waterfall
monthlySold comps — $/sqft
last 12 mo · ≤1 miLoading sold comps…