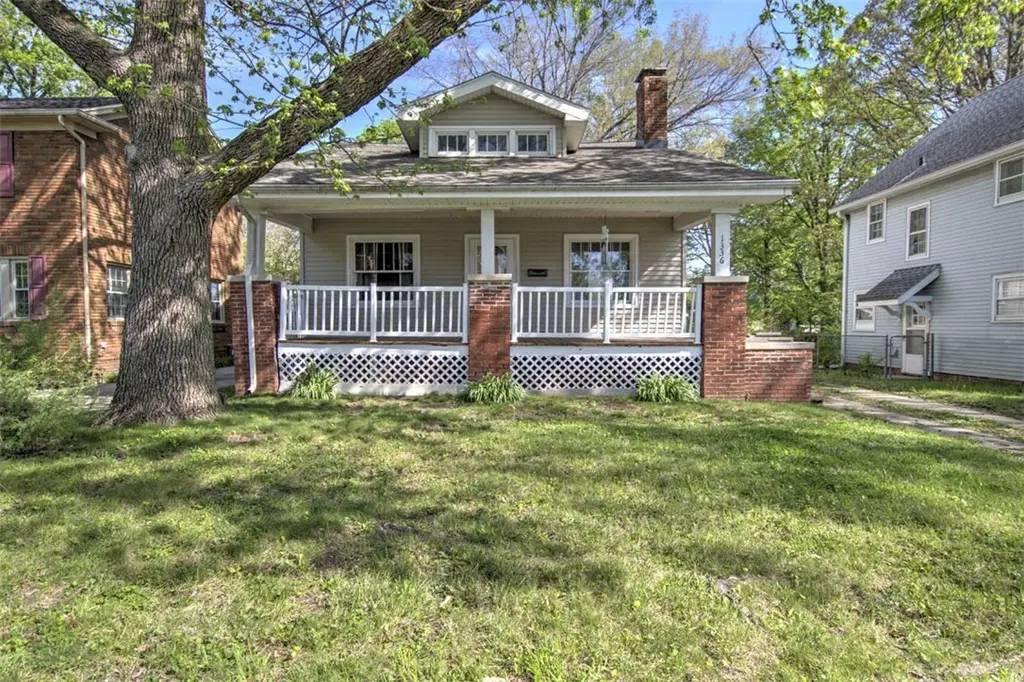
1336 W Riverview Ave · Decatur, IL
Flood risk 1/10 · Minimal
- FEMA flood zone
- X (unshaded)
- Chance of flooding over 30 yrs
- 0.0%
- Est. flood insurance / yr
- $473 – $860
Fire risk 1/10 · Minimal
- Est. fire insurance / yr
- $804 – $1,492
Heat risk 4/10 · Minor
- Hot days now (above 105°F)
- 7 days/yr
- Hot days in 30 yrs
- 19 days/yr
Wind risk 2/10 · Minimal
- Chance of severe wind over 30 yrs
- 2.0%
Air-quality risk 2/10 · Minimal
- Unhealthy air days now
- 1 days/yr
- Unhealthy air days in 30 yrs
- 1 days/yr
Risk factors via First Street. Map © Google.
Why this score? — see what drove the B- grade
The composite is a weighted blend of 9 inputs, each scored 0–100. Each bar is that input's sub-score; the figure is the points it added to the 100-point composite (weight × sub-score).
- Cash flow +28.9/30.0
- ARV discount +10.6/15.0
- DSCR +10.0/10.0
- 1% rule +9.0/10.0
- Livability +3.0/5.0
- Rent growth +2.5/5.0
- Condition / age +2.5/5.0
- Schools +0.4/10.0
- Appreciation +0.0/10.0
$92,000
🖨 Deal sheet 📄 Offer letter ✓ Due diligence
Listing remarks MLS
Wow! Remodeled arts & crafts style 1 story 4 bedroom home. New roof, siding, gutters, porch, garage siding, door, kitchen, bath, paint, carpet, refinished floors. Some new doors, trim & plumbing. Perfect condition. Newer furnace & CA also! Seller is a licensed Illinois Real Estate Broker.
Key facts
- Hardwood flooring
- Spacious yard
- Flexible space
Tags
Property features AI
Finance
- Other: Zoning: R-3
Exterior
- Parking: Detached garage (1 car)
- Utilities: Public water; Public sewer
- Home design: Single-family residence; Two-story; Residential property; Subdivision: University Place 2nd Add
- Construction: Vinyl siding; Asphalt shingle roof; Built as two-story construction
- Exterior features: Front porch; Concrete and gravel driveway/road surface
Interior
- Kitchen: Dishwasher; Oven
- Bathrooms: 1 full bathroom
- Heating & cooling: Electric heating; Central air; Window air conditioning units
- Interior features: Wood-burning fireplace (1); Unfinished full basement; 8 total rooms
- Laundry & utility: Gas water heater
Neighborhood map
What this means for you Summary
Snapshot
- This is a 4-bed/1.0-bath other listed at $92k.
Deal economics
- At list price, monthly cash flow is $312 ($4k/yr) — positive.
- The deal already cash-flows at list — no discount required.
- Meets the 1% rule at list price ($1k rent vs $92k).
- Recommended offer: $89k (3.0% below list) — sets the bar for market timing.
- Cap rate 10.4% vs local median 7.0% in Decatur — top-decile yield for the area; either an underpriced asset or a hidden risk that comps aren't pricing in. Stress-test before assuming the spread holds.
Location & tenants
- Location reads 59/100 on livability (#1,076 in IL) — a working-class tenant base; expect higher turnover. Strengths: cost of living A+, housing A+; Watch: schools F, crime F, amenities F.
- Decatur SD 61 (urban): math 3% / reading 6% proficiency, ranked #605 of 620 in IL (top 98%) — low school quality limits family demand, transient renter base, plan for 1-2y turnover; 73% free/reduced lunch — lower-income household profile, screen leases tightly.
- Market conditions: 75 active listings in the ZIP; 2 comparable units currently listed for rent nearby; 63 units permitted in Macon County in 2024 (0 in 5+ unit buildings).
- This rent runs 30% of the median local income ($51k/yr) — at the standard rent-burdened threshold; future hikes will face affordability resistance.
Forward outlook
- Local home prices are declining (-3.0%/yr); year-one equity from $636 of loan paydown is wiped out by about $3k of value loss. Plan a longer hold.
- Macon County population projected at -24% by 2050 — secular population decline; favor cash flow + early exit over multi-decade hold.
- At projected returns (-3.0% appreciation + 3.0% rent growth), your $26k cash investment doubles in ~9 years — after that, you're playing with house money.
Negotiation context
- It's been on market 55 days — a 3% lower offer ($89k) is reasonable based on typical stale-listing flexibility.
- 2 sale attempts since 20y ago with the ask held roughly flat each time — persistent listings suggest the price (not the market) is what's stuck; bring a comps-based counter.
- Current owner paid $72k; 27% above their basis — modest negotiation headroom, anchor on the comps not their cost.
Risks & watch-outs
- Watch-outs: built in 1925 — expect roof / HVAC / electrical / plumbing capex.
Questions for the listing agent
- It's been on market 55 days. Have you received any prior offers? Is the seller open to a 3% concession, seller financing, or rate buy-down credit?
- Built in 1925 — when were the roof, HVAC, electrical panel, plumbing, and water heater last replaced?
- Is there a deadline driving the sale (1031 exchange, divorce, estate, relocation)? That informs how much negotiation room exists.
- Schools are F-rated, which usually means shorter tenancies and higher turnover. Who's the typical renter profile here, and what's been the actual vacancy rate?
- Crime grade is F in this area — have there been break-ins, vandalism, or insurance claims at this property in the last 3 years? What carrier currently insures it and at what premium?
- What's the average days-on-market for RENTAL listings here right now (not sales)? A rising rental-DOM trend means longer vacancies and softer asking-rent achievability than the comps imply.
- What's the recent tenant-quality profile in this submarket — average credit score on applications, eviction rate, late-payment / NSF rate, and stable-employment percentage? A property-management company in the area should have these aggregated.
- How much new for-sale + rental construction is in the pipeline within 1–3 miles? Heavy new supply typically softens prices + rents 12–24 months out; constrained supply supports both.
Investment metrics
- 1% rule
- 1.40% ✓
- Cap rate
- 10.36%
- Cash-on-cash
- 14.52%
- DSCR
- 1.65
- GRM
- 6.0
CMA / ARV
- ARV (median comp)
- $98,726
- List price
- $92,000
- Delta
- -6.81%
- Verdict
- FAIR
- Comps
- 20 within 1.0 mi
Projected returns pro-forma
-3.0% appreciation · 3.0% rent growth · sell at horizon
- IRR
- 5.0%
- Equity multiple
- 1.19×
- Total profit
- $5,006
- Equity at exit
- $13,717
- IRR
- 14.5%
- Equity multiple
- 2.17×
- Total profit
- $30,168
- Equity at exit
- $7,954
Cash invested: $25,760 (down + closing). Projections, not guarantees.
Landlord ↔ Tenant lean methodology
- Overall (STATE)
- 43 Moderately Tenant-Leaning
- State Illinois
- 43 Moderately Tenant-Leaning · D+7
- County
- — inherits STATE
- City
- — inherits STATE
ZIP-level market 62522
- Home prices YoY
- -16.9%
- Active inventory
- 75
- Price-to-rent
- 6.0×
Monthly cashflow live
- Estimated rent
- $1,283 medium interval (Pro) →
- Mortgage (P&I)
- −$482
- Tax from tax record
- −$181 /mo · $2,177/yr
- Insurance
- −$38
- HOA
- −$0
- Vacancy / Maint / Mgmt
- −$270
- Net cashflow
- $312
Break-even live
UW: 25.0% down · 7.5% · 30yr · 1.5% tax · 5.0% vac · 8.0% maint · 8.0% mgmt
Financing live
Cash to close
- Down payment
- $23,000
- Closing costs
- $2,760
- Reserves months
- —
- Total cash needed
- —
Loan-product check · same deal, 3 products live
Conventional
25% down · 7.5% · 30yr
- Down + closing
- —
- Monthly P&I
- —
- Monthly cashflow
- —
- DSCR
- —
- Eligible?
- —
Personal DTI + credit; lowest rate.
DSCR
20% down · 8.5% · 30yr
- Down + closing
- —
- Monthly P&I
- —
- Monthly cashflow
- —
- DSCR
- —
- Eligible?
- —
No personal income docs; deal must DSCR.
Hard money
10% down · 12.0% · 12mo
- Down + closing
- —
- Monthly P&I
- —
- Monthly cashflow
- —
- DSCR
- —
- Eligible?
- —
Short-term bridge; refi at stabilization.
Rent comps 2 comps
| Address | Beds | Baths | Sqft | Rent | $/sqft | DOM | Units | Dist |
|---|---|---|---|---|---|---|---|---|
| 520 S Church St Decatur, IL | 3.0 | 1.5 | 1250 | $1,199 | $0.96 | 13d | 1 | 1.15mi |
| 1045 N Monroe St Decatur, IL | 3.0 | 2.0 | 1094 | $1,000 | $0.91 | 43d | 1 | 1.32mi |
Listing history 20 events
-
2026-06-17statusdays on market $92,000 Pending 55 DOM
-
2026-06-16days on market $92,000 Active Under Contract 54 DOM
-
2026-06-15days on market $92,000 Active Under Contract 53 DOM
-
2026-06-14days on market $92,000 Active Under Contract 51 DOM
-
2026-06-13days on market $92,000 Active Under Contract 50 DOM
-
2026-06-10days on market $92,000 Active Under Contract 48 DOM
-
2026-06-09days on market $92,000 Active Under Contract 47 DOM
-
2026-06-08days on market $92,000 Active Under Contract 46 DOM
-
2026-06-07days on market $92,000 Active Under Contract 45 DOM
-
2026-06-05days on market $92,000 Active Under Contract 42 DOM
-
2026-06-02days on market $92,000 Active Under Contract 40 DOM
-
2026-06-01days on market $92,000 Active Under Contract 39 DOM
-
2026-05-31days on market $92,000 Active Under Contract 38 DOM
-
2026-05-30days on market $92,000 Active Under Contract 37 DOM
-
2026-05-18price $92,000 994-char remark
-
2026-05-09price $94,000 994-char remark
-
2026-04-23$96,000 Active 994-char remark
-
2007-07-12soldstatus $72,466
-
2007-07-11soldstatus $72,500 303-char remark
Show marketing remark (303 chars)
Wow! Remodeled arts & crafts style 1 story 4 bedroom home. New roof, siding, gutters, porch, garage siding, door, kitchen, bath, paint, carpet, refinished floors. Some new doors, trim & plumbing. Perfect condition. Newer furnace & CA also! Seller is a licensed Illinois Real Estate Broker.
-
2006-08-29$79,900 303-char remark
Show marketing remark (303 chars)
Wow! Remodeled arts & crafts style 1 story 4 bedroom home. New roof, siding, gutters, porch, garage siding, door, kitchen, bath, paint, carpet, refinished floors. Some new doors, trim & plumbing. Perfect condition. Newer furnace & CA also! Seller is a licensed Illinois Real Estate Broker.
ⓘ Source: listings_history table (triggers on properties + properties_extension) + one-shot
backfill from property_details.listing_events for pre-trigger history.
Tax reassessment forecast IL · Partial reset (capped growth)
- Current annual tax
- $2,177 · $181/mo
- Projected year-2 tax
- $2,177 · $181/mo
- Expected delta
- $0/yr ($0/mo · 0.0%)
ⓘ Screening estimate from a state-policy table — verify with the county assessor before closing.
Climate risk First Street
- Flood 1/10 Low FEMA zone X (unshaded) · 0% chance over 30 yrs
- Wildfire 1/10 Low
- Heat 4/10 Moderate 7 d/yr ≥105°F today · 19 d/yr by 30 yrs out
- Wind 2/10 Low 2% chance of damaging wind over 30 yrs
- Air quality 2/10 Low 1 unhealthy d/yr today · 1 by 30 yrs out
Nearby sold comps map
Loading sold comps map…
Walkable amenities ~0.75 mi
Loading nearby amenities…
Taxation est. · year 1
- Rental income
- $15,402
- − Mortgage interest
- −$5,153
- − Property taxes
- −$2,177
- − Insurance
- −$460
- − Repairs & maintenance
- −$1,232
- − Management
- −$1,232
- − Depreciation
- −$2,676
- Taxable income
- $2,470
- Est. tax owed @ 24.0%
- −$593
- After-tax cash flow
- $3,148/yr
For passive investors: Depreciation is non-cash, so a rental often shows a tax loss while cash-flowing — sheltering income. Rental losses are passive: they offset passive income freely, and up to $25,000/yr can offset ordinary (W-2) income if you actively participate and your MAGI is under $100k (phasing out to $0 by $150k); unused losses carry forward. On sale, claimed depreciation is recaptured at up to 25%, and gains may owe capital-gains tax (a 1031 exchange can defer both). Figures are a year-1 estimate at your 24.0% rate — not tax advice; consult a CPA.
Schools (NCES district)
- District
- Decatur SD 61
- NCES district ID
- 1711850
- Math proficiency
- 3% ▼ -4.00%
- Reading proficiency
- 6% ▼ -6.00%
- Median HH income
- $38,864
- Composite
- 3.99/100
- National rank
- #10059
- State rank
- #605 of 620 in IL
Livability — Decatur
- Score
- 59/100
- State rank
- #1076
- US rank
- #20533
Category grades
Schools grade is shown separately in the Schools card above.
Census & demographics
- Census place
- Decatur, IL
- County
- Macon County · 78,333 people
- City population
- 78,333
- Metro
- Decatur, IL
- Population (ZIP)
- 15,185
- Household income
- $50,669
- Rent vs Own
- Severe rent burden
- 321.0
Population outlook (Macon County) Hauer SSP2
- Today (2025)
- 99,568 people
- By 2030
- 94,973 · -4.6%
- By 2040
- 85,250 · -14.4%
- By 2050
- 75,920 · -23.8%
- By 2075
- 55,962 · -43.8%
- By 2100
- 36,468 · -63.4%
Race, ethnicity, and origin ACS 2023
- Neighborhood character
- Majority White (62%)
- Race & ethnicity
- White 62% Black 28% Two or more races 7% Hispanic / Latino 2% Asian 1%
- Common ancestry
- Romanian 1% Italian 1% Slovak 1%
- Foreign-born
- 2% · Canada, China, Jamaica
- Languages at home
- 97% English-only · Spanish 2%
Political lean MEDSL · Macon
- 2024 margin
- R (+18.9) · D 39.8% · R 58.7% · Other 1.4%
- 2008→2024 swing
- -20.0pp toward R · 2008: 1.1pp · 2024: -18.9pp
- All cycles
- 2024: R+18.9 2020: R+17.7 2016: R+18.1 2012: R+5.2 2008: D+1.1
Not yet ingested
- Civics
- —
Market trends
- HPI YoY
- ▼ -36.64%
- Current HPI
- 180.7847
- Rent YoY
- —
- Metro
- Decatur, IL
- State GDP YoY
- ▲ 1.59%
- F500 in state
- 60
Industry mix (Fortune 500 HQ in IL)
| Industry | F500 HQs | Revenue |
|---|---|---|
| Insurance | 4 | $201B |
|
||
| Consumer Goods | 4 | $87B |
|
||
| Industrial Machinery | 3 | $64B |
|
||
| Healthcare | 2 | $55B |
|
||
| Retail / Pharmacy | 1 | $148B |
|
||
| Agriculture / Food | 1 | $86B |
|
||
Price history
+15.1% since first listed8 events — show timeline
- 2026-06-17 Pending — CIBR
- 2026-05-28 Contingent — CIBR
- 2026-05-18 Price Changed $92,000 CIBR
- 2026-05-09 Price Changed $94,000 CIBR
- 2026-04-23 Listed $96,000 CIBR
- 2007-07-12 Sold (Public Records) $72,466 Public Records
- 2007-07-11 Sold (MLS) $72,500 MRED as Distributed by MLS Grid
- 2006-08-29 Listed $79,900 MRED as Distributed by MLS Grid
Property tax history
+3.5%/yrLatest (2024): $2,177 · +0.8% YoY. Source: county tax records.
Cash-flow waterfall
monthlySold comps — $/sqft
last 12 mo · ≤1 miLoading sold comps…