310 Murray Ln · Eastwood, LA
Flood risk 4/10 · Minor
- FEMA flood zone
- X (unshaded)
- Chance of flooding over 30 yrs
- 0.22%
- Est. flood insurance / yr
- $507 – $1,088
Fire risk 3/10 · Minor
- Est. fire insurance / yr
- $1,269 – $2,357
Heat risk 7/10 · Major
- Hot days now (above 111°F)
- 7 days/yr
- Hot days in 30 yrs
- 22 days/yr
Wind risk 6/10 · Moderate
- Chance of severe wind over 30 yrs
- 60.0%
Air-quality risk 2/10 · Minimal
- Unhealthy air days now
- 1 days/yr
- Unhealthy air days in 30 yrs
- 1 days/yr
Risk factors via First Street. Map © Google.
Why this score? — see what drove the D grade
The composite is a weighted blend of 9 inputs, each scored 0–100. Each bar is that input's sub-score; the figure is the points it added to the 100-point composite (weight × sub-score).
- Cash flow +17.2/30.0
- ARV discount +5.5/15.0
- DSCR +5.4/10.0
- Schools +3.8/10.0
- 1% rule +3.4/10.0
- Livability +3.1/5.0
- Rent growth +2.5/5.0
- Condition / age +2.5/5.0
- Appreciation +0.0/10.0
$238,500
🖨 Deal sheet (PDF) 📄 Offer letter ✓ Due diligence
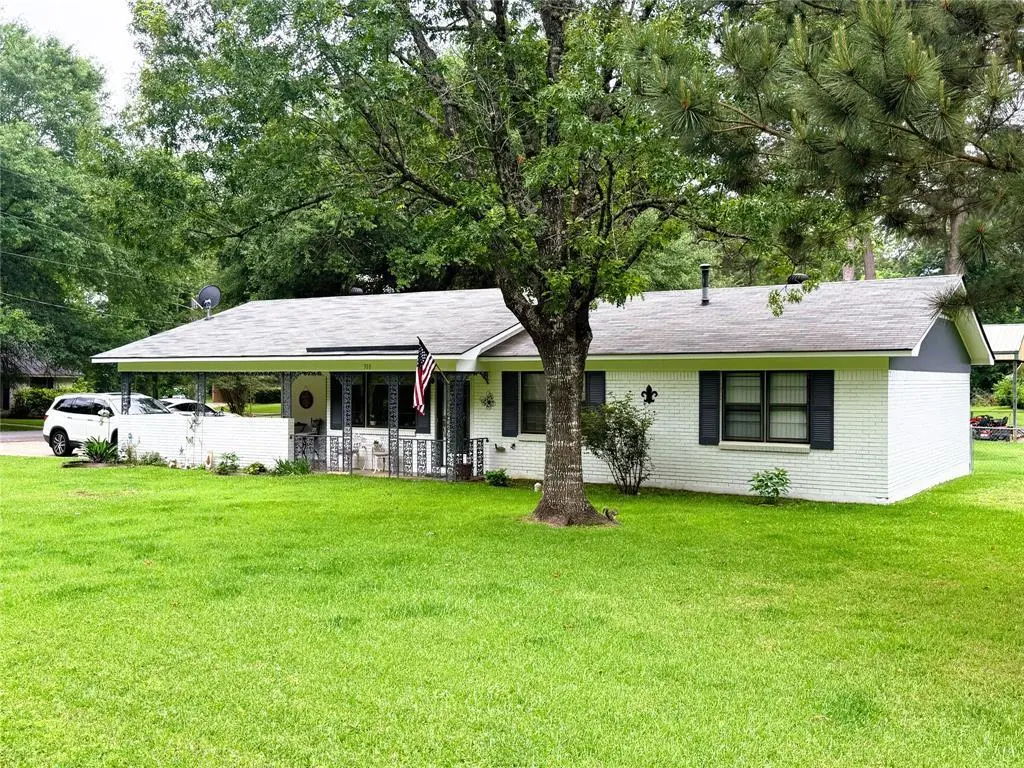
Listing remarks
Beautifully updated 3 bedroom, 2 bath brick home situated on a . 4157-acre corner lot in a quiet rural subdivision. This spacious property features a newly added laundry room, granite countertops, and a new 16+ SEER HVAC system for efficient year-round comfort. Outside, enjoy a 24×40×12 shop with a roll-up door, perfect for projects, storage, or equipment, along with a separate storage building for even more space. The backyard offers a refreshing above-ground pool, making it ideal for relaxing or entertaining. With modern updates, great outdoor amenities, and a generous lot, this home delivers comfort, convenience, and room to spread out.
Key facts
- Laundry room
- 16 seer hvac system
- Granite countertops
Tags
Property features AI
Finance
- Other: Property is not attached to another dwelling; Will not subdivide; Municipal Utility District: No
- HOA & community: No homeowners association
Exterior
- Parking: Attached carport; Carport with 2 covered spaces; Driveway
- Utilities: City water; City sewer; Asphalt access (street); HVAC energy efficiency features
- Home design: Single-family residence; Residential property; Built in 1966; One story; Slab foundation; Brick construction; Asphalt roof
- Construction: Brick construction; Slab foundation; Asphalt roof; Year built 1966
- Exterior features: Covered porch; Covered patio/porch; Above-ground pool; Chain-link fencing; Workshop with electric; Corner lot
Interior
- Kitchen: Dishwasher; Garbage disposal; Gas range; Microwave; Granite counters
- Bedrooms: 3 bedrooms (primary bedroom on level 1)
- Flooring: Carpet
- Bathrooms: 2 full bathrooms
- Heating & cooling: Central heating; Heat pump; Central air conditioning
- Interior features: Cable TV available; Eat-in kitchen; Granite counters; One-level floorplan; Wood-burning fireplace (1)
- Laundry & utility: Utility room for laundry
Neighborhood map
What this means for you Summary
Snapshot
- This is a 3-bed/2.0-bath single-family listed at $238k.
Deal economics
- At list price, monthly cash flow is $170 ($2k/yr) — positive.
- The deal already cash-flows at list — no discount required.
- To meet the 1% rule (rent ≥ 1% of price), the offer needs to be $201k (15.9% below list).
- Recommended offer: $201k (15.9% below list) — sets the bar for 1% rule.
- Cap rate 7.1% vs local median 2.4% in Eastwood — top-decile yield for the area; either an underpriced asset or a hidden risk that comps aren't pricing in. Stress-test before assuming the spread holds.
Location & tenants
- Location reads 61/100 on livability (#241 in LA) — a middle-class / working-renter tenant base. Strengths: cost of living A, crime A-, housing A-; Watch: employment D, amenities F, commute F.
- Bossier Parish (urban): math 40% / reading 47% proficiency, ranked #17 of 98 in LA (top 17%) — families likely to look elsewhere, expect single-tenant / working-renter base with shorter leases.
- Zoned schools: Bossier Elementary School (math 8% / reading 17%, grade F, #550 of 646 statewide, top 88%, 222 students, 93% FRL); Haughton Middle School (math 32% / reading 47%, grade F, #66 of 218 statewide, top 30%, 1,075 students, 61% FRL); Haughton High School (math 56% / reading 52%, grade C-, #28 of 265 statewide, top 11%, 1,381 students, 53% FRL) — zoned schools average 69% FRL vs 41% district-wide (28 pts higher); higher-poverty schools than district average — tighter screening recommended.
- Market conditions: 335 active listings in the ZIP; 1 comparable units currently listed for rent nearby; solid renter incomes; 716 units permitted in Bossier Parish in 2024 (0 in 5+ unit buildings).
- This rent runs 31% of the median local income ($79k/yr) — at the standard rent-burdened threshold; future hikes will face affordability resistance.
Forward outlook
- Local home prices are declining (-3.0%/yr); year-one equity from $2k of loan paydown is wiped out by about $7k of value loss. Plan a longer hold.
- Bossier County population projected at +28% by 2050 — long-run rental-demand tailwind backs the buy-and-hold thesis.
Negotiation context
- It's been on market 38 days — a 3% lower offer ($231k) is reasonable based on typical stale-listing flexibility.
- Current owner paid $180k; 32% above their basis — modest negotiation headroom, anchor on the comps not their cost.
Risks & watch-outs
- Climate carrying-cost: major wind risk, 60% chance of damaging wind over 30y; extreme-heat days projected 7→22/yr by 2055 (HVAC capex compounding) — expect insurance premiums to compound above CPI over the hold.
Questions for the listing agent
- It's been on market 38 days. Have you received any prior offers? Is the seller open to a 16% concession, seller financing, or rate buy-down credit?
- Built in 1966 — when were the roof, HVAC, electrical panel, plumbing, and water heater last replaced?
- Is there a deadline driving the sale (1031 exchange, divorce, estate, relocation)? That informs how much negotiation room exists.
- Schools are D-rated, which usually means shorter tenancies and higher turnover. Who's the typical renter profile here, and what's been the actual vacancy rate?
- The area grade is low — what's the realistic commute time and amenity access for the typical tenant pool here? Any planned neighborhood developments (good or bad) we should know about?
- What's the average days-on-market for RENTAL listings here right now (not sales)? A rising rental-DOM trend means longer vacancies and softer asking-rent achievability than the comps imply.
- What's the recent tenant-quality profile in this submarket — average credit score on applications, eviction rate, late-payment / NSF rate, and stable-employment percentage? A property-management company in the area should have these aggregated.
- How much new for-sale + rental construction is in the pipeline within 1–3 miles? Heavy new supply typically softens prices + rents 12–24 months out; constrained supply supports both.
Investment metrics
- 1% rule
- 0.84% ✗
- Cap rate
- 7.15%
- Cash-on-cash
- 3.06%
- DSCR
- 1.14
- GRM
- 9.9
CMA / ARV
- ARV (median comp)
- $228,334
- List price
- $238,500
- Delta
- 4.45%
- Verdict
- FAIR
- Comps
- 20 within 1.0 mi
Show comp detail 12 sales within ~0.75 mi
| Address | Dist | Beds/Ba | Sqft | Sold | Price | $/sf | Match |
|---|---|---|---|---|---|---|---|
| 109 Flagg Dr | 0.18mi | 4/2.0 (+1) | 1,836 (-4%) | 2mo | $175,000 | $95 | 80 |
| 117 Martha Dr | 0.28mi | 4/2.0 (+1) | 1,842 (-3%) | 4mo | $260,000 | $141 | 73 |
| 305 Murray | 0.07mi | 3/2.0 | 1,682 (-12%) | 14mo | $220,000 | $131 | 66 |
| 2086 Highpoint Pl | 0.29mi | 4/2.0 (+1) | 1,988 (+4%) | 10mo | $367,900 | $185 | 65 |
| 3034 Sagefield Ln | 0.37mi | 4/3.0 (+1) | 1,976 (+4%) | 3mo | $345,000 | $175 | 65 |
| 105 Crawford Rd | 0.50mi | 3/2.0 | 1,909 (+0%) | 16mo | $381,800 | $200 | 63 |
| 703 Chandler Rd | 0.51mi | 3/2.0 | 1,976 (+4%) | 11mo | $405,080 | $205 | 60 |
| 705 Chandler Rd | 0.53mi | 3/2.0 | 1,995 (+5%) | 11mo | $408,975 | $205 | 58 |
| 115 Crawford | 0.50mi | 3/2.0 | 1,999 (+5%) | 16mo | $399,900 | $200 | 55 |
| 126 Platt Dr | 0.72mi | 3/2.0 | 1,728 (-9%) | 1mo | $165,000 | $95 | 50 |
| 114 Eastwood Dr | 0.35mi | 4/2.0 (+1) | 2,170 (+14%) | 8mo | $240,000 | $111 | 49 |
| 2843 Sunrise Pt | 0.37mi | 4/3.5 (+1) | 2,156 (+13%) | 8mo | $384,900 | $179 | 43 |
Match score weights: distance 35% · size 25% · config 20% · recency 20%. Top-matched comps best support the ARV.
Projected returns pro-forma
-3.0% appreciation · 3.0% rent growth · sell at horizon
- IRR
- -11.5%
- Equity multiple
- 0.58×
- Total profit
- $-27,917
- Equity at exit
- $35,561
- IRR
- -2.4%
- Equity multiple
- 0.84×
- Total profit
- $-10,808
- Equity at exit
- $20,621
Cash invested: $66,780 (down + closing). Projections, not guarantees.
Landlord ↔ Tenant lean methodology
- Overall (STATE)
- 90 Strongly Landlord-Friendly
- State Louisiana
- 90 Strongly Landlord-Friendly · R+12
- County
- — inherits STATE
- City
- — inherits STATE
ZIP-level market 71037
- Home prices YoY
- -27.8%
- Active inventory
- 335
- Price-to-rent
- 9.9×
Monthly cashflow live
- Estimated rent
- $2,006 medium interval (Pro) →
- Mortgage (P&I)
- −$1,251
- Tax from tax record
- −$65 /mo · $776/yr
- Insurance
- −$99
- HOA
- −$0
- Vacancy / Maint / Mgmt
- −$421
- Net cashflow
- $170
Break-even live
Sensitivity live
| Price | -10% $305 | -5% $238 | +0% $170 | +5% $103 | +10% $35 |
|---|---|---|---|---|---|
| Rent | -10% $12 | -5% $91 | +0% $170 | +5% $249 | +10% $329 |
| Rate | -1.0pp $290 | -0.5pp $231 | base $170 | +0.5pp $108 | +1.0pp $46 |
UW: 25.0% down · 7.5% · 30yr · 1.5% tax · 5.0% vac · 8.0% maint · 8.0% mgmt
Financing live
Cash to close
- Down payment
- $59,625
- Closing costs
- $7,155
- Reserves months
- —
- Total cash needed
- —
Loan-product check · same deal, 3 products live
Conventional
25% down · 7.5% · 30yr
- Down + closing
- —
- Monthly P&I
- —
- Monthly cashflow
- —
- DSCR
- —
- Eligible?
- —
Personal DTI + credit; lowest rate.
DSCR
20% down · 8.5% · 30yr
- Down + closing
- —
- Monthly P&I
- —
- Monthly cashflow
- —
- DSCR
- —
- Eligible?
- —
No personal income docs; deal must DSCR.
Hard money
10% down · 12.0% · 12mo
- Down + closing
- —
- Monthly P&I
- —
- Monthly cashflow
- —
- DSCR
- —
- Eligible?
- —
Short-term bridge; refi at stabilization.
Rent comps 1 comps
| Address | Beds | Baths | Sqft | Rent | $/sqft | DOM | Units | Dist |
|---|---|---|---|---|---|---|---|---|
| 2067 Highpoint Pl Haughton, LA | 4.0 | 2.0 | 1918 | $2,400 | $1.25 | 15d | 1 | 0.49mi |
Listing history 4 events
-
2026-05-31status $238,500 Pending 38 DOM
-
2026-05-30days on market $238,500 Active 38 DOM
-
2026-04-22$238,500 Active 658-char remark
-
2019-07-01soldstatus $180,000
ⓘ Source: listings_history table (triggers on properties + properties_extension) + one-shot
backfill from property_details.listing_events for pre-trigger history.
Tax reassessment forecast LA · Resets to sale price
- Current annual tax
- $776 · $65/mo
- Projected year-2 tax
- $1,312 · $109/mo
- Expected delta
- +$536/yr (+$45/mo · 69.0%)
ⓘ Screening estimate from a state-policy table — verify with the county assessor before closing.
Climate risk First Street
- Flood 4/10 Moderate FEMA zone X (unshaded) · 22% chance over 30 yrs
- Wildfire 3/10 Moderate
- Heat 7/10 Severe 7 d/yr ≥111°F today · 22 d/yr by 30 yrs out
- Wind 6/10 Major 60% chance of damaging wind over 30 yrs
- Air quality 2/10 Low 1 unhealthy d/yr today · 1 by 30 yrs out
Nearby sold comps map
Loading sold comps map…
Walkable amenities ~0.75 mi
Loading nearby amenities…
Taxation est. · year 1
- Rental income
- $24,076
- − Mortgage interest
- −$13,360
- − Property taxes
- −$776
- − Insurance
- −$1,192
- − Repairs & maintenance
- −$1,926
- − Management
- −$1,926
- − Depreciation
- −$6,938
- Taxable loss
- −$2,042
- Est. tax savings @ 24.0%
- +$490
- After-tax cash flow
- $2,533/yr
For passive investors: Depreciation is non-cash, so a rental often shows a tax loss while cash-flowing — sheltering income. Rental losses are passive: they offset passive income freely, and up to $25,000/yr can offset ordinary (W-2) income if you actively participate and your MAGI is under $100k (phasing out to $0 by $150k); unused losses carry forward. On sale, claimed depreciation is recaptured at up to 25%, and gains may owe capital-gains tax (a 1031 exchange can defer both). Figures are a year-1 estimate at your 24.0% rate — not tax advice; consult a CPA.
Schools (NCES district)
- District
- Bossier Parish
- NCES district ID
- 2200270
- Math proficiency
- 40% ▼ -32.00%
- Reading proficiency
- 47% ▼ -28.00%
- Median HH income
- $51,326
- Composite
- 37.5/100
- National rank
- #4402
- State rank
- #17 of 98 in LA
Livability — Eastwood
- Score
- 61/100
- State rank
- #241
- US rank
- #18386
Category grades
Schools grade is shown separately in the Schools card above.
Census & demographics
- Census place
- Eastwood, LA
- County
- Bossier Parish · 98,704 people
- Metro
- Shreveport-Bossier City, LA
- Population (ZIP)
- 21,192
- Household income
- $78,571
- Rent vs Own
- Severe rent burden
- 171.0
Population outlook (Bossier County) Hauer SSP2
- Today (2025)
- 143,247 people
- By 2030
- 151,802 · +6.0%
- By 2040
- 168,194 · +17.4%
- By 2050
- 183,533 · +28.1%
- By 2075
- 217,009 · +51.5%
- By 2100
- 230,091 · +60.6%
Race, ethnicity, and origin ACS 2023
- Neighborhood character
- Predominantly White (76%)
- Race & ethnicity
- White 76% Black 15% Hispanic / Latino 6% Two or more races 3%
- Hispanic origin (detail)
- Mexican 4%
- Common ancestry
- Lithuanian 2% Italian 1% Slovak 1%
- Foreign-born
- 3% · Canada
- Languages at home
- 95% English-only · Spanish 4%
Political lean MEDSL · Bossier
- 2024 margin
- Solid R (+43.3) · D 27.7% · R 71.0% · Other 1.3%
- 2008→2024 swing
- +0.3pp no change · 2008: -43.7pp · 2024: -43.3pp
- All cycles
- 2024: R+43.3 2020: R+41.0 2016: R+45.8 2012: R+45.4 2008: R+43.7
Not yet ingested
- Civics
- —
Market trends
- HPI YoY
- ▼ -59.53%
- Current HPI
- 154.5064
- Rent YoY
- —
- Metro
- Shreveport-Bossier City, LA
- State GDP YoY
- ▲ 3.29%
- F500 in state
- 10
Industry mix (Fortune 500 HQ in LA)
| Industry | F500 HQs | Revenue |
|---|---|---|
| Telecommunications | 2 | $23B |
|
||
| Utilities | 1 | $12B |
|
||
| Wholesale / Distribution | 1 | $5B |
|
||
| Advertising | 1 | $2B |
|
||
Price history
+32.5% since first listed3 events — show timeline
- 2026-05-31 Pending — NTREIS
- 2026-04-22 Listed $238,500 NTREIS
- 2019-07-01 Sold (Public Records) $180,000 Public Records
Property tax history
-0.7%/yrLatest (2025): $776 · +0.4% YoY. Source: county tax records.
Cash-flow waterfall
monthlySold comps — $/sqft
last 12 mo · ≤1 miLoading sold comps…