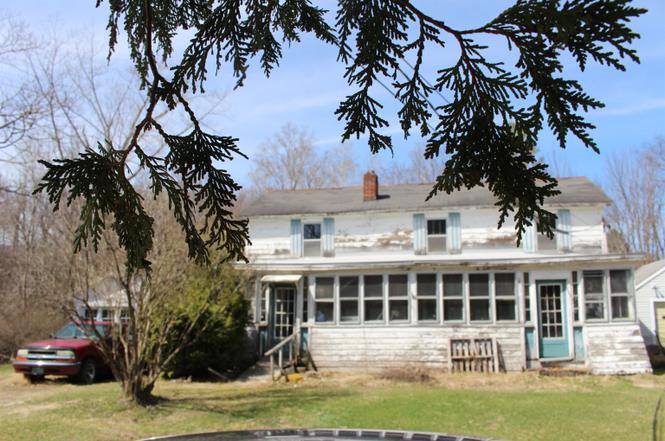
109 Evergreen Dr · Bennington, VT
Flood risk 4/10 · Minor
- FEMA flood zone
- X (unshaded)
- Chance of flooding over 30 yrs
- 0.2%
- Est. flood insurance / yr
- $473 – $860
Fire risk 2/10 · Minimal
- Est. fire insurance / yr
- $480 – $892
Heat risk 3/10 · Minor
- Hot days now (above 88°F)
- 7 days/yr
- Hot days in 30 yrs
- 16 days/yr
Wind risk 3/10 · Minor
- Chance of severe wind over 30 yrs
- 6.0%
Air-quality risk 2/10 · Minimal
- Unhealthy air days now
- 0 days/yr
- Unhealthy air days in 30 yrs
- 1 days/yr
Risk factors via First Street. Map © Google.
Why this score? — see what drove the B grade
The composite is a weighted blend of 9 inputs, each scored 0–100. Each bar is that input's sub-score; the figure is the points it added to the 100-point composite (weight × sub-score).
- Cash flow +30.0/30.0
- 1% rule +10.0/10.0
- DSCR +10.0/10.0
- ARV discount +7.5/15.0
- Schools +5.0/10.0
- Livability +3.2/5.0
- Rent growth +2.5/5.0
- Condition / age +2.5/5.0
- Appreciation +0.0/10.0
$90,000
🖨 Deal sheet 📄 Offer letter ✓ Due diligence
Listing remarks
House flippers and rehabbers rejoice: an excellent opportunity to put some sweat equity into this charming WWII-era gem at an accessible price. Last house on the right on a quiet dead-end road in a residential area of Bennington, this property boasts a lovely stream running along the northwest of the parcel, a cozy wood stove within, three bedrooms with more space adjoining, enclosed front porch, an ample front lawn and backyard, and a spacious attached 2-car garage with workshop space too! Bennington is a great location, with many amenities, and close proximity to Manchester outlets and Albany transportation. Opportunities like this are often quickly seized and quickly profited from; be
Key facts
- Workshop space
- Cozy wood stove
- Ample front lawn
Tags
Property features AI
Exterior
- Parking: 2-car garage
- Utilities: Septic system; Water available via driven point and public water at the street; Electric service with fuses; Cable internet available; Cable, LP/bottle gas, and phone service
- Home design: End unit; Historic/vintage character; Rehab needed; Existing construction; Shingle roof; Built in 1940
- Construction: Wood siding construction
- Exterior features: City lot, landscaped and level; In-town location in a neighborhood; Gravel driveway; White exterior
Interior
- Kitchen: Kitchen on the first level
- Bedrooms: Three bedrooms on the second level; Additional studio on the second level; Office/Study on the second level
- Bathrooms: 1 full bathroom
- Heating & cooling: Oil heating; Wood stove
- Interior features: 8 total rooms; Basement with interior and exterior access; unfinished with concrete and dirt floors, bulkhead, exterior and interior stairs
Neighborhood map
What this means for you Summary
Snapshot
- This is a 4-bed/1.0-bath single-family listed at $90k.
Deal economics
- At list price, monthly cash flow is $1k ($14k/yr) — positive.
- The deal already cash-flows at list — no discount required.
- Meets the 1% rule at list price ($2k rent vs $90k).
- Recommended offer: $79k (12.0% below list) — sets the bar for market timing.
- Cap rate 22.0% vs local median 5.4% in Bennington — top-decile yield for the area; either an underpriced asset or a hidden risk that comps aren't pricing in. Stress-test before assuming the spread holds.
Location & tenants
- Location reads 64/100 on livability (#63 in VT) — a middle-class / working-renter tenant base. Strengths: housing A+, health & safety A+, cost of living A; Watch: employment C-, crime D, schools F.
- Market conditions: 65 active listings in the ZIP; 59 units permitted in Bennington County in 2024 (0 in 5+ unit buildings).
- At $2,309/mo this rent would consume 46% of the median local household income ($60k/yr) (locally 982% of renters already pay >50% of income on rent) — very limited rent-growth headroom before tenants either downsize or default.
Forward outlook
- Local home prices are declining (-3.0%/yr); year-one equity from $622 of loan paydown is wiped out by about $3k of value loss. Plan a longer hold.
- Bennington County population projected at -23% by 2050 — secular population decline; favor cash flow + early exit over multi-decade hold.
- At projected returns (-3.0% appreciation + 3.0% rent growth), your $25k cash investment doubles in ~3 years — after that, you're playing with house money.
Negotiation context
- It's been on market 148 days — a 12% lower offer ($79k) is reasonable based on typical stale-listing flexibility.
Risks & watch-outs
- Watch-outs: built in 1940 — expect roof / HVAC / electrical / plumbing capex.
Questions for the listing agent
- It's been on market 148 days. Have you received any prior offers? Is the seller open to a 12% concession, seller financing, or rate buy-down credit?
- Built in 1940 — when were the roof, HVAC, electrical panel, plumbing, and water heater last replaced?
- Why hasn't it sold? Are there any deal-killer items the seller is aware of (foundation, flood, title, zoning, code violations)?
- Is there a deadline driving the sale (1031 exchange, divorce, estate, relocation)? That informs how much negotiation room exists.
- Schools are F-rated, which usually means shorter tenancies and higher turnover. Who's the typical renter profile here, and what's been the actual vacancy rate?
- Crime grade is D in this area — have there been break-ins, vandalism, or insurance claims at this property in the last 3 years? What carrier currently insures it and at what premium?
- What's the average days-on-market for RENTAL listings here right now (not sales)? A rising rental-DOM trend means longer vacancies and softer asking-rent achievability than the comps imply.
- What's the recent tenant-quality profile in this submarket — average credit score on applications, eviction rate, late-payment / NSF rate, and stable-employment percentage? A property-management company in the area should have these aggregated.
- How much new for-sale + rental construction is in the pipeline within 1–3 miles? Heavy new supply typically softens prices + rents 12–24 months out; constrained supply supports both.
Investment metrics
- 1% rule
- 2.57% ✓
- Cap rate
- 22.03%
- Cash-on-cash
- 56.19%
- DSCR
- 3.50
- GRM
- 3.2
CMA / ARV
- ARV (on-the-fly)
- $230,724
- Comps found
- 12
Show comp detail 12 sales within ~0.75 mi
| Address | Dist | Beds/Ba | Sqft | Sold | Price | $/sf | Match |
|---|---|---|---|---|---|---|---|
| 103 Evergreen Dr | 0.06mi | 3/1.5 (-1) | 1,401 (-7%) | 17mo | $195,000 | $139 | 65 |
| 755 Main St | 0.59mi | 3/1.5 (-1) | 1,485 (-2%) | 5mo | $130,000 | $88 | 59 |
| 30 Harbour Rd | 0.39mi | 3/1.0 (-1) | 1,608 (+7%) | 11mo | $275,000 | $171 | 57 |
| 100 Webb St | 0.46mi | 3/1.0 (-1) | 1,416 (-6%) | 9mo | $190,000 | $134 | 56 |
| 940 Gage St | 0.69mi | 3/1.5 (-1) | 1,570 (+4%) | 2mo | $260,000 | $166 | 52 |
| 150 Fillmore St | 0.53mi | 3/2.0 (-1) | 1,404 (-7%) | 4mo | $285,000 | $203 | 51 |
| 174 Morgan St | 0.35mi | 3/1.5 (-1) | 1,687 (+12%) | 8mo | $304,500 | $180 | 50 |
| 130 Beech St | 0.52mi | 3/2.0 (-1) | 1,416 (-6%) | 11mo | $217,000 | $153 | 47 |
| 807 Main St | 0.59mi | 3/1.5 (-1) | 1,444 (-4%) | 18mo | $150,000 | $104 | 44 |
| 116 Morgan St | 0.59mi | 3/2.0 (-1) | 1,680 (+11%) | 4mo | $206,000 | $123 | 41 |
| 277 Union St | 0.66mi | 3/2.0 (-1) | 1,422 (-6%) | 12mo | $265,000 | $186 | 40 |
| 107 Coolidge Ave | 0.71mi | 4/2.0 | 1,702 (+13%) | 4mo | $225,000 | $132 | 38 |
Match score weights: distance 35% · size 25% · config 20% · recency 20%. Top-matched comps best support the ARV.
Projected returns pro-forma
-3.0% appreciation · 3.0% rent growth · sell at horizon
- IRR
- 54.6%
- Equity multiple
- 3.41×
- Total profit
- $60,625
- Equity at exit
- $13,419
- IRR
- 59.7%
- Equity multiple
- 6.94×
- Total profit
- $149,769
- Equity at exit
- $7,782
Cash invested: $25,200 (down + closing). Projections, not guarantees.
Landlord ↔ Tenant lean methodology
- Overall (STATE)
- 41 Moderately Tenant-Leaning
- State Vermont
- 41 Moderately Tenant-Leaning · D+15
- County
- — inherits STATE
- City
- — inherits STATE
ZIP-level market 05201
- Home prices YoY
- -19.3%
- Active inventory
- 65
- Price-to-rent
- 3.2×
Monthly cashflow live
- Estimated rent
- $2,309 medium interval (Pro) →
- Mortgage (P&I)
- −$472
- Tax from tax record
- −$135 /mo · $1,616/yr
- Insurance
- −$38
- HOA
- −$0
- Vacancy / Maint / Mgmt
- −$485
- Net cashflow
- $1,180
Break-even live
UW: 25.0% down · 7.5% · 30yr · 1.5% tax · 5.0% vac · 8.0% maint · 8.0% mgmt
Financing live
Cash to close
- Down payment
- $22,500
- Closing costs
- $2,700
- Reserves months
- —
- Total cash needed
- —
Loan-product check · same deal, 3 products live
Conventional
25% down · 7.5% · 30yr
- Down + closing
- —
- Monthly P&I
- —
- Monthly cashflow
- —
- DSCR
- —
- Eligible?
- —
Personal DTI + credit; lowest rate.
DSCR
20% down · 8.5% · 30yr
- Down + closing
- —
- Monthly P&I
- —
- Monthly cashflow
- —
- DSCR
- —
- Eligible?
- —
No personal income docs; deal must DSCR.
Hard money
10% down · 12.0% · 12mo
- Down + closing
- —
- Monthly P&I
- —
- Monthly cashflow
- —
- DSCR
- —
- Eligible?
- —
Short-term bridge; refi at stabilization.
Listing history 19 events
-
2026-06-19days on market $90,000 Active 148 DOM
-
2026-06-18days on market $90,000 Active 147 DOM
-
2026-06-17days on market $90,000 Active 146 DOM
-
2026-06-16days on market $90,000 Active 145 DOM
-
2026-06-15days on market $90,000 Active 144 DOM
-
2026-06-14days on market $90,000 Active 142 DOM
-
2026-06-12pricedays on market $90,000 Active 141 DOM
-
2026-06-09days on market $100,000 Active 138 DOM
-
2026-06-08days on market $100,000 Active 137 DOM
-
2026-06-07days on market $100,000 Active 136 DOM
-
2026-06-07days on market $100,000 Active 135 DOM
-
2026-06-04days on market $100,000 Active 132 DOM
-
2026-06-02days on market $100,000 Active 131 DOM
-
2026-06-01days on market $100,000 Active 130 DOM
-
2026-05-31days on market $100,000 Active 129 DOM
-
2026-05-31days on market $100,000 Active 128 DOM
-
2026-02-05price $100,000
-
2026-01-23$125,000 Active
-
2025-10-02price $135,000
ⓘ Source: listings_history table (triggers on properties + properties_extension) + one-shot
backfill from property_details.listing_events for pre-trigger history.
Tax reassessment forecast VT · Partial reset (capped growth)
- Current annual tax
- $1,616 · $135/mo
- Projected year-2 tax
- $1,663 · $139/mo
- Expected delta
- +$47/yr (+$4/mo · 2.9%)
ⓘ Screening estimate from a state-policy table — verify with the county assessor before closing.
Climate risk First Street
- Flood 4/10 Moderate FEMA zone X (unshaded) · 20% chance over 30 yrs
- Wildfire 2/10 Low
- Heat 3/10 Moderate 7 d/yr ≥88°F today · 16 d/yr by 30 yrs out
- Wind 3/10 Moderate 6% chance of damaging wind over 30 yrs
- Air quality 2/10 Low 0 unhealthy d/yr today · 1 by 30 yrs out
Nearby sold comps map
Loading sold comps map…
Walkable amenities ~0.75 mi
Loading nearby amenities…
Taxation est. · year 1
- Rental income
- $27,709
- − Mortgage interest
- −$5,041
- − Property taxes
- −$1,616
- − Insurance
- −$450
- − Repairs & maintenance
- −$2,217
- − Management
- −$2,217
- − Depreciation
- −$2,618
- Taxable income
- $13,551
- Est. tax owed @ 24.0%
- −$3,252
- After-tax cash flow
- $10,909/yr
For passive investors: Depreciation is non-cash, so a rental often shows a tax loss while cash-flowing — sheltering income. Rental losses are passive: they offset passive income freely, and up to $25,000/yr can offset ordinary (W-2) income if you actively participate and your MAGI is under $100k (phasing out to $0 by $150k); unused losses carry forward. On sale, claimed depreciation is recaptured at up to 25%, and gains may owe capital-gains tax (a 1031 exchange can defer both). Figures are a year-1 estimate at your 24.0% rate — not tax advice; consult a CPA.
Schools (NCES district)
No district data.
Livability — Bennington
- Score
- 64/100
- State rank
- #63
- US rank
- #14446
Category grades
Schools grade is shown separately in the Schools card above.
Census & demographics
- Census place
- Bennington, VT
- County
- Bennington County · 14,998 people
- City population
- 14,998
- Metro
- Bennington, VT
- Population (ZIP)
- 14,998
- Household income
- $59,798
- Rent vs Own
- Severe rent burden
- 982.0
Population outlook (Bennington County) Hauer SSP2
- Today (2025)
- 34,407 people
- By 2030
- 32,975 · -4.2%
- By 2040
- 29,711 · -13.6%
- By 2050
- 26,638 · -22.6%
- By 2075
- 21,318 · -38.0%
- By 2100
- 16,086 · -53.2%
Race, ethnicity, and origin ACS 2023
- Neighborhood character
- Predominantly White (92%)
- Race & ethnicity
- White 92% Two or more races 4% Hispanic / Latino 3%
- Common ancestry
- Lithuanian 10% Slovak 7% Romanian 3%
- Foreign-born
- 2% · Canada
- Languages at home
- 96% English-only · Spanish 2% Other Indo-European 1%
Political lean MEDSL · Bennington
- 2024 margin
- Strong D (+22.5) · D 60.0% · R 37.5% · Other 2.6%
- 2008→2024 swing
- -10.9pp toward R · 2008: 33.4pp · 2024: 22.5pp
- All cycles
- 2024: D+22.5 2020: D+27.3 2016: D+22.1 2012: D+33.3 2008: D+33.4
Not yet ingested
- Civics
- —
Market trends
- HPI YoY
- ▼ -60.78%
- Current HPI
- 254.5149
- Rent YoY
- —
- Metro
- Bennington, VT
- State GDP YoY
- —
- F500 in state
- 0
Price history
-25.9% since first listed3 events — show timeline
- 2026-02-05 Price Changed $100,000 PrimeMLS
- 2026-01-23 Listed $125,000 PrimeMLS
- 2025-10-02 Price Changed $135,000 PrimeMLS
Property tax history
-3.0%/yrLatest (2024): $1,616 · +38.5% YoY. Source: county tax records.
Cash-flow waterfall
monthlySold comps — $/sqft
last 12 mo · ≤1 miLoading sold comps…