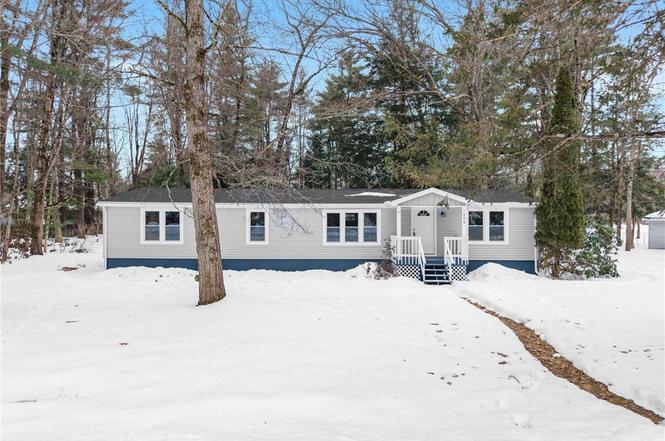
808 Mcclanathan Ave · Sylvan Beach, NY
Flood risk 1/10 · Minimal
- FEMA flood zone
- X (unshaded)
- Chance of flooding over 30 yrs
- 0.0%
- Est. flood insurance / yr
- $507 – $1,088
Fire risk 3/10 · Minor
- Est. fire insurance / yr
- $691 – $1,283
Heat risk 3/10 · Minor
- Hot days now (above 94°F)
- 7 days/yr
- Hot days in 30 yrs
- 16 days/yr
Wind risk 1/10 · Minimal
- Chance of severe wind over 30 yrs
- 0.0%
Air-quality risk 2/10 · Minimal
- Unhealthy air days now
- 0 days/yr
- Unhealthy air days in 30 yrs
- 1 days/yr
Risk factors via First Street. Map © Google.
Why this score? — see what drove the F grade
The composite is a weighted blend of 9 inputs, each scored 0–100. Each bar is that input's sub-score; the figure is the points it added to the 100-point composite (weight × sub-score).
- Appreciation +10.0/10.0
- ARV discount +7.5/15.0
- Cash flow +4.6/30.0
- Schools +3.5/10.0
- Livability +2.8/5.0
- Rent growth +2.5/5.0
- Condition / age +2.5/5.0
- 1% rule +0.7/10.0
- DSCR +0.0/10.0
$219,900
🖨 Deal sheet (PDF) 📄 Offer letter ✓ Due diligence
Listing remarks MLS
HUD deal -- Fair Condition
Key facts
- Spacious back deck
- Wooded lot
- Storage shed
Tags
Neighborhood map
What this means for you Summary
Snapshot
- This is a 3-bed/2.5-bath manufactured listed at $220k.
Deal economics
- At list price, monthly cash flow is $-556 ($-7k/yr) — negative.
- To cash-flow at today's rent, offer at most $122k (44.7% below list).
- To meet the 1% rule (rent ≥ 1% of price), the offer needs to be $124k (43.5% below list).
- Recommended offer: $122k (44.7% below list) — sets the bar for cash-flow.
- Cap rate 3.3% vs local median 2.3% in Sylvan Beach — top-decile yield for the area; either an underpriced asset or a hidden risk that comps aren't pricing in. Stress-test before assuming the spread holds.
Location & tenants
- Location reads 56/100 on livability (#1,110 in NY) — a working-class tenant base; expect higher turnover. Strengths: cost of living A+, housing A+; Watch: employment D+, crime F, amenities F.
- Camden Central School District (rural): math 34% / reading 48% proficiency, ranked #504 of 590 in NY (top 85%) — families likely to look elsewhere, expect single-tenant / working-renter base with shorter leases.
- Zoned schools: Mcconnellsville Elementary School (math 22% / reading 57%, grade F, #1,444 of 2,108 statewide, top 71%, 260 students, 41% FRL); Camden Middle School (math 17% / reading 42%, grade F, #550 of 729 statewide, top 77%, 580 students, 48% FRL); Camden Senior High School (math 92% / reading 75%, grade A, #409 of 1,100 statewide, top 39%, 620 students, 45% FRL) — zoned schools at 45% FRL track the district average.
- Market conditions: 34 active listings in the ZIP; 204 units permitted in Oneida County in 2024 (68 in 5+ unit buildings).
Forward outlook
- In year one you build about $24k of equity ($2k loan paydown + $22k appreciation (10.0% local appreciation)).
- Oneida County population projected at -12% by 2050 — secular population decline; favor cash flow + early exit over multi-decade hold.
- By year 2, paydown + projected appreciation supports a ~$38k cash-out refi (75% LTV) — recoverable capital for the next deal without selling this one.
Negotiation context
- It's been on market 36 days — a 3% lower offer ($213k) is reasonable based on typical stale-listing flexibility.
- 2 sale attempts since 18y ago with the ask held roughly flat each time — persistent listings suggest the price (not the market) is what's stuck; bring a comps-based counter.
- Current owner paid $68k; list at $220k implies a 221% gain — meaningful room to come down on a strong offer.
Questions for the listing agent
- What do current leases actually rent for vs. the listed asking? Can we see a recent rent roll and the last 12 months of T-12 income?
- It's been on market 36 days. Have you received any prior offers? Is the seller open to a 45% concession, seller financing, or rate buy-down credit?
- Is there a deadline driving the sale (1031 exchange, divorce, estate, relocation)? That informs how much negotiation room exists.
- Schools are F-rated, which usually means shorter tenancies and higher turnover. Who's the typical renter profile here, and what's been the actual vacancy rate?
- Crime grade is F in this area — have there been break-ins, vandalism, or insurance claims at this property in the last 3 years? What carrier currently insures it and at what premium?
- The area grade is low — what's the realistic commute time and amenity access for the typical tenant pool here? Any planned neighborhood developments (good or bad) we should know about?
- What's the average days-on-market for RENTAL listings here right now (not sales)? A rising rental-DOM trend means longer vacancies and softer asking-rent achievability than the comps imply.
- What's the recent tenant-quality profile in this submarket — average credit score on applications, eviction rate, late-payment / NSF rate, and stable-employment percentage? A property-management company in the area should have these aggregated.
- How much new for-sale + rental construction is in the pipeline within 1–3 miles? Heavy new supply typically softens prices + rents 12–24 months out; constrained supply supports both.
Investment metrics
- 1% rule
- 0.57% ✗
- Cap rate
- 3.26%
- Cash-on-cash
- -10.84%
- DSCR
- 0.52
- GRM
- 14.7
CMA / ARV
No comps found within radius.
Projected returns pro-forma
10.0% appreciation · 3.0% rent growth · sell at horizon
- IRR
- 16.7%
- Equity multiple
- 2.37×
- Total profit
- $84,374
- Equity at exit
- $198,103
- IRR
- 15.9%
- Equity multiple
- 5.49×
- Total profit
- $276,381
- Equity at exit
- $427,217
Cash invested: $61,572 (down + closing). Projections, not guarantees.
Landlord ↔ Tenant lean methodology
- Overall (STATE)
- 15 Strongly Tenant-Friendly
- State New York
- 15 Strongly Tenant-Friendly · D+10
- County
- — inherits STATE
- City
- — inherits STATE
ZIP-level market 13308
- Home prices YoY
- 28.6%
- Active inventory
- 34
- Price-to-rent
- 14.7×
Monthly cashflow live
- Estimated rent
- $1,243 medium interval (Pro) →
- Mortgage (P&I)
- −$1,153
- Tax from tax record
- −$294 /mo · $3,524/yr
- Insurance
- −$92
- HOA
- −$0
- Lot rent leased land?
- −$0
- Vacancy / Maint / Mgmt
- −$261
- Net cashflow
- $-556
Break-even live
Sensitivity live
| Price | -10% $-432 | -5% $-494 | +0% $-556 | +5% $-618 | +10% $-681 |
|---|---|---|---|---|---|
| Rent | -10% $-654 | -5% $-605 | +0% $-556 | +5% $-507 | +10% $-458 |
| Rate | -1.0pp $-445 | -0.5pp $-500 | base $-556 | +0.5pp $-613 | +1.0pp $-671 |
UW: 25.0% down · 7.5% · 30yr · 1.5% tax · 5.0% vac · 8.0% maint · 8.0% mgmt
Financing live
Cash to close
- Down payment
- $54,975
- Closing costs
- $6,597
- Reserves months
- —
- Total cash needed
- —
Loan-product check · same deal, 3 products live
Conventional
25% down · 7.5% · 30yr
- Down + closing
- —
- Monthly P&I
- —
- Monthly cashflow
- —
- DSCR
- —
- Eligible?
- —
Personal DTI + credit; lowest rate.
DSCR
20% down · 8.5% · 30yr
- Down + closing
- —
- Monthly P&I
- —
- Monthly cashflow
- —
- DSCR
- —
- Eligible?
- —
No personal income docs; deal must DSCR.
Hard money
10% down · 12.0% · 12mo
- Down + closing
- —
- Monthly P&I
- —
- Monthly cashflow
- —
- DSCR
- —
- Eligible?
- —
Short-term bridge; refi at stabilization.
Listing history 7 events
-
2026-04-10status Pending
-
2026-03-30historical Active Under Contract
-
2026-03-05$219,900 Active
-
2025-06-26soldstatus $68,500
-
2008-05-01soldstatus $42,000 26-char remark
Show marketing remark (26 chars)
HUD deal -- Fair Condition
-
2008-02-29$42,000 26-char remark
Show marketing remark (26 chars)
HUD deal -- Fair Condition
-
1995-08-25soldstatus $52,500
ⓘ Source: listings_history table (triggers on properties + properties_extension) + one-shot
backfill from property_details.listing_events for pre-trigger history.
Tax reassessment forecast NY · Partial reset (capped growth)
- Current annual tax
- $3,524 · $294/mo
- Projected year-2 tax
- $3,620 · $302/mo
- Expected delta
- +$96/yr (+$8/mo · 2.7%)
ⓘ Screening estimate from a state-policy table — verify with the county assessor before closing.
Climate risk First Street
- Flood 1/10 Low FEMA zone X (unshaded) · 0% chance over 30 yrs
- Wildfire 3/10 Moderate
- Heat 3/10 Moderate 7 d/yr ≥94°F today · 16 d/yr by 30 yrs out
- Wind 1/10 Low 0% chance of damaging wind over 30 yrs
- Air quality 2/10 Low 0 unhealthy d/yr today · 1 by 30 yrs out
Nearby sold comps map
Loading sold comps map…
Walkable amenities ~0.75 mi
Loading nearby amenities…
Taxation est. · year 1
- Rental income
- $14,921
- − Mortgage interest
- −$12,318
- − Property taxes
- −$3,524
- − Insurance
- −$1,100
- − Repairs & maintenance
- −$1,194
- − Management
- −$1,194
- − Depreciation
- −$6,397
- Taxable loss
- −$10,804
- Est. tax savings @ 24.0%
- +$2,593
- After-tax cash flow
- $-4,080/yr
For passive investors: Depreciation is non-cash, so a rental often shows a tax loss while cash-flowing — sheltering income. Rental losses are passive: they offset passive income freely, and up to $25,000/yr can offset ordinary (W-2) income if you actively participate and your MAGI is under $100k (phasing out to $0 by $150k); unused losses carry forward. On sale, claimed depreciation is recaptured at up to 25%, and gains may owe capital-gains tax (a 1031 exchange can defer both). Figures are a year-1 estimate at your 24.0% rate — not tax advice; consult a CPA.
Schools (NCES district)
- District
- Camden Central School District
- NCES district ID
- 3606240
- Math proficiency
- 34% ▼ -14.00%
- Reading proficiency
- 48% ▲ 1.00%
- Median HH income
- $48,686
- Composite
- 35.15/100
- National rank
- #5008
- State rank
- #504 of 590 in NY
Livability — Sylvan Beach
- Score
- 56/100
- State rank
- #1110
- US rank
- #22755
Category grades
Schools grade is shown separately in the Schools card above.
Census & demographics
- Census place
- Sylvan Beach, NY
- City population
- 547
- Population (ZIP)
- 4,239
Population outlook (Oneida County) Hauer SSP2
- Today (2025)
- 225,223 people
- By 2030
- 220,384 · -2.1%
- By 2040
- 209,071 · -7.2%
- By 2050
- 197,920 · -12.1%
- By 2075
- 175,541 · -22.1%
- By 2100
- 148,491 · -34.1%
Race, ethnicity, and origin ACS 2023
- Neighborhood character
- Predominantly White (93%)
- Race & ethnicity
- White 93% Two or more races 5% Hispanic / Latino 4% Asian 1%
- Common ancestry
- Romanian 8% Lithuanian 3% Subsaharan African 2%
- Foreign-born
- 2% · South Korea, Canada
- Languages at home
- 98% English-only · Korean 1%
Political lean MEDSL · Oneida
- 2024 margin
- Strong R (+21.3) · D 39.4% · R 60.6%
- 2008→2024 swing
- -15.2pp toward R · 2008: -6.1pp · 2024: -21.3pp
- All cycles
- 2024: R+21.3 2020: R+15.5 2016: R+21.1 2012: R+5.3 2008: R+6.1
Not yet ingested
- Civics
- —
Market trends
- HPI YoY
- ▲ 73.19%
- Current HPI
- 329.3091
- Rent YoY
- —
- Metro
- —
- State GDP YoY
- ▲ 2.60%
- F500 in state
- 92
Industry mix (Fortune 500 HQ in NY)
| Industry | F500 HQs | Revenue |
|---|---|---|
| Financial Services | 10 | $950B |
|
||
| Consumer Goods | 9 | $162B |
|
||
| Insurance | 4 | $225B |
|
||
| Telecommunications | 2 | $144B |
|
||
| Pharmaceuticals | 2 | $112B |
|
||
| Media / Entertainment | 2 | $69B |
|
||
Price history
+318.9% since first listed7 events — show timeline
- 2026-04-10 Pending — CNYIS
- 2026-03-30 Contingent — CNYIS
- 2026-03-05 Listed $219,900 CNYIS
- 2025-06-26 Sold (Public Records) $68,500 Public Records
- 2008-05-01 Sold (MLS) $42,000 Global MLS
- 2008-02-29 Listed $42,000 Global MLS
- 1995-08-25 Sold (Public Records) $52,500 Public Records
Property tax history
+3.4%/yrLatest (2025): $3,524 · +4.8% YoY. Source: county tax records.
Cash-flow waterfall
monthlySold comps — $/sqft
last 12 mo · ≤1 miLoading sold comps…