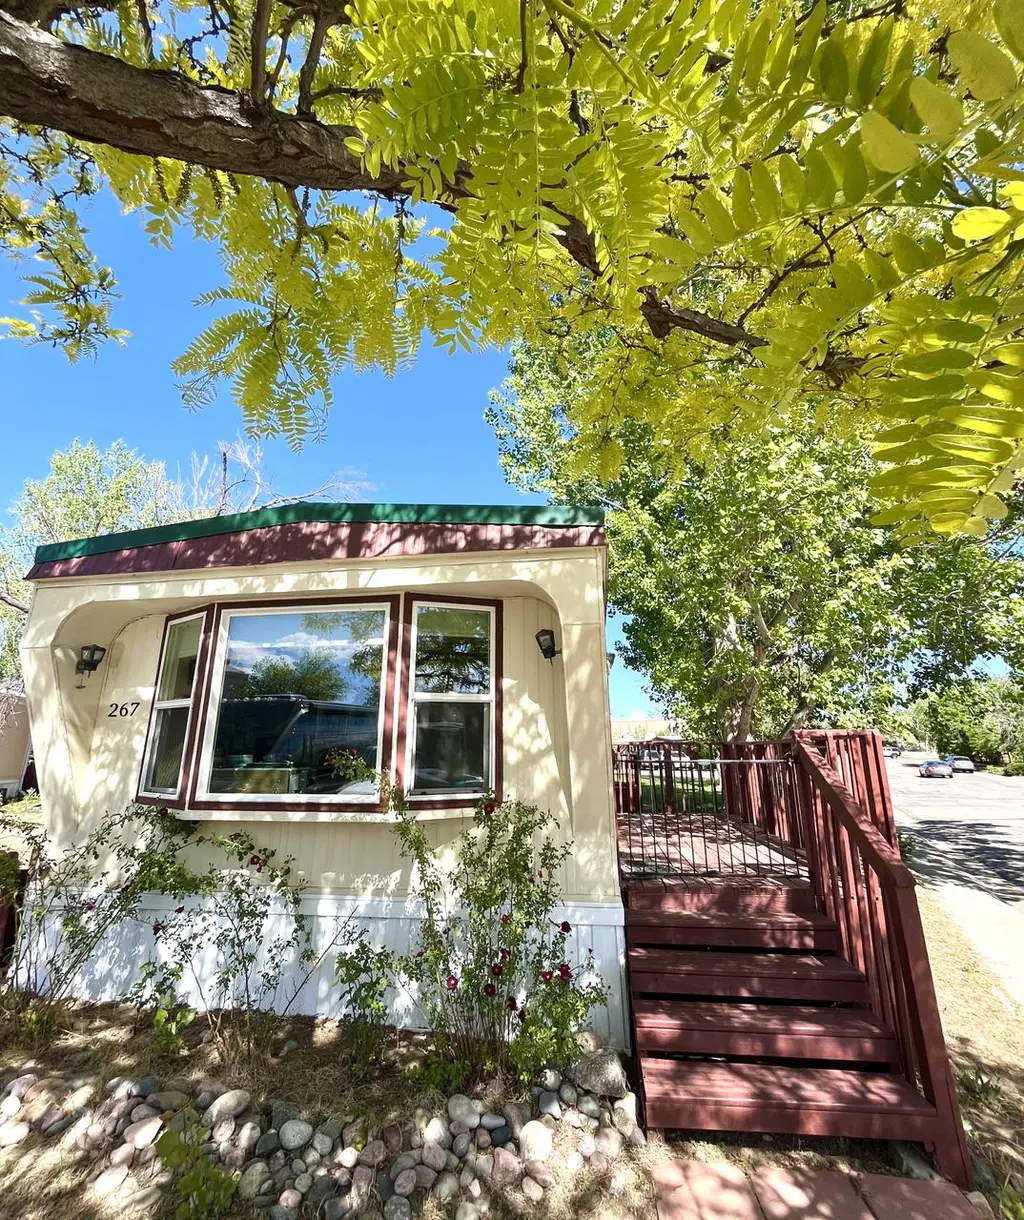
5000 Butte St Lot 267 · Boulder, CO
Flood risk 1/10 · Minimal
- FEMA flood zone
- X (unshaded)
- Chance of flooding over 30 yrs
- 0.0%
- Est. flood insurance / yr
- $507 – $1,088
Fire risk 6/10 · Moderate
- Est. fire insurance / yr
- $939 – $1,743
Heat risk 3/10 · Minor
- Hot days now (above 92°F)
- 7 days/yr
- Hot days in 30 yrs
- 18 days/yr
Wind risk 1/10 · Minimal
- Chance of severe wind over 30 yrs
- —
Air-quality risk 4/10 · Minor
- Unhealthy air days now
- 4 days/yr
- Unhealthy air days in 30 yrs
- 5 days/yr
Risk factors via First Street. Map © Google.
Why this score? — see what drove the B grade
The composite is a weighted blend of 9 inputs, each scored 0–100. Each bar is that input's sub-score; the figure is the points it added to the 100-point composite (weight × sub-score).
- Cash flow +30.0/30.0
- 1% rule +10.0/10.0
- DSCR +10.0/10.0
- ARV discount +7.5/15.0
- Schools +5.1/10.0
- Livability +3.9/5.0
- Condition / age +2.5/5.0
- Rent growth +1.9/5.0
- Appreciation +0.0/10.0
$84,000
🖨 Deal sheet 📄 Offer letter ✓ Due diligence
Listing remarks
Welcome to your next home! This well-maintained 2-bedroom, 1-bath mobile home features new flooring, an abundance of natural light through a large bay window, and updated appliances. Enjoy outdoor living with mountain views, two porches (one covered), a concrete patio, private two-car driveway, large storage shed, and a spacious fenced yard with garden beds ready for planting. This large and unique lot has a neighbor on only one side! You just cannot find something like this in an MHP in Boulder at this price! Located in the most tranquil MHP community in Boulder with convenient access to nearby amenities, shopping, bike paths and parks, this home is perfect for first-time buyers, downsize
Key facts
- Updated appliances
- Concrete patio
- Two porches
Tags
Property features AI
Exterior
- Home design: Built in 1973
- Construction: Built in 1973
- Exterior features: Located in the Vista Village subdivision
Interior
- Kitchen: Dishwasher; Microwave; Refrigerator
- Interior features: Deck; Patio; Porch
Neighborhood map
What this means for you Summary
Snapshot
- This is a 2-bed/1.0-bath manufactured listed at $84k.
Deal economics
- At list price, monthly cash flow is $1k ($17k/yr) — positive.
- The deal already cash-flows at list — no discount required.
- Meets the 1% rule at list price ($3k rent vs $84k).
- Recommended offer: $83k (1.5% below list) — sets the bar for market timing.
- Cap rate 26.5% vs local median 1.7% in Boulder — top-decile yield for the area; either an underpriced asset or a hidden risk that comps aren't pricing in. Stress-test before assuming the spread holds.
Location & tenants
- Location reads 77/100 on livability (#24 in CO, #2,958 nationally) — a middle-class / working-renter tenant base. Strengths: amenities A+, commute A+, health & safety A+; Watch: crime D+, cost of living F.
- Boulder Valley School District No. Re2 (urban): math 49% / reading 67% proficiency, ranked #6 of 86 in CO (top 7%) — acceptable for families but not a draw, mixed tenant base, ~2y average lease; only 16% free/reduced lunch — higher-income household profile.
- Market conditions: Rents soft (-2.3%/yr); 185 active listings in the ZIP; 26 comparable units currently listed for rent nearby; rentals leasing fast (median 14d on market — plan ~1-2 weeks tenant-placement turnaround); solid renter incomes; 1,688 units permitted in Boulder County in 2024 (1,136 in 5+ unit buildings).
- This rent runs 32% of the median local income ($95k/yr) — at the standard rent-burdened threshold; future hikes will face affordability resistance.
Forward outlook
- Local home prices are declining (-3.0%/yr); year-one equity from $581 of loan paydown is wiped out by about $3k of value loss. Plan a longer hold.
- Boulder County population projected at +40% by 2050 — long-run rental-demand tailwind backs the buy-and-hold thesis.
- At projected returns (-3.0% appreciation + 0.0% rent growth), your $24k cash investment doubles in ~2 years — after that, you're playing with house money.
Negotiation context
- It's been on market 28 days — a 2% lower offer ($83k) is reasonable based on typical stale-listing flexibility.
- Current owner paid $12k; list at $84k implies a 600% gain — meaningful room to come down on a strong offer.
Risks & watch-outs
- Climate carrying-cost: major wildfire risk — expect insurance premiums to compound above CPI over the hold.
Questions for the listing agent
- Built in 1973 — when were the roof, HVAC, electrical panel, plumbing, and water heater last replaced?
- Is there a deadline driving the sale (1031 exchange, divorce, estate, relocation)? That informs how much negotiation room exists.
- Schools are B-rated — typically a magnet for longer-tenancy family renters. What's the average tenant stay here, and is there a school-zone premium baked into asking?
- Crime grade is D in this area — have there been break-ins, vandalism, or insurance claims at this property in the last 3 years? What carrier currently insures it and at what premium?
- What's the average days-on-market for RENTAL listings here right now (not sales)? A rising rental-DOM trend means longer vacancies and softer asking-rent achievability than the comps imply.
- What's the recent tenant-quality profile in this submarket — average credit score on applications, eviction rate, late-payment / NSF rate, and stable-employment percentage? A property-management company in the area should have these aggregated.
- How much new for-sale + rental construction is in the pipeline within 1–3 miles? Heavy new supply typically softens prices + rents 12–24 months out; constrained supply supports both.
Investment metrics
- 1% rule
- 3.00% ✓
- Cap rate
- 26.45%
- Cash-on-cash
- 72.00%
- DSCR
- 4.20
- GRM
- 2.8
CMA / ARV
- ARV (on-the-fly)
- $44,688
- Comps found
- 1
Show comp detail 1 sale within ~0.75 mi
| Address | Dist | Beds/Ba | Sqft | Sold | Price | $/sf | Match |
|---|---|---|---|---|---|---|---|
| 5505 Valmont Rd #208 | 0.61mi | 2/1.0 | 720 (-10%) | 23mo | $40,000 | $56 | 36 |
Match score weights: distance 35% · size 25% · config 20% · recency 20%. Top-matched comps best support the ARV.
Projected returns pro-forma
-3.0% appreciation · 0.0% rent growth · sell at horizon
- IRR
- 68.2%
- Equity multiple
- 3.93×
- Total profit
- $68,922
- Equity at exit
- $12,525
- IRR
- 71.5%
- Equity multiple
- 7.27×
- Total profit
- $147,356
- Equity at exit
- $7,263
Cash invested: $23,520 (down + closing). Projections, not guarantees.
Landlord ↔ Tenant lean methodology
- Overall (STATE)
- 38 Tenant-Leaning
- State Colorado
- 38 Tenant-Leaning · D+4
- County
- — inherits STATE
- City
- — inherits STATE
ZIP-level market 80301
- Rents YoY
- -2.3%
- Active inventory
- 185
- Price-to-rent
- 2.8×
Monthly cashflow live
- Estimated rent
- $2,521 high interval (Pro) →
- Mortgage (P&I)
- −$441
- Tax est. 1.5%
- −$105 /mo · $1,260/yr
- Insurance
- −$35
- HOA
- −$0
- Vacancy / Maint / Mgmt
- −$529
- Net cashflow
- $1,411
Break-even live
UW: 25.0% down · 7.5% · 30yr · 1.5% tax · 5.0% vac · 8.0% maint · 8.0% mgmt
Financing live
Cash to close
- Down payment
- $21,000
- Closing costs
- $2,520
- Reserves months
- —
- Total cash needed
- —
Loan-product check · same deal, 3 products live
Conventional
25% down · 7.5% · 30yr
- Down + closing
- —
- Monthly P&I
- —
- Monthly cashflow
- —
- DSCR
- —
- Eligible?
- —
Personal DTI + credit; lowest rate.
DSCR
20% down · 8.5% · 30yr
- Down + closing
- —
- Monthly P&I
- —
- Monthly cashflow
- —
- DSCR
- —
- Eligible?
- —
No personal income docs; deal must DSCR.
Hard money
10% down · 12.0% · 12mo
- Down + closing
- —
- Monthly P&I
- —
- Monthly cashflow
- —
- DSCR
- —
- Eligible?
- —
Short-term bridge; refi at stabilization.
Rent comps 26 comps
| Address | Beds | Baths | Sqft | Rent | $/sqft | DOM | Units | Dist |
|---|---|---|---|---|---|---|---|---|
| 3045 Kings Ridge Blvd Unit 1 Boulder, CO | 2.0 | 1.0 | 950 | $1,875 | $1.97 | 21d | 1 | 0.31mi |
| 3073 Fulton Cir Boulder, CO | 2.0 | 1.5 | 1032 | $2,403 | $2.33 | 13d | 1 | 0.34mi |
| 3485 Hayden Pl Unit 3 Boulder, CO | 2.0 | 1.5 | 785 | $2,495 | $3.18 | 21d | 1 | 0.65mi |
| 3715 Canfield St Boulder, CO | 2.0 | 1.0–2.0 | 827 | $2,576 | $3.11 | 13d | 24 | 0.68mi |
| 3303 Bluff St Boulder, CO | 3.0 | 1.0–2.5 | 1131 | $3,789 | $3.35 | 13d | 38 | 0.81mi |
| 3315 Chisholm Trl Unit 1546453P Boulder, CO | 2.0 | 1.0 | 861 | $2,639 | $3.07 | 13d | 1 | 0.82mi |
| 3120 Corona Trl #209 Boulder, CO | 2.0 | 2.0 | 966 | $2,650 | $2.74 | 21d | 1 | 0.85mi |
| 3150 Iris Ave Unit F309 Boulder, CO | 1.0 | 1.0 | 676 | $1,595 | $2.36 | 21d | 1 | 0.88mi |
| 2530 Junction Pl Boulder, CO | 1.0–3.0 | 1.0–3.5 | 1204 | $3,416 | $2.84 | 13d | 69 | 0.88mi |
| 2995 Eagle Way Boulder, CO | 2.0 | 1.0–1.5 | 639 | $1,845 | $2.89 | 21d | 1 | 0.96mi |
| 2995 Glenwood Dr Boulder, CO | 1.0–2.0 | 1.0–1.5 | 807 | $2,136 | $2.65 | 13d | 17 | 0.97mi |
| 3100 Pearl St Boulder, CO | 2.0 | 1.0–2.0 | 849 | $3,875 | $4.56 | 13d | 23 | 1.07mi |
| 3000 Pearl Pkwy Boulder, CO | 2.0 | 1.0–2.0 | 1249 | $3,936 | $3.15 | 13d | 19 | 1.14mi |
| 2820 Hibiscus AVE Boulder, CO | 3.0 | 1.0–2.5 | 1010 | $3,678 | $3.64 | 13d | 91 | 1.16mi |
| 2850 Kalmia Ave Boulder, CO | 1.0–2.0 | 1.0–2.0 | 850 | $2,795 | $3.29 | 13d | 4 | 1.19mi |
| 2800 Kalmia Ave Boulder, CO | 2.0 | 1.5–2.0 | 880 | $2,150 | $2.44 | 21d | 2 | 1.21mi |
| 3487 28th St #21 Boulder, CO | 2.0 | 1.5 | 936 | $2,600 | $2.78 | 21d | 1 | 1.27mi |
| 2747 Glenwood Ct Boulder, CO | 2.0 | 1.5 | 1000 | $1,850 | $1.85 | 13d | 1 | 1.28mi |
| 3545 28th St #308 Boulder, CO | 2.0 | 2.0 | 838 | $2,950 | $3.52 | 21d | 1 | 1.30mi |
| 2707 Valmont Rd Boulder, CO | 1.0–2.0 | 1.0 | 684 | $2,200 | $3.22 | 21d | 6 | 1.31mi |
| 1590 Eisenhower Dr Boulder, CO | 3.0 | 1.0–3.0 | 937 | $3,724 | $3.97 | 13d | 20 | 1.33mi |
| 4970 Meredith Way Boulder, CO | 1.0–2.0 | 1.0–2.0 | 836 | $2,717 | $3.25 | 13d | 15 | 1.36mi |
| 3401 Arapahoe Ave Boulder, CO | 1.0 | 1.0 | 871 | $3,995 | $4.58 | 13d | 1 | 1.38mi |
| 2625 Tabriz Pl Boulder, CO | 3.0 | 1.0 | 1097 | $3,600 | $3.28 | 21d | 1 | 1.40mi |
| 3725 Birchwood Dr #23 Boulder, CO | 2.0 | 1.5 | 1114 | $2,295 | $2.06 | 21d | 1 | 1.40mi |
| 2606 Juniper Ave Unit 34-1 Boulder, CO | 1.0 | 1.0 | 548 | $1,325 | $2.42 | 13d | 1 | 1.44mi |
Listing history 12 events
-
2026-06-09days on market $84,000 Active 28 DOM
-
2026-06-07days on market $84,000 Active 27 DOM
-
2026-06-05days on market $84,000 Active 24 DOM
-
2026-06-03days on market $84,000 Active 23 DOM
-
2026-06-02days on market $84,000 Active 22 DOM
-
2026-06-01days on market $84,000 Active 21 DOM
-
2026-05-31days on market $84,000 Active 20 DOM
-
2026-05-30days on market $84,000 Active 19 DOM
-
2026-05-22price $84,000
-
2026-05-10$89,000 Active
-
1997-06-06soldstatus $12,000
-
1993-05-19soldstatus $12,000
ⓘ Source: listings_history table (triggers on properties + properties_extension) + one-shot
backfill from property_details.listing_events for pre-trigger history.
Climate risk First Street
- Flood 1/10 Low FEMA zone X (unshaded) · 0% chance over 30 yrs
- Wildfire 6/10 Major
- Heat 3/10 Moderate 7 d/yr ≥92°F today · 18 d/yr by 30 yrs out
- Wind 1/10 Low
- Air quality 4/10 Moderate 4 unhealthy d/yr today · 5 by 30 yrs out
Nearby sold comps map
Loading sold comps map…
Walkable amenities ~0.75 mi
Loading nearby amenities…
Taxation est. · year 1
- Rental income
- $30,255
- − Mortgage interest
- −$4,705
- − Property taxes
- −$1,260
- − Insurance
- −$420
- − Repairs & maintenance
- −$2,420
- − Management
- −$2,420
- − Depreciation
- −$2,444
- Taxable income
- $16,585
- Est. tax owed @ 24.0%
- −$3,980
- After-tax cash flow
- $12,955/yr
For passive investors: Depreciation is non-cash, so a rental often shows a tax loss while cash-flowing — sheltering income. Rental losses are passive: they offset passive income freely, and up to $25,000/yr can offset ordinary (W-2) income if you actively participate and your MAGI is under $100k (phasing out to $0 by $150k); unused losses carry forward. On sale, claimed depreciation is recaptured at up to 25%, and gains may owe capital-gains tax (a 1031 exchange can defer both). Figures are a year-1 estimate at your 24.0% rate — not tax advice; consult a CPA.
Schools (NCES district)
- District
- Boulder Valley School District No. Re2
- NCES district ID
- 0802490
- Math proficiency
- 49% ▼ -3.00%
- Reading proficiency
- 67% ▲ 4.00%
- Median HH income
- $70,395
- Composite
- 51.3/100
- National rank
- #1747
- State rank
- #6 of 86 in CO
Livability — Boulder
- Score
- 77/100
- State rank
- #24
- US rank
- #2958
Category grades
Schools grade is shown separately in the Schools card above.
Census & demographics
- Census place
- Boulder, CO
- County
- Boulder County · 271,666 people
- City population
- 121,246
- Metro
- Boulder, CO
- Population (ZIP)
- 25,007
- Household income
- $95,207
- Rent vs Own
- Severe rent burden
- 1296.0
Population outlook (Boulder County) Hauer SSP2
- Today (2025)
- 380,833 people
- By 2030
- 412,028 · +8.2%
- By 2040
- 472,764 · +24.1%
- By 2050
- 532,029 · +39.7%
- By 2075
- 679,723 · +78.5%
- By 2100
- 766,278 · +101.2%
Race, ethnicity, and origin ACS 2023
- Neighborhood character
- Predominantly White (80%)
- Race & ethnicity
- White 80% Two or more races 11% Hispanic / Latino 11% Asian 3%
- Hispanic origin (detail)
- Mexican 7%
- Common ancestry
- Italian 4% Slovak 4% Lithuanian 3%
- Foreign-born
- 9% · Canada, China, South Korea
- Languages at home
- 88% English-only · Spanish 6% Other Indo-European 2% Russian/Polish/Slavic 1%
Political lean MEDSL · Boulder
- 2024 margin
- Solid D (+55.8) · D 76.5% · R 20.8% · Other 2.7%
- 2008→2024 swing
- +9.6pp toward D · 2008: 46.1pp · 2024: 55.8pp
- All cycles
- 2024: D+55.8 2020: D+56.6 2016: D+48.6 2012: D+41.5 2008: D+46.1
Not yet ingested
- Civics
- —
Market trends
- HPI YoY
- ▼ -674.67%
- Current HPI
- 286.4092
- Rent YoY
- ▼ -2.27%
- Metro
- Boulder, CO
- State GDP YoY
- ▲ 1.95%
- F500 in state
- 14
Industry mix (Fortune 500 HQ in CO)
| Industry | F500 HQs | Revenue |
|---|---|---|
| Technology Distribution | 1 | $31B |
|
||
| Food / Agriculture | 1 | $18B |
|
||
| Packaging | 1 | $14B |
|
||
| Healthcare | 1 | $13B |
|
||
| Energy | 1 | $10B |
|
||
| Technology | 1 | $4B |
|
||
Price history
+600.0% since first listed4 events — show timeline
- 2026-05-22 Price Changed $84,000 FSBO.com
- 2026-05-10 Listed $89,000 FSBO.com
- 1997-06-06 Sold (Public Records) $12,000 Public Records
- 1993-05-19 Sold (Public Records) $12,000 Public Records
Property tax history
+8.6%/yrLatest (2021): $110 · +4.8% YoY. Source: county tax records.
Cash-flow waterfall
monthlySold comps — $/sqft
last 12 mo · ≤1 miLoading sold comps…