 Duplex
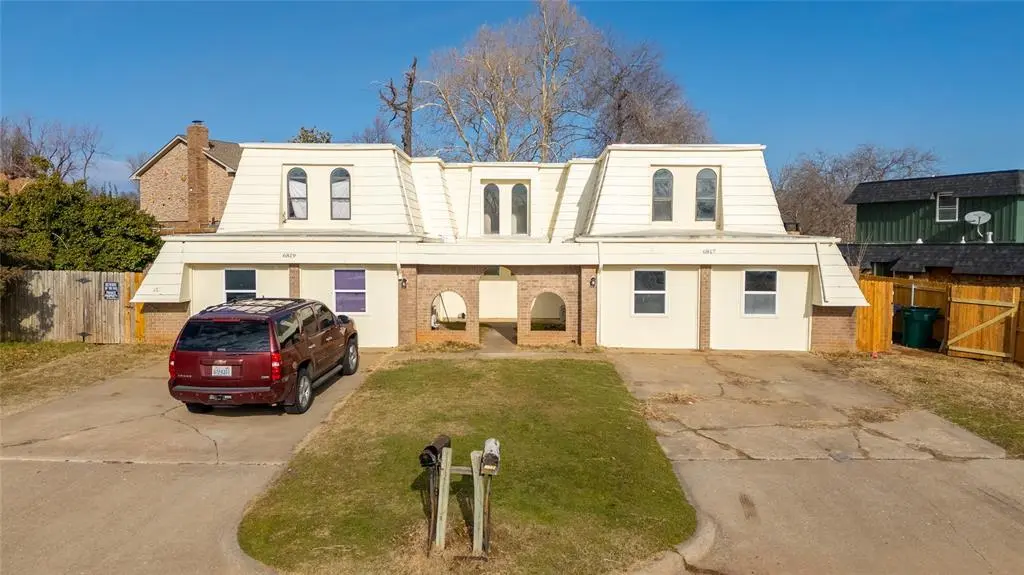
6817 Lancer Ln · Oklahoma City, OK
Flood risk 1/10 · Minimal
- FEMA flood zone
- X (unshaded)
- Chance of flooding over 30 yrs
- 0.0%
- Est. flood insurance / yr
- $507 – $1,088
Fire risk 3/10 · Minor
- Est. fire insurance / yr
- $2,463 – $4,575
Heat risk 6/10 · Moderate
- Hot days now (above 106°F)
- 7 days/yr
- Hot days in 30 yrs
- 19 days/yr
Wind risk 2/10 · Minimal
- Chance of severe wind over 30 yrs
- 4.0%
Air-quality risk 2/10 · Minimal
- Unhealthy air days now
- 1 days/yr
- Unhealthy air days in 30 yrs
- 2 days/yr
Risk factors via First Street. Map © Google.
Why this score? — see what drove the D grade
The composite is a weighted blend of 9 inputs, each scored 0–100. Each bar is that input's sub-score; the figure is the points it added to the 100-point composite (weight × sub-score).
- Cash flow +20.3/30.0
- DSCR +6.4/10.0
- 1% rule +4.6/10.0
- Livability +4.0/5.0
- Rent growth +2.9/5.0
- Condition / age +2.5/5.0
- ARV discount +1.6/15.0
- Schools +1.3/10.0
- Appreciation +0.0/10.0
$338,000
🖨 Deal sheet 📄 Offer letter ✓ Due diligence
Multi-family units
County records classify this as Multi-Family (2-4 Unit). Listing-text estimate: 2 units. confirmed
Listing remarks MLS
WEST UNIT HAS THE LOCKBOX ON THE DOOR. EACH UNIT HAS BEEN RENTING FOR $650 ON ONE SIDE & $725 ON THE OTHER.
Key facts
- Brand new roof
- Strong rental market
- Duplex
Tags
Neighborhood map
What this means for you Summary
Snapshot
- This is a 2 × 5-bed/2.0-bath units multifamily listed at $338k.
Deal economics
- At list price, monthly cash flow is $431 ($5k/yr) — positive. Per door: $216/mo.
- The deal already cash-flows at list — no discount required.
- To meet the 1% rule (rent ≥ 1% of price), the offer needs to be $325k (3.7% below list).
- Recommended offer: $325k (3.7% below list) — sets the bar for 1% rule.
- Cap rate 7.8% vs local median 3.7% in Oklahoma City — top-decile yield for the area; either an underpriced asset or a hidden risk that comps aren't pricing in. Stress-test before assuming the spread holds.
Location & tenants
- Location reads 80/100 on livability (#3 in OK, #1,635 nationally) — a professional / high-income tenant draw. Strengths: amenities A+, commute A+, cost of living A+; Watch: crime F.
- Putnam City (urban): math 12% / reading 16% proficiency, ranked #227 of 270 in OK (top 84%) — low school quality limits family demand, transient renter base, plan for 1-2y turnover; 65% free/reduced lunch — lower-income household profile, screen leases tightly.
- Zoned schools: Tulakes Es (math 7% / reading 7%, grade F, #762 of 845 statewide, top 90%, 621 students, 0% FRL); Putnam City Hs (math 12% / reading 23%, grade F, #307 of 447 statewide, top 69%, 2,014 students, 0% FRL) — zoned schools average 0% FRL vs 65% district-wide (65 pts lower); this property's tenant base skews higher-income than the district average.
- Market conditions: Rents rising (+1.5%/yr); 190 active listings in the ZIP; 5,365 units permitted in Oklahoma County in 2024 (569 in 5+ unit buildings).
- At $3,254/mo this rent would consume 65% of the median local household income ($60k/yr) (locally 1610% of renters already pay >50% of income on rent) — very limited rent-growth headroom before tenants either downsize or default.
Forward outlook
- Local home prices are declining (-3.0%/yr); year-one equity from $2k of loan paydown is wiped out by about $10k of value loss. Plan a longer hold.
- Oklahoma County population projected at +41% by 2050 — long-run rental-demand tailwind backs the buy-and-hold thesis.
Negotiation context
- It's been on market 18 days — a 2% lower offer ($333k) is reasonable based on typical stale-listing flexibility.
- 6 sale attempts since 24y ago with the ask held roughly flat each time — persistent listings suggest the price (not the market) is what's stuck; bring a comps-based counter.
- Current owner paid $180k; list at $338k implies a 88% gain — meaningful room to come down on a strong offer.
Risks & watch-outs
- Climate carrying-cost: extreme-heat days projected 7→19/yr by 2055 (HVAC capex compounding) — expect insurance premiums to compound above CPI over the hold.
Questions for the listing agent
- Can we see the unit-by-unit rent roll, current vacancy, and any below-market leases? What's the average tenancy length?
- What capital expenditures (roof, boiler, parking lot, exteriors) have been made in the last 5 years, and what's planned in the next 2?
- Built in 1972 — when were the roof, HVAC, electrical panel, plumbing, and water heater last replaced?
- Is there a deadline driving the sale (1031 exchange, divorce, estate, relocation)? That informs how much negotiation room exists.
- Schools are F-rated, which usually means shorter tenancies and higher turnover. Who's the typical renter profile here, and what's been the actual vacancy rate?
- Crime grade is F in this area — have there been break-ins, vandalism, or insurance claims at this property in the last 3 years? What carrier currently insures it and at what premium?
- The area grade is low — what's the realistic commute time and amenity access for the typical tenant pool here? Any planned neighborhood developments (good or bad) we should know about?
- What's the average days-on-market for RENTAL listings here right now (not sales)? A rising rental-DOM trend means longer vacancies and softer asking-rent achievability than the comps imply.
- What's the recent tenant-quality profile in this submarket — average credit score on applications, eviction rate, late-payment / NSF rate, and stable-employment percentage? A property-management company in the area should have these aggregated.
- How much new apartment / multifamily construction is in the pipeline within 1–3 miles? Heavy new supply (>2% of stock underway) typically softens rents 12–24 months out; light construction supports rent growth.
Investment metrics
- 1% rule
- 0.96% ✗
- Cap rate
- 7.82%
- Cash-on-cash
- 5.47%
- DSCR
- 1.24
- GRM
- 8.7
CMA / ARV
- ARV (on-the-fly)
- $298,862
- Comps found
- 1
Show comp detail 1 sale within ~0.75 mi
| Address | Dist | Beds/Ba | Sqft | Sold | Price | $/sf | Match |
|---|---|---|---|---|---|---|---|
| 6326 NW 82nd St | 0.67mi | 3/3.0 (+1) | 3,556 (+6%) | 12mo | $315,000 | $89 | 40 |
Match score weights: distance 35% · size 25% · config 20% · recency 20%. Top-matched comps best support the ARV.
Projected returns pro-forma
-3.0% appreciation · 1.53% rent growth · sell at horizon
- IRR
- -9.4%
- Equity multiple
- 0.66×
- Total profit
- $-32,110
- Equity at exit
- $50,397
- IRR
- -2.0%
- Equity multiple
- 0.88×
- Total profit
- $-11,771
- Equity at exit
- $29,224
Cash invested: $94,640 (down + closing). Projections, not guarantees.
Landlord ↔ Tenant lean methodology
- Overall (STATE)
- 83 Strongly Landlord-Friendly
- State Oklahoma
- 83 Strongly Landlord-Friendly · R+20
- County
- — inherits STATE
- City
- — inherits STATE
ZIP-level market 73132
- Rents YoY
- 1.5%
- Active inventory
- 190
- Price-to-rent
- 17.3×
Monthly cashflow live
- Estimated rent
- $3,254 high interval (Pro) →
- Mortgage (P&I)
- −$1,773
- Tax from tax record
- −$226 /mo · $2,711/yr
- Insurance
- −$141
- HOA
- −$0
- Vacancy / Maint / Mgmt
- −$683
- Net cashflow
- $431
Break-even live
2-unit breakdown (identical units grouped — click to expand)
| Units | Beds | Baths | Est. rent |
|---|---|---|---|
| 2× units | 5 | 2 | $3,254 |
| #1 | 5 | 2 | $1,627 |
| #2 | 5 | 2 | $1,627 |
| Total (2 units) | $3,254 | ||
UW: 25.0% down · 7.5% · 30yr · 1.5% tax · 5.0% vac · 8.0% maint · 8.0% mgmt
Financing live
Cash to close
- Down payment
- $84,500
- Closing costs
- $10,140
- Reserves months
- —
- Total cash needed
- —
Loan-product check · same deal, 3 products live
Conventional
25% down · 7.5% · 30yr
- Down + closing
- —
- Monthly P&I
- —
- Monthly cashflow
- —
- DSCR
- —
- Eligible?
- —
Personal DTI + credit; lowest rate.
DSCR
20% down · 8.5% · 30yr
- Down + closing
- —
- Monthly P&I
- —
- Monthly cashflow
- —
- DSCR
- —
- Eligible?
- —
No personal income docs; deal must DSCR.
Hard money
10% down · 12.0% · 12mo
- Down + closing
- —
- Monthly P&I
- —
- Monthly cashflow
- —
- DSCR
- —
- Eligible?
- —
Short-term bridge; refi at stabilization.
Listing history 26 events
-
2026-06-18days on market $338,000 Active 18 DOM
-
2026-06-17days on market $338,000 Active 17 DOM
-
2026-06-16days on market $338,000 Active 16 DOM
-
2026-06-15days on market $338,000 Active 15 DOM
-
2026-06-13days on market $338,000 Active 13 DOM
-
2026-06-13days on market $338,000 Active 12 DOM
-
2026-06-09days on market $338,000 Active 9 DOM
-
2026-06-08status $338,000 Active 8 DOM
-
2026-04-24status Pending
-
2026-04-16$338,000 Active
-
2025-02-08historical $1,750
-
2025-01-29$1,750
-
2025-01-20historical $1,750
-
2025-01-16$1,750
-
2023-09-02historical $1,750
-
2023-08-20$1,750
-
2022-09-16soldstatus $180,000
-
2022-08-10soldstatus $130,000
-
2010-02-19historical
-
2009-08-18$179,900
-
2003-03-05soldstatus $110,000
-
2003-02-28soldstatus $110,000 111-char remark
Show marketing remark (111 chars)
WEST UNIT HAS THE LOCKBOX ON THE DOOR. EACH UNIT HAS BEEN RENTING FOR $650 ON ONE SIDE & $725 ON THE OTHER.
-
2002-09-11$122,900 111-char remark
Show marketing remark (111 chars)
WEST UNIT HAS THE LOCKBOX ON THE DOOR. EACH UNIT HAS BEEN RENTING FOR $650 ON ONE SIDE & $725 ON THE OTHER.
-
1998-03-26soldstatus $81,500
-
1992-07-29soldstatus $58,500
-
1983-07-01soldstatus $108,000
ⓘ Source: listings_history table (triggers on properties + properties_extension) + one-shot
backfill from property_details.listing_events for pre-trigger history.
Tax reassessment forecast OK · Resets to sale price
- Current annual tax
- $2,711 · $226/mo
- Projected year-2 tax
- $3,042 · $253/mo
- Expected delta
- +$331/yr (+$28/mo · 12.2%)
ⓘ Screening estimate from a state-policy table — verify with the county assessor before closing.
Climate risk First Street
- Flood 1/10 Low FEMA zone X (unshaded) · 0% chance over 30 yrs
- Wildfire 3/10 Moderate
- Heat 6/10 Major 7 d/yr ≥106°F today · 19 d/yr by 30 yrs out
- Wind 2/10 Low 4% chance of damaging wind over 30 yrs
- Air quality 2/10 Low 1 unhealthy d/yr today · 2 by 30 yrs out
Nearby sold comps map
Loading sold comps map…
Walkable amenities ~0.75 mi
Loading nearby amenities…
Taxation est. · year 1
- Rental income
- $39,048
- − Mortgage interest
- −$18,933
- − Property taxes
- −$2,711
- − Insurance
- −$1,690
- − Repairs & maintenance
- −$3,124
- − Management
- −$3,124
- − Depreciation
- −$9,833
- Taxable loss
- −$367
- Est. tax savings @ 24.0%
- +$88
- After-tax cash flow
- $5,265/yr
For passive investors: Depreciation is non-cash, so a rental often shows a tax loss while cash-flowing — sheltering income. Rental losses are passive: they offset passive income freely, and up to $25,000/yr can offset ordinary (W-2) income if you actively participate and your MAGI is under $100k (phasing out to $0 by $150k); unused losses carry forward. On sale, claimed depreciation is recaptured at up to 25%, and gains may owe capital-gains tax (a 1031 exchange can defer both). Figures are a year-1 estimate at your 24.0% rate — not tax advice; consult a CPA.
Schools (NCES district)
- District
- Putnam City
- NCES district ID
- 4025290
- Math proficiency
- 12% ▼ -18.00%
- Reading proficiency
- 16% ▼ -14.00%
- Median HH income
- $46,657
- Composite
- 12.61/100
- National rank
- #9614
- State rank
- #227 of 270 in OK
Livability — Oklahoma City
- Score
- 80/100
- State rank
- #3
- US rank
- #1635
Category grades
Schools grade is shown separately in the Schools card above.
Census & demographics
- Census place
- Oklahoma City, OK
- County
- Oklahoma County · 771,644 people
- City population
- 498,656
- Metro
- Oklahoma City, OK
- Population (ZIP)
- 27,834
- Household income
- $60,419
- Rent vs Own
- Severe rent burden
- 1610.0
Population outlook (Oklahoma County) Hauer SSP2
- Today (2025)
- 911,875 people
- By 2030
- 982,413 · +7.7%
- By 2040
- 1,130,468 · +24.0%
- By 2050
- 1,288,422 · +41.3%
- By 2075
- 1,711,482 · +87.7%
- By 2100
- 2,088,448 · +129.0%
Race, ethnicity, and origin ACS 2023
- Neighborhood character
- Diverse neighborhood (Simpson 0.68)
- Race & ethnicity
- White 51% Black 17% Hispanic / Latino 16% Two or more races 12% Asian 5% Native American 2%
- Hispanic origin (detail)
- Mexican 10% Puerto Rican 1%
- Common ancestry
- Serbian 2% Slovak 2% Lithuanian 1%
- Foreign-born
- 11% · Canada, Vietnam, Philippines
- Languages at home
- 84% English-only · Spanish 10% Other Asian/Pacific 1% Vietnamese 1%
Political lean MEDSL · Oklahoma
- 2024 margin
- Toss-up / Even · D 48.0% · R 49.7% · Other 2.3%
- 2008→2024 swing
- +15.1pp toward D · 2008: -16.8pp · 2024: -1.7pp
- All cycles
- 2024: R+1.7 2020: R+1.1 2016: R+10.5 2012: R+16.7 2008: R+16.8
Not yet ingested
- Civics
- —
Market trends
- HPI YoY
- ▼ -196.70%
- Current HPI
- 214.9695
- Rent YoY
- ▲ 1.53%
- Metro
- Oklahoma City, OK
- State GDP YoY
- ▲ 1.55%
- F500 in state
- 6
Industry mix (Fortune 500 HQ in OK)
| Industry | F500 HQs | Revenue |
|---|---|---|
| Energy | 3 | $48B |
|
||
Price history
+213.0% since first listed18 events — show timeline
- 2026-04-24 Pending — MLSOK
- 2026-04-16 Listed $338,000 MLSOK
- 2025-02-08 Rental Removed $1,750 APPFOLIO
- 2025-01-29 Listed for Rent $1,750 APPFOLIO
- 2025-01-20 Rental Removed $1,750 APPFOLIO
- 2025-01-16 Listed for Rent $1,750 APPFOLIO
- 2023-09-02 Rental Removed $1,750 APPFOLIO
- 2023-08-20 Listed for Rent $1,750 APPFOLIO
- 2022-09-16 Sold (Public Records) $180,000 Public Records
- 2022-08-10 Sold (Public Records) $130,000 Public Records
- 2010-02-19 Listing Removed — MLSOK
- 2009-08-18 Listed $179,900 MLSOK
- 2003-03-05 Sold (Public Records) $110,000 Public Records
- 2003-02-28 Sold (MLS) $110,000 MLSOK
- 2002-09-11 Listed $122,900 MLSOK
- 1998-03-26 Sold (Public Records) $81,500 Public Records
- 1992-07-29 Sold (Public Records) $58,500 Public Records
- 1983-07-01 Sold (Public Records) $108,000 Public Records
Property tax history
+6.3%/yrLatest (2025): $2,711 · +5.7% YoY. Source: county tax records.
Cash-flow waterfall
monthlySold comps — $/sqft
last 12 mo · ≤1 miLoading sold comps…