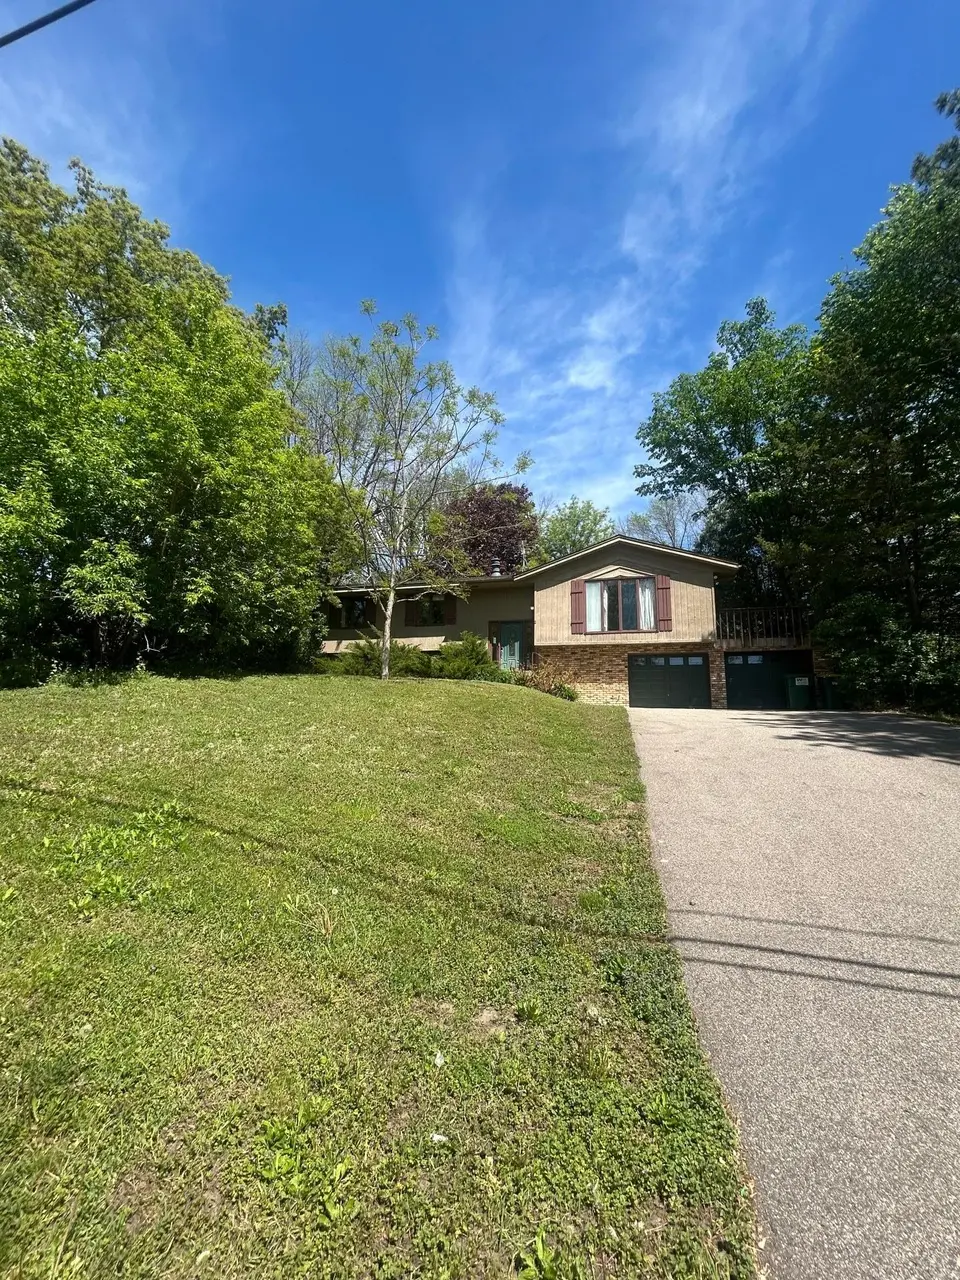
5905 Country Club Rd · Shorewood, MN
Flood risk 1/10 · Minimal
- FEMA flood zone
- X (unshaded)
- Chance of flooding over 30 yrs
- 0.0%
- Est. flood insurance / yr
- $473 – $860
Fire risk 1/10 · Minimal
- Est. fire insurance / yr
- $888 – $1,650
Heat risk 2/10 · Minimal
- Hot days now (above 98°F)
- 7 days/yr
- Hot days in 30 yrs
- 14 days/yr
Wind risk 2/10 · Minimal
- Chance of severe wind over 30 yrs
- —
Air-quality risk 2/10 · Minimal
- Unhealthy air days now
- 1 days/yr
- Unhealthy air days in 30 yrs
- 1 days/yr
Risk factors via First Street. Map © Google.
Why this score? — see what drove the D grade
The composite is a weighted blend of 9 inputs, each scored 0–100. Each bar is that input's sub-score; the figure is the points it added to the 100-point composite (weight × sub-score).
- Cash flow +11.7/30.0
- ARV discount +7.5/15.0
- Schools +6.6/10.0
- Rent growth +5.0/5.0
- DSCR +3.4/10.0
- Livability +3.4/5.0
- 1% rule +3.0/10.0
- Condition / age +2.5/5.0
- Appreciation +0.0/10.0
$489,900
🖨 Deal sheet (PDF) 📄 Offer letter ✓ Due diligence
Listing remarks
Opportunity Knocks in Excelsior! Set on a rare and private 0.93-acre lot in one of the area's most sought-after locations, this one-owner custom home offers the perfect combination of location, lot size, and upside potential. Whether you're a buyer looking to renovate and build equity, or a builder seeking an exceptional homesite, the possibilities here are endless. Featuring approximately 2,400 finished square feet, this home offers 3 main-level bedrooms, including a primary suite with a private ¾ bath, hardwood floors, an oversized heated garage, solid mechanicals, and the kind of "good bones" that are increasingly hard to find. Move in and update over time, undertake a
Key facts
- Nearby parks
- New roof
- 0.93-acre lot
Tags
Property features AI
Finance
- Financial info: Property sold free and clear
Exterior
- Parking: Attached tuck-under heated garage with garage door opener and floor drain; 2 garage spaces; Asphalt driveway
- Utilities: Private well water source; City sewer connection; 150 amp electric service; Natural gas
- Home design: Residential split entry (bi-level) design; Main level primary bedroom
- Construction: Block and concrete construction materials; Block foundation; Asphalt pitched roof (age 8 years or less)
- Exterior features: Deck; Storage shed; Corner lot with medium tree coverage; Paved city streets and public road maintenance
Interior
- Kitchen: Cooktop; Dishwasher; Refrigerator; Kitchen window
- Bedrooms: 3 bedrooms (primary suite on main level); Bedroom dimensions include 11x10 and 10x9
- Flooring: Hardwood floors
- Bathrooms: One full bath; One three-quarter bath; One quarter bath
- Heating & cooling: Forced air heating; Central air conditioning
- Interior features: Finished full basement with daylight/lookout windows, egress window(s), sump pump and drain tile; Walkout basement with storage space and workshop; Wood-burning fireplace in the family room; Natural woodwork; Walk-in closet; Eat-in kitchen / informal dining area
- Laundry & utility: Lower level laundry room with washer and dryer hookups; Gas dryer hookup; Washer/dryer hookup noted; Gas water heater; Water softener (owned)
Neighborhood map
What this means for you Summary
Snapshot
- This is a 3-bed/2.5-bath single-family listed at $490k.
Deal economics
- At list price, monthly cash flow is $-145 ($-2k/yr) — negative.
- To cash-flow at today's rent, offer at most $464k (5.2% below list).
- To meet the 1% rule (rent ≥ 1% of price), the offer needs to be $392k (20.0% below list).
- Recommended offer: $392k (20.0% below list) — sets the bar for 1% rule.
- Cap rate 5.9% vs local median 0.8% in Shorewood — top-decile yield for the area; either an underpriced asset or a hidden risk that comps aren't pricing in. Stress-test before assuming the spread holds.
Location & tenants
- Location reads 67/100 on livability (#464 in MN) — a middle-class / working-renter tenant base. Strengths: crime A+, employment A+, housing A+; Watch: amenities F, commute F, cost of living F.
- Minnetonka Public School District (suburban): math 68% / reading 74% proficiency, ranked #6 of 301 in MN (top 2%) — strong family-tenant draw, lease renewals of 3-5y typical; only 5% free/reduced lunch — higher-income household profile.
- Zoned schools: Minnewashta Elementary (math 69% / reading 71%, grade A-, #71 of 857 statewide, top 8%, 904 students, 5% FRL); Minnetonka West Middle (math 59% / reading 75%, grade A-, #11 of 258 statewide, top 5%, 1,274 students, 9% FRL); Minnetonka Senior High (math 68% / reading 80%, grade B+, #10 of 471 statewide, top 2%, 3,508 students, 11% FRL) — zoned schools at 9% FRL track the district average.
- Market conditions: Rents rising fast (+11.1%/yr); 244 active listings in the ZIP; 3 comparable units currently listed for rent nearby; rentals leasing fast (median 12d on market — plan ~1-2 weeks tenant-placement turnaround); high-income renter base; 4,651 units permitted in Hennepin County in 2024 (2,443 in 5+ unit buildings).
Forward outlook
- Local home prices are declining (-3.0%/yr); year-one equity from $3k of loan paydown is wiped out by about $15k of value loss. Plan a longer hold.
- Hennepin County population projected at +30% by 2050 — long-run rental-demand tailwind backs the buy-and-hold thesis.
Negotiation context
- Only 10 days on market — expect competitive offers; lowballing is unlikely to land.
Questions for the listing agent
- What do current leases actually rent for vs. the listed asking? Can we see a recent rent roll and the last 12 months of T-12 income?
- Built in 1976 — when were the roof, HVAC, electrical panel, plumbing, and water heater last replaced?
- Is there a deadline driving the sale (1031 exchange, divorce, estate, relocation)? That informs how much negotiation room exists.
- The area grade is low — what's the realistic commute time and amenity access for the typical tenant pool here? Any planned neighborhood developments (good or bad) we should know about?
- What's the average days-on-market for RENTAL listings here right now (not sales)? A rising rental-DOM trend means longer vacancies and softer asking-rent achievability than the comps imply.
- What's the recent tenant-quality profile in this submarket — average credit score on applications, eviction rate, late-payment / NSF rate, and stable-employment percentage? A property-management company in the area should have these aggregated.
- How much new for-sale + rental construction is in the pipeline within 1–3 miles? Heavy new supply typically softens prices + rents 12–24 months out; constrained supply supports both.
Investment metrics
- 1% rule
- 0.80% ✗
- Cap rate
- 5.94%
- Cash-on-cash
- -1.27%
- DSCR
- 0.94
- GRM
- 10.4
CMA / ARV
No comps found within radius.
Projected returns pro-forma
-3.0% appreciation · 8.0% rent growth · sell at horizon
- IRR
- -13.2%
- Equity multiple
- 0.50×
- Total profit
- $-67,954
- Equity at exit
- $73,046
- IRR
- 2.0%
- Equity multiple
- 1.17×
- Total profit
- $23,072
- Equity at exit
- $42,358
Cash invested: $137,172 (down + closing). Projections, not guarantees.
Landlord ↔ Tenant lean methodology
- Overall (STATE)
- 46 Balanced
- State Minnesota
- 46 Balanced · D+2
- County
- — inherits STATE
- City
- — inherits STATE
ZIP-level market 55331
- Rents YoY
- 11.1%
- Active inventory
- 244
- Price-to-rent
- 10.4×
Monthly cashflow live
- Estimated rent
- $3,920 medium interval (Pro) →
- Mortgage (P&I)
- −$2,569
- Tax from tax record
- −$469 /mo · $5,623/yr
- Insurance
- −$204
- HOA
- −$0
- Vacancy / Maint / Mgmt
- −$823
- Net cashflow
- $-145
Break-even live
Sensitivity live
| Price | -10% $132 | -5% $-7 | +0% $-145 | +5% $-284 | +10% $-423 |
|---|---|---|---|---|---|
| Rent | -10% $-455 | -5% $-300 | +0% $-145 | +5% $10 | +10% $164 |
| Rate | -1.0pp $101 | -0.5pp $-21 | base $-145 | +0.5pp $-272 | +1.0pp $-401 |
UW: 25.0% down · 7.5% · 30yr · 1.5% tax · 5.0% vac · 8.0% maint · 8.0% mgmt
Financing live
Cash to close
- Down payment
- $122,475
- Closing costs
- $14,697
- Reserves months
- —
- Total cash needed
- —
Loan-product check · same deal, 3 products live
Conventional
25% down · 7.5% · 30yr
- Down + closing
- —
- Monthly P&I
- —
- Monthly cashflow
- —
- DSCR
- —
- Eligible?
- —
Personal DTI + credit; lowest rate.
DSCR
20% down · 8.5% · 30yr
- Down + closing
- —
- Monthly P&I
- —
- Monthly cashflow
- —
- DSCR
- —
- Eligible?
- —
No personal income docs; deal must DSCR.
Hard money
10% down · 12.0% · 12mo
- Down + closing
- —
- Monthly P&I
- —
- Monthly cashflow
- —
- DSCR
- —
- Eligible?
- —
Short-term bridge; refi at stabilization.
Rent comps 3 comps
| Address | Beds | Baths | Sqft | Rent | $/sqft | DOM | Units | Dist |
|---|---|---|---|---|---|---|---|---|
| 2740 Orchard Ln Excelsior, MN | 2.0 | 1.5 | 2000 | $2,495 | $1.25 | 12d | 1 | 0.46mi |
| 175 3rd St Excelsior, MN | 4.0 | 4.0 | 2563 | $4,500 | $1.76 | 45d | 1 | 1.00mi |
| 1 West Dr Excelsior, MN | 3.0 | 3.0 | 1938 | $9,375 | $4.84 | 0d | 1 | 1.12mi |
Listing history 8 events
-
2026-06-16status $489,900 Pending 10 DOM
-
2026-06-15days on market $489,900 Active 10 DOM
-
2026-06-13days on market $489,900 Active 8 DOM
-
2026-06-13days on market $489,900 Active 7 DOM
-
2026-06-09days on market $489,900 Active 4 DOM
-
2026-06-08days on market $489,900 Active 3 DOM
-
2026-06-07remarks 682-char remark
-
2026-06-07$489,900 Active 2 DOM
ⓘ Source: listings_history table (triggers on properties + properties_extension) + one-shot
backfill from property_details.listing_events for pre-trigger history.
Tax reassessment forecast MN · Partial reset (capped growth)
- Current annual tax
- $5,623 · $469/mo
- Projected year-2 tax
- $5,623 · $469/mo
- Expected delta
- $0/yr ($0/mo · 0.0%)
ⓘ Screening estimate from a state-policy table — verify with the county assessor before closing.
Climate risk First Street
- Flood 1/10 Low FEMA zone X (unshaded) · 0% chance over 30 yrs
- Wildfire 1/10 Low
- Heat 2/10 Low 7 d/yr ≥98°F today · 14 d/yr by 30 yrs out
- Wind 2/10 Low
- Air quality 2/10 Low 1 unhealthy d/yr today · 1 by 30 yrs out
Nearby sold comps map
Loading sold comps map…
Walkable amenities ~0.75 mi
Loading nearby amenities…
Taxation est. · year 1
- Rental income
- $47,035
- − Mortgage interest
- −$27,442
- − Property taxes
- −$5,623
- − Insurance
- −$2,450
- − Repairs & maintenance
- −$3,763
- − Management
- −$3,763
- − Depreciation
- −$14,252
- Taxable loss
- −$10,256
- Est. tax savings @ 24.0%
- +$2,462
- After-tax cash flow
- $718/yr
For passive investors: Depreciation is non-cash, so a rental often shows a tax loss while cash-flowing — sheltering income. Rental losses are passive: they offset passive income freely, and up to $25,000/yr can offset ordinary (W-2) income if you actively participate and your MAGI is under $100k (phasing out to $0 by $150k); unused losses carry forward. On sale, claimed depreciation is recaptured at up to 25%, and gains may owe capital-gains tax (a 1031 exchange can defer both). Figures are a year-1 estimate at your 24.0% rate — not tax advice; consult a CPA.
Schools (NCES district)
- District
- Minnetonka Public School District
- NCES district ID
- 2711670
- Math proficiency
- 68% ▼ -11.00%
- Reading proficiency
- 74% ▼ -8.00%
- Median HH income
- $106,869
- Composite
- 65.62/100
- National rank
- #464
- State rank
- #6 of 301 in MN
Livability — Shorewood
- Score
- 67/100
- State rank
- #464
- US rank
- #11022
Category grades
Schools grade is shown separately in the Schools card above.
Census & demographics
- Census place
- Shorewood, MN
- County
- Hennepin County · 1,150,272 people
- City population
- 19,805
- Metro
- Minneapolis-St. Paul-Bloomington, MN-WI
- Population (ZIP)
- 19,805
- Household income
- $159,450
- Rent vs Own
- Severe rent burden
- 241.0
Population outlook (Hennepin County) Hauer SSP2
- Today (2025)
- 1,405,227 people
- By 2030
- 1,492,650 · +6.2%
- By 2040
- 1,660,157 · +18.1%
- By 2050
- 1,823,498 · +29.8%
- By 2075
- 2,221,283 · +58.1%
- By 2100
- 2,509,976 · +78.6%
Race, ethnicity, and origin ACS 2023
- Neighborhood character
- Predominantly White (91%)
- Race & ethnicity
- White 91% Two or more races 5% Hispanic / Latino 3% Asian 1%
- Common ancestry
- Portuguese 12% Lithuanian 4% Romanian 4%
- Foreign-born
- 5% · Canada, China
- Languages at home
- 93% English-only · Spanish 2% Other Indo-European 1% Russian/Polish/Slavic 1%
Political lean MEDSL · Hennepin
- 2024 margin
- Solid D (+42.6) · D 70.2% · R 27.5% · Other 2.3%
- 2008→2024 swing
- +14.0pp toward D · 2008: 28.6pp · 2024: 42.6pp
- All cycles
- 2024: D+42.6 2020: D+43.2 2016: D+35.3 2012: D+27.1 2008: D+28.6
Not yet ingested
- Civics
- —
Market trends
- HPI YoY
- ▼ -543.75%
- Current HPI
- 240.3931
- Rent YoY
- ▲ 11.14%
- Metro
- Minneapolis-St. Paul-Bloomington, MN-WI
- State GDP YoY
- ▲ 2.41%
- F500 in state
- 34
Industry mix (Fortune 500 HQ in MN)
| Industry | F500 HQs | Revenue |
|---|---|---|
| Healthcare | 2 | $407B |
|
||
| Retail | 2 | $150B |
|
||
| Consumer Goods | 2 | $32B |
|
||
| Industrial Machinery | 2 | $6B |
|
||
| Agriculture | 1 | $40B |
|
||
| Healthcare / Medical Devices | 1 | $32B |
|
||
Price history
1 event — show timeline
- 2026-06-05 Listed $489,900 NORTHSTARMLS as Distributed by MLS Grid
Property tax history
+3.5%/yrLatest (2025): $5,623 · +1.9% YoY. Source: county tax records.
Cash-flow waterfall
monthlySold comps — $/sqft
last 12 mo · ≤1 miLoading sold comps…