 Fourplex
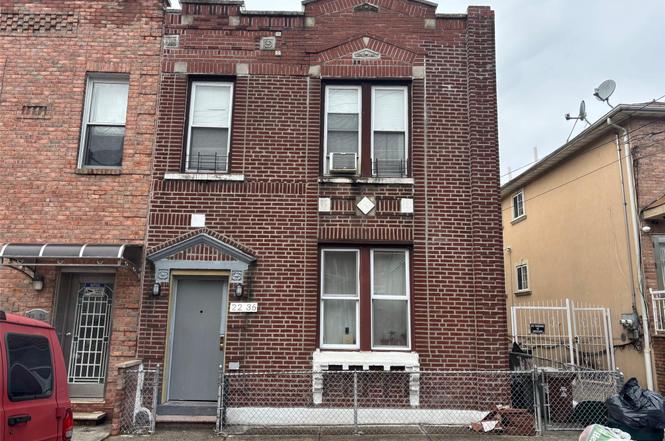
2236 121st St · New York, NY
Flood risk 1/10 · Minimal
- FEMA flood zone
- X (unshaded)
- Chance of flooding over 30 yrs
- 0.0%
- Est. flood insurance / yr
- $507 – $1,088
Fire risk 1/10 · Minimal
- Est. fire insurance / yr
- $691 – $1,283
Heat risk 6/10 · Moderate
- Hot days now (above 99°F)
- 7 days/yr
- Hot days in 30 yrs
- 15 days/yr
Wind risk 6/10 · Moderate
- Chance of severe wind over 30 yrs
- 27.0%
Air-quality risk 4/10 · Minor
- Unhealthy air days now
- 6 days/yr
- Unhealthy air days in 30 yrs
- 6 days/yr
Risk factors via First Street. Map © Google.
Why this score? — see what drove the B grade
The composite is a weighted blend of 9 inputs, each scored 0–100. Each bar is that input's sub-score; the figure is the points it added to the 100-point composite (weight × sub-score).
- Cash flow +30.0/30.0
- DSCR +10.0/10.0
- 1% rule +8.9/10.0
- ARV discount +7.5/15.0
- Rent growth +5.0/5.0
- Schools +5.0/10.0
- Livability +3.8/5.0
- Condition / age +2.5/5.0
- Appreciation +0.0/10.0
$1,129,999
🖨 Deal sheet (PDF) 📄 Offer letter ✓ Due diligence
Multi-family units
County records classify this as Multi-Family (2-4 Unit). Listing-text estimate: 4 units. confirmed
Listing remarks
Long time owner 4-family. Each floor has 2-apartments. 1st floor: one large 2-bedroom apartment with 5-rooms and the other apartment is 1-bedroom and 3-rooms. Same layout on 2nd floor. Walk up to roof. Basement is semi-finished with rear walk out entrance door. Well maintained. Gas Hot water boiler (3-years old). Gas Hot water replaced (2022). Flat roof new 2021
Key facts
- Gas hot water boiler
- Flat roof
- 2,500 sq ft lot
Tags
Property features AI
Exterior
- Parking: On-street parking
- Utilities: Con Edison electric; Natural gas connected; Public water connected; Public sewer; Sewer connected; Trash collection (public); Cable available; Phone available; Electricity connected
- Home design: Quadruplex; Actual property condition
- Construction: Brick construction; Block foundation; Partially finished basement with storage space and walk-out access; No attic
- Exterior features: Outdoor lighting; Mailbox; Rain gutters; Chain link fencing in back yard
Interior
- Kitchen: Eat-in kitchen(s)
- Bedrooms: Two 1-bedroom units; Two 2-bedroom units
- Flooring: Hardwood floors; Wood floors; Linoleum flooring
- Bathrooms: Four full bathrooms
- Heating & cooling: Hot water heating
- Interior features: First-floor bedroom; First-floor full bathroom; Eat-in kitchen
- Laundry & utility: Washer hookup; Gas dryer hookup; Laundry in basement
Neighborhood map
What this means for you Summary
Snapshot
- This is a 4 × 6-bed/4.0-bath units multifamily listed at $1.13M.
Deal economics
- At list price, monthly cash flow is $5k ($58k/yr) — positive. Per door: $1k/mo.
- The deal already cash-flows at list — no discount required.
- Meets the 1% rule at list price ($16k rent vs $1.13M).
- Recommended offer: $1.06M (6.0% below list) — sets the bar for market timing.
- Cap rate 11.4% vs local median 2.6% in New York — top-decile yield for the area; either an underpriced asset or a hidden risk that comps aren't pricing in. Stress-test before assuming the spread holds.
Location & tenants
- Location reads 75/100 on livability (#268 in NY, #4,188 nationally) — a middle-class / working-renter tenant base. Strengths: amenities A+, commute A+, health & safety A; Watch: crime F, cost of living F.
- Zoned schools: Elm Tree Elementary School (math 27% / reading 52%, grade F, #1,444 of 2,108 statewide, top 71%, 806 students, 94% FRL); Is 227 Louis Armstrong (math 52% / reading 69%, grade B+, #153 of 729 statewide, top 21%, 1,528 students, 68% FRL); Midwood High School (math 94% / reading 96%, grade A+, #83 of 1,100 statewide, top 8%, 4,062 students, 73% FRL).
- Market conditions: Rents rising fast (+12.1%/yr); 133 active listings in the ZIP; solid renter incomes; 5,302 units permitted in Queens County in 2024 (4,918 in 5+ unit buildings).
- At $15,660/mo this rent would consume 217% of the median local household income ($87k/yr) (locally 1545% of renters already pay >50% of income on rent) — very limited rent-growth headroom before tenants either downsize or default.
Forward outlook
- Local home prices are declining (-3.0%/yr); year-one equity from $8k of loan paydown is wiped out by about $34k of value loss. Plan a longer hold.
- Queens County population projected at +16% by 2050 — long-run rental-demand tailwind backs the buy-and-hold thesis.
- At projected returns (-3.0% appreciation + 8.0% rent growth), your $316k cash investment doubles in ~6 years — after that, you're playing with house money.
Negotiation context
- It's been on market 89 days — a 6% lower offer ($1.06M) is reasonable based on typical stale-listing flexibility.
- 2 sale attempts since 7y ago; this cycle's ask has dropped $150k (12%) from the opening price — seller is motivated, your offer sets the floor, not the list.
- Current owner paid $300k; list at $1.13M implies a 277% gain — meaningful room to come down on a strong offer.
Risks & watch-outs
- Watch-outs: built in 1931 — expect roof / HVAC / electrical / plumbing capex.
- Climate carrying-cost: major wind risk, 27% chance of damaging wind over 30y; extreme-heat days projected 7→15/yr by 2055 (HVAC capex compounding) — expect insurance premiums to compound above CPI over the hold.
Questions for the listing agent
- It's been on market 89 days. Have you received any prior offers? Is the seller open to a 6% concession, seller financing, or rate buy-down credit?
- Can we see the unit-by-unit rent roll, current vacancy, and any below-market leases? What's the average tenancy length?
- What capital expenditures (roof, boiler, parking lot, exteriors) have been made in the last 5 years, and what's planned in the next 2?
- Built in 1931 — when were the roof, HVAC, electrical panel, plumbing, and water heater last replaced?
- Why hasn't it sold? Are there any deal-killer items the seller is aware of (foundation, flood, title, zoning, code violations)?
- Is there a deadline driving the sale (1031 exchange, divorce, estate, relocation)? That informs how much negotiation room exists.
- Schools are B-rated — typically a magnet for longer-tenancy family renters. What's the average tenant stay here, and is there a school-zone premium baked into asking?
- Crime grade is F in this area — have there been break-ins, vandalism, or insurance claims at this property in the last 3 years? What carrier currently insures it and at what premium?
- What's the average days-on-market for RENTAL listings here right now (not sales)? A rising rental-DOM trend means longer vacancies and softer asking-rent achievability than the comps imply.
- What's the recent tenant-quality profile in this submarket — average credit score on applications, eviction rate, late-payment / NSF rate, and stable-employment percentage? A property-management company in the area should have these aggregated.
- How much new apartment / multifamily construction is in the pipeline within 1–3 miles? Heavy new supply (>2% of stock underway) typically softens rents 12–24 months out; light construction supports rent growth.
Investment metrics
- 1% rule
- 1.39% ✓
- Cap rate
- 11.41%
- Cash-on-cash
- 18.27%
- DSCR
- 1.81
- GRM
- 6.0
CMA / ARV
No comps found within radius.
Projected returns pro-forma
-3.0% appreciation · 8.0% rent growth · sell at horizon
- IRR
- 15.3%
- Equity multiple
- 1.65×
- Total profit
- $206,517
- Equity at exit
- $168,487
- IRR
- 27.4%
- Equity multiple
- 4.01×
- Total profit
- $951,864
- Equity at exit
- $97,702
Cash invested: $316,400 (down + closing). Projections, not guarantees.
Landlord ↔ Tenant lean methodology
- Overall (CITY)
- 0 Strongly Tenant-Friendly
- State New York
- 15 Strongly Tenant-Friendly · D+10
- County
- — inherits STATE
- City New York
- 0 Strongly Tenant-Friendly · D+34
ZIP-level market 11356
- Home prices YoY
- -28.9%
- Rents YoY
- 12.1%
- Active inventory
- 133
- Price-to-rent
- 24.1×
Monthly cashflow live
- Estimated rent
- $15,660 medium interval (Pro) →
- Mortgage (P&I)
- −$5,926
- Tax from tax record
- −$1,158 /mo · $13,895/yr
- Insurance
- −$471
- HOA
- −$0
- Vacancy / Maint / Mgmt
- −$3,289
- Net cashflow
- $4,817
Break-even live
Sensitivity live
| Price | -10% $5,456 | -5% $5,137 | +0% $4,817 | +5% $4,497 | +10% $4,177 |
|---|---|---|---|---|---|
| Rent | -10% $3,580 | -5% $4,198 | +0% $4,817 | +5% $5,435 | +10% $6,054 |
| Rate | -1.0pp $5,386 | -0.5pp $5,104 | base $4,817 | +0.5pp $4,524 | +1.0pp $4,226 |
4-unit breakdown (identical units grouped — click to expand)
| Units | Beds | Baths | Est. rent |
|---|---|---|---|
| 4× units | 6 | 4 | $15,660 |
| #1 | 6 | 4 | $3,915 |
| #2 | 6 | 4 | $3,915 |
| #3 | 6 | 4 | $3,915 |
| #4 | 6 | 4 | $3,915 |
| Total (4 units) | $15,660 | ||
UW: 25.0% down · 7.5% · 30yr · 1.5% tax · 5.0% vac · 8.0% maint · 8.0% mgmt
Financing live
Cash to close
- Down payment
- $282,500
- Closing costs
- $33,900
- Reserves months
- —
- Total cash needed
- —
Loan-product check · same deal, 3 products live
Conventional
25% down · 7.5% · 30yr
- Down + closing
- —
- Monthly P&I
- —
- Monthly cashflow
- —
- DSCR
- —
- Eligible?
- —
Personal DTI + credit; lowest rate.
DSCR
20% down · 8.5% · 30yr
- Down + closing
- —
- Monthly P&I
- —
- Monthly cashflow
- —
- DSCR
- —
- Eligible?
- —
No personal income docs; deal must DSCR.
Hard money
10% down · 12.0% · 12mo
- Down + closing
- —
- Monthly P&I
- —
- Monthly cashflow
- —
- DSCR
- —
- Eligible?
- —
Short-term bridge; refi at stabilization.
Listing history 13 events
-
2026-06-03statusdays on market $1,129,999 Pending 89 DOM
-
2026-06-01days on market $1,129,999 Active 88 DOM
-
2026-05-31days on market $1,129,999 Active 87 DOM
-
2026-05-11price $1,129,999
-
2026-03-26price $1,239,998
-
2026-03-05$1,279,998 Active
-
2026-03-05price $1,279,998
-
2026-03-05historical $1,269,999
-
2020-06-03historical
-
2019-10-25price $1,288,888
-
2019-10-25price $12,888,000
-
2019-08-28$1,388,888 New
-
1987-02-24soldstatus $300,000
ⓘ Source: listings_history table (triggers on properties + properties_extension) + one-shot
backfill from property_details.listing_events for pre-trigger history.
Tax reassessment forecast NY · Partial reset (capped growth)
- Current annual tax
- $13,895 · $1,158/mo
- Projected year-2 tax
- $16,496 · $1,375/mo
- Expected delta
- +$2,601/yr (+$217/mo · 18.7%)
ⓘ Screening estimate from a state-policy table — verify with the county assessor before closing.
Climate risk First Street
- Flood 1/10 Low FEMA zone X (unshaded) · 0% chance over 30 yrs
- Wildfire 1/10 Low
- Heat 6/10 Major 7 d/yr ≥99°F today · 15 d/yr by 30 yrs out
- Wind 6/10 Major 27% chance of damaging wind over 30 yrs
- Air quality 4/10 Moderate 6 unhealthy d/yr today · 6 by 30 yrs out
Nearby sold comps map
Loading sold comps map…
Walkable amenities ~0.75 mi
Loading nearby amenities…
Taxation est. · year 1
- Rental income
- $187,920
- − Mortgage interest
- −$63,298
- − Property taxes
- −$13,895
- − Insurance
- −$5,650
- − Repairs & maintenance
- −$15,034
- − Management
- −$15,034
- − Depreciation
- −$32,873
- Taxable income
- $42,138
- Est. tax owed @ 24.0%
- −$10,113
- After-tax cash flow
- $47,689/yr
For passive investors: Depreciation is non-cash, so a rental often shows a tax loss while cash-flowing — sheltering income. Rental losses are passive: they offset passive income freely, and up to $25,000/yr can offset ordinary (W-2) income if you actively participate and your MAGI is under $100k (phasing out to $0 by $150k); unused losses carry forward. On sale, claimed depreciation is recaptured at up to 25%, and gains may owe capital-gains tax (a 1031 exchange can defer both). Figures are a year-1 estimate at your 24.0% rate — not tax advice; consult a CPA.
Schools (NCES district)
No district data.
Livability — New York
- Score
- 75/100
- State rank
- #268
- US rank
- #4188
Category grades
Schools grade is shown separately in the Schools card above.
Census & demographics
- Census place
- New York, NY
- County
- Queens County · 1,914,869 people
- City population
- 7,731,280
- Metro
- New York-Newark-Jersey City, NY-NJ-PA
- Population (ZIP)
- 25,824
- Household income
- $86,730
- Rent vs Own
- Severe rent burden
- 1545.0
Population outlook (Queens County) Hauer SSP2
- Today (2025)
- 2,546,320 people
- By 2030
- 2,643,059 · +3.8%
- By 2040
- 2,815,563 · +10.6%
- By 2050
- 2,944,423 · +15.6%
- By 2075
- 3,123,338 · +22.7%
- By 2100
- 3,098,688 · +21.7%
Race, ethnicity, and origin ACS 2023
- Neighborhood character
- Diverse neighborhood (Simpson 0.66)
- Race & ethnicity
- Hispanic / Latino 42% Asian 35% White 21% Two or more races 8%
- Hispanic origin (detail)
- Mexican 3% Puerto Rican 5% Dominican 8%
- Common ancestry
- Romanian 1%
- Foreign-born
- 53% · Canada, China, South Korea
- Languages at home
- 26% English-only · Spanish 35% Chinese 23% Other Indo-European 8%
Political lean MEDSL · Queens
- 2024 margin
- Strong D (+24.6) · D 62.3% · R 37.7%
- 2008→2024 swing
- -26.2pp toward R · 2008: 50.8pp · 2024: 24.6pp
- All cycles
- 2024: D+24.6 2020: D+45.2 2016: D+53.4 2012: D+58.5 2008: D+50.8
Not yet ingested
- Civics
- —
Market trends
- HPI YoY
- ▼ -95.50%
- Current HPI
- 235.1217
- Rent YoY
- ▲ 12.13%
- Metro
- New York-Newark-Jersey City, NY-NJ-PA
- State GDP YoY
- ▲ 2.60%
- F500 in state
- 92
Industry mix (Fortune 500 HQ in NY)
| Industry | F500 HQs | Revenue |
|---|---|---|
| Financial Services | 10 | $950B |
|
||
| Consumer Goods | 9 | $162B |
|
||
| Insurance | 4 | $225B |
|
||
| Telecommunications | 2 | $144B |
|
||
| Pharmaceuticals | 2 | $112B |
|
||
| Media / Entertainment | 2 | $69B |
|
||
Price history
+276.7% since first listed10 events — show timeline
- 2026-05-11 Price Changed $1,129,999 OneKey® MLS as Distributed by MLS Grid
- 2026-03-26 Price Changed $1,239,998 OneKey® MLS as Distributed by MLS Grid
- 2026-03-05 Listed $1,279,998 OneKey® MLS as Distributed by MLS Grid
- 2026-03-05 Price Changed $1,279,998 OneKey® MLS as Distributed by MLS Grid
- 2026-03-05 Coming Soon $1,269,999 OneKey® MLS as Distributed by MLS Grid
- 2020-06-03 Listing Removed — OneKey® MLS as Distributed by MLS Grid
- 2019-10-25 Price Changed $1,288,888 OneKey® MLS as Distributed by MLS Grid
- 2019-10-25 Price Changed $12,888,000 OneKey® MLS as Distributed by MLS Grid
- 2019-08-28 Listed $1,388,888 OneKey® MLS as Distributed by MLS Grid
- 1987-02-24 Sold (Public Records) $300,000 Public Records
Property tax history
+5.8%/yrLatest (2025): $13,895 · -0.9% YoY. Source: county tax records.
Cash-flow waterfall
monthlySold comps — $/sqft
last 12 mo · ≤1 miLoading sold comps…