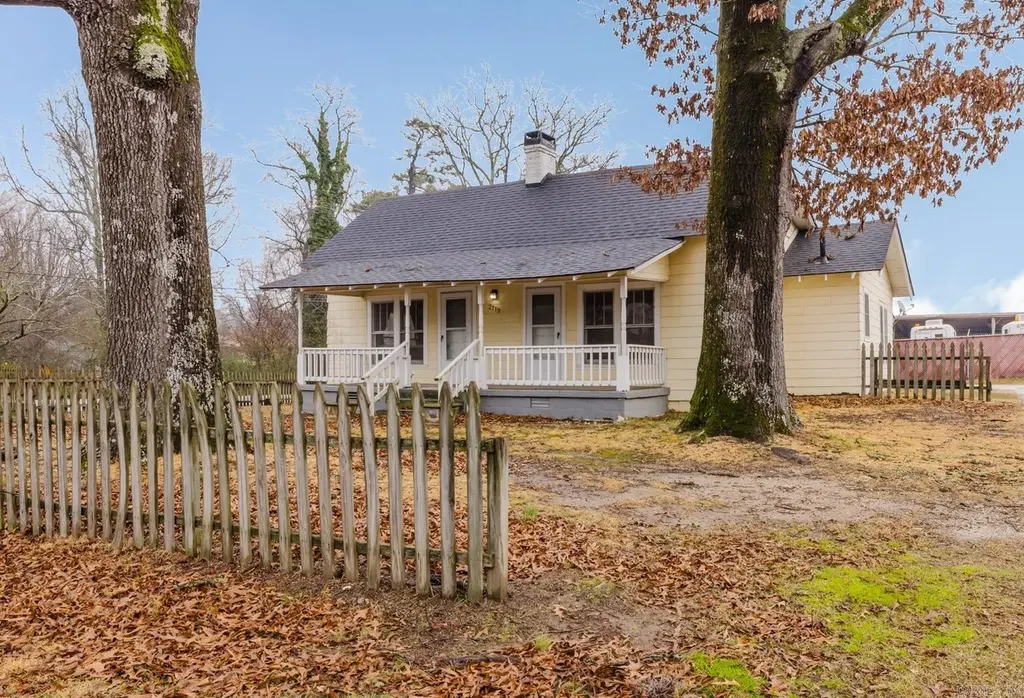
2719 Old Congo Rd · Benton, AR
Flood risk 1/10 · Minimal
- FEMA flood zone
- X (unshaded)
- Chance of flooding over 30 yrs
- 0.0%
- Est. flood insurance / yr
- $507 – $1,088
Fire risk 4/10 · Minor
- Est. fire insurance / yr
- $1,499 – $2,785
Heat risk 6/10 · Moderate
- Hot days now (above 110°F)
- 7 days/yr
- Hot days in 30 yrs
- 19 days/yr
Wind risk 4/10 · Minor
- Chance of severe wind over 30 yrs
- 12.0%
Air-quality risk 2/10 · Minimal
- Unhealthy air days now
- 0 days/yr
- Unhealthy air days in 30 yrs
- 1 days/yr
Risk factors via First Street. Map © Google.
Why this score? — see what drove the D grade
The composite is a weighted blend of 9 inputs, each scored 0–100. Each bar is that input's sub-score; the figure is the points it added to the 100-point composite (weight × sub-score).
- Cash flow +11.8/30.0
- ARV discount +11.8/15.0
- Schools +4.1/10.0
- Rent growth +3.6/5.0
- DSCR +3.5/10.0
- Livability +3.3/5.0
- Condition / age +2.5/5.0
- 1% rule +2.1/10.0
- Appreciation +0.0/10.0
$190,000
🖨 Deal sheet (PDF) 📄 Offer letter ✓ Due diligence
Listing remarks MLS
THIS HOME SITS ON A CORNER LOT WITH GREAT VISIBILITY. THE PROPERTY JUST GOT RECENTLY REZONED FOR COMMERCIAL SO NOT ONLY WOULD IT MAKE A GREAT RESIDENTIAL HOME BUT WOULD ALSO BE A GOOD PROPERTY FOR A SMALL BUSINESS. ROOF WAS REPLACED IN 2022 AND HAS A SMALL STORAGE BUILDING.
Key facts
- Recently rezoned
- Corner lot
- Great visibility
Tags
Neighborhood map
What this means for you Summary
Snapshot
- This is a 2-bed/1.0-bath single-family listed at $190k.
Deal economics
- At list price, monthly cash flow is $-53 ($-641/yr) — negative.
- To cash-flow at today's rent, offer at most $181k (5.0% below list).
- To meet the 1% rule (rent ≥ 1% of price), the offer needs to be $134k (29.5% below list).
- Recommended offer: $134k (29.5% below list) — sets the bar for 1% rule.
- Cap rate 6.0% vs local median 4.4% in Benton — top-decile yield for the area; either an underpriced asset or a hidden risk that comps aren't pricing in. Stress-test before assuming the spread holds.
Location & tenants
- Location reads 66/100 on livability (#119 in AR) — a middle-class / working-renter tenant base. Strengths: cost of living A+, housing A+; Watch: crime D, amenities F, commute F.
- Benton School District (suburban): math 51% / reading 43% proficiency, ranked #25 of 238 in AR (top 10%) — families likely to look elsewhere, expect single-tenant / working-renter base with shorter leases.
- Zoned schools: Benton Middle School (math 54% / reading 40%, grade D+, #46 of 201 statewide, top 24%, 1,367 students, 44% FRL).
- Market conditions: Rents rising fast (+4.5%/yr); 237 active listings in the ZIP; 8 comparable units currently listed for rent nearby; rentals at typical pace (median 25d on market — plan ~3-4 weeks tenant-placement turnaround); solid renter incomes; 446 units permitted in Saline County in 2024 (0 in 5+ unit buildings).
Forward outlook
- Local home prices are declining (-3.0%/yr); year-one equity from $1k of loan paydown is wiped out by about $6k of value loss. Plan a longer hold.
- Saline County population projected at +39% by 2050 — long-run rental-demand tailwind backs the buy-and-hold thesis.
Negotiation context
- It's been on market 149 days — a 12% lower offer ($167k) is reasonable based on typical stale-listing flexibility.
- 5 sale attempts since 4y ago with the ask held roughly flat each time — persistent listings suggest the price (not the market) is what's stuck; bring a comps-based counter.
- Current owner paid $100k; list at $190k implies a 89% gain — meaningful room to come down on a strong offer.
Risks & watch-outs
- Watch-outs: built in 1959 — expect roof / HVAC / electrical / plumbing capex.
- Climate carrying-cost: extreme-heat days projected 7→19/yr by 2055 (HVAC capex compounding) — expect insurance premiums to compound above CPI over the hold.
Questions for the listing agent
- What do current leases actually rent for vs. the listed asking? Can we see a recent rent roll and the last 12 months of T-12 income?
- It's been on market 149 days. Have you received any prior offers? Is the seller open to a 29% concession, seller financing, or rate buy-down credit?
- Built in 1959 — when were the roof, HVAC, electrical panel, plumbing, and water heater last replaced?
- Why hasn't it sold? Are there any deal-killer items the seller is aware of (foundation, flood, title, zoning, code violations)?
- Is there a deadline driving the sale (1031 exchange, divorce, estate, relocation)? That informs how much negotiation room exists.
- Crime grade is D in this area — have there been break-ins, vandalism, or insurance claims at this property in the last 3 years? What carrier currently insures it and at what premium?
- The area grade is low — what's the realistic commute time and amenity access for the typical tenant pool here? Any planned neighborhood developments (good or bad) we should know about?
- What's the average days-on-market for RENTAL listings here right now (not sales)? A rising rental-DOM trend means longer vacancies and softer asking-rent achievability than the comps imply.
- What's the recent tenant-quality profile in this submarket — average credit score on applications, eviction rate, late-payment / NSF rate, and stable-employment percentage? A property-management company in the area should have these aggregated.
- How much new for-sale + rental construction is in the pipeline within 1–3 miles? Heavy new supply typically softens prices + rents 12–24 months out; constrained supply supports both.
Investment metrics
- 1% rule
- 0.71% ✗
- Cap rate
- 5.96%
- Cash-on-cash
- -1.21%
- DSCR
- 0.95
- GRM
- 11.8
CMA / ARV
- ARV (median comp)
- $209,875
- List price
- $190,000
- Delta
- -9.47%
- Verdict
- FAIR
- Comps
- 20 within 1.0 mi
Show comp detail 12 sales within ~0.75 mi
| Address | Dist | Beds/Ba | Sqft | Sold | Price | $/sf | Match |
|---|---|---|---|---|---|---|---|
| 2705 Ranchwood Dr | 0.07mi | 3/2.0 (+1) | 1,200 (+1%) | 10mo | $205,000 | $171 | 78 |
| 2318 Sunnyvale Rd | 0.52mi | 2/1.5 | 1,288 (+8%) | 1mo | $150,000 | $116 | 59 |
| 2814 Gage Dr | 0.67mi | 3/2.0 (+1) | 1,202 (+1%) | 6mo | $190,000 | $158 | 53 |
| 794 Gussy Ln | 0.35mi | 3/2.0 (+1) | 1,355 (+14%) | 1mo | $211,900 | $156 | 51 |
| 818 Gussy Ln | 0.34mi | 3/2.0 (+1) | 1,355 (+14%) | 2mo | $209,900 | $155 | 50 |
| 16 Hickory Ridge Dr | 0.62mi | 3/2.0 (+1) | 1,226 (+3%) | 8mo | $204,000 | $166 | 50 |
| 422 Sharon Oaks Ct | 0.63mi | 3/2.0 (+1) | 1,220 (+3%) | 12mo | $200,500 | $164 | 47 |
| 1309 Troy Dr | 0.51mi | 3/2.0 (+1) | 1,064 (-10%) | 8mo | $155,000 | $146 | 43 |
| 3002 Frendall Dr | 0.38mi | 3/2.0 (+1) | 1,330 (+12%) | 12mo | $195,000 | $147 | 43 |
| 2902 Pamela Dr | 0.74mi | 3/1.5 (+1) | 1,143 (-4%) | 13mo | $155,000 | $136 | 41 |
| 2908 Frendall Dr | 0.37mi | 3/2.0 (+1) | 1,340 (+13%) | 15mo | $199,900 | $149 | 40 |
| 2818 Gage Dr | 0.67mi | 3/2.0 (+1) | 1,272 (+7%) | 11mo | $192,500 | $151 | 39 |
Match score weights: distance 35% · size 25% · config 20% · recency 20%. Top-matched comps best support the ARV.
Projected returns pro-forma
-3.0% appreciation · 4.53% rent growth · sell at horizon
- IRR
- -16.9%
- Equity multiple
- 0.39×
- Total profit
- $-32,202
- Equity at exit
- $28,330
- IRR
- -6.7%
- Equity multiple
- 0.55×
- Total profit
- $-23,979
- Equity at exit
- $16,428
Cash invested: $53,200 (down + closing). Projections, not guarantees.
Landlord ↔ Tenant lean methodology
- Overall (STATE)
- 92 Strongly Landlord-Friendly
- State Arkansas
- 92 Strongly Landlord-Friendly · R+14
- County
- — inherits STATE
- City
- — inherits STATE
ZIP-level market 72019
- Home prices YoY
- -12.2%
- Rents YoY
- 4.5%
- Active inventory
- 237
- Price-to-rent
- 11.8×
Monthly cashflow live
- Estimated rent
- $1,340 high interval (Pro) →
- Mortgage (P&I)
- −$996
- Tax from tax record
- −$36 /mo · $436/yr
- Insurance
- −$79
- HOA
- −$0
- Vacancy / Maint / Mgmt
- −$281
- Net cashflow
- $-53
Break-even live
Sensitivity live
| Price | -10% $54 | -5% $0 | +0% $-53 | +5% $-107 | +10% $-161 |
|---|---|---|---|---|---|
| Rent | -10% $-159 | -5% $-106 | +0% $-53 | +5% $-1 | +10% $52 |
| Rate | -1.0pp $42 | -0.5pp $-5 | base $-53 | +0.5pp $-103 | +1.0pp $-153 |
UW: 25.0% down · 7.5% · 30yr · 1.5% tax · 5.0% vac · 8.0% maint · 8.0% mgmt
Financing live
Cash to close
- Down payment
- $47,500
- Closing costs
- $5,700
- Reserves months
- —
- Total cash needed
- —
Loan-product check · same deal, 3 products live
Conventional
25% down · 7.5% · 30yr
- Down + closing
- —
- Monthly P&I
- —
- Monthly cashflow
- —
- DSCR
- —
- Eligible?
- —
Personal DTI + credit; lowest rate.
DSCR
20% down · 8.5% · 30yr
- Down + closing
- —
- Monthly P&I
- —
- Monthly cashflow
- —
- DSCR
- —
- Eligible?
- —
No personal income docs; deal must DSCR.
Hard money
10% down · 12.0% · 12mo
- Down + closing
- —
- Monthly P&I
- —
- Monthly cashflow
- —
- DSCR
- —
- Eligible?
- —
Short-term bridge; refi at stabilization.
Rent comps 8 comps
| Address | Beds | Baths | Sqft | Rent | $/sqft | DOM | Units | Dist |
|---|---|---|---|---|---|---|---|---|
| 3011 Congo Rd Benton, AR | 1.0–2.0 | 1.0 | 610 | $805 | $1.32 | 16d | 1 | 0.28mi |
| 1205 Copper Creek Dr Benton, AR | 3.0 | 2.0 | 1056 | $1,400 | $1.33 | 45d | 1 | 0.47mi |
| 3537 Terrace Hill Ct Benton, AR | 3.0 | 2.0 | 1290 | $1,500 | $1.16 | 25d | 1 | 0.56mi |
| 1818 Watts Rd Benton, AR | 3.0 | 2.0 | 1178 | $1,325 | $1.12 | 16d | 1 | 0.68mi |
| 3002 Oakbrook Benton, AR | 3.0 | 2.0 | 1408 | $1,515 | $1.08 | 45d | 1 | 1.21mi |
| 2600 Longhills Rd E Benton, AR | 1.0–2.0 | 1.0–2.0 | 818 | $1,255 | $1.53 | 16d | 1 | 1.23mi |
| 40 Hiland Pl Unit B Benton, AR | 2.0 | 1.0 | 780 | $923 | $1.18 | 25d | 1 | 1.37mi |
| 624 Denton Benton, AR | 2.0 | 1.0 | 1092 | $1,200 | $1.10 | 45d | 1 | 1.47mi |
Listing history 30 events
-
2026-06-22days on market $190,000 Active 149 DOM
-
2026-06-18days on market $190,000 Active 146 DOM
-
2026-06-17days on market $190,000 Active 145 DOM
-
2026-06-16days on market $190,000 Active 144 DOM
-
2026-06-15days on market $190,000 Active 143 DOM
-
2026-06-14days on market $190,000 Active 141 DOM
-
2026-06-13days on market $190,000 Active 140 DOM
-
2026-06-10days on market $190,000 Active 138 DOM
-
2026-06-09days on market $190,000 Active 137 DOM
-
2026-06-08days on market $190,000 Active 136 DOM
-
2026-06-07days on market $190,000 Active 135 DOM
-
2026-06-03days on market $190,000 Active 131 DOM
-
2026-06-02days on market $190,000 Active 130 DOM
-
2026-06-01days on market $190,000 Active 129 DOM
-
2026-05-31days on market $190,000 Active 128 DOM
-
2026-05-31days on market $190,000 Active 127 DOM
-
2026-01-23$190,000 Active 274-char remark
Show marketing remark (274 chars)
THIS HOME SITS ON A CORNER LOT WITH GREAT VISIBILITY. THE PROPERTY JUST GOT RECENTLY REZONED FOR COMMERCIAL SO NOT ONLY WOULD IT MAKE A GREAT RESIDENTIAL HOME BUT WOULD ALSO BE A GOOD PROPERTY FOR A SMALL BUSINESS. ROOF WAS REPLACED IN 2022 AND HAS A SMALL STORAGE BUILDING.
-
2026-01-23$190,000 New Listing 274-char remark
Show marketing remark (274 chars)
THIS HOME SITS ON A CORNER LOT WITH GREAT VISIBILITY. THE PROPERTY JUST GOT RECENTLY REZONED FOR COMMERCIAL SO NOT ONLY WOULD IT MAKE A GREAT RESIDENTIAL HOME BUT WOULD ALSO BE A GOOD PROPERTY FOR A SMALL BUSINESS. ROOF WAS REPLACED IN 2022 AND HAS A SMALL STORAGE BUILDING.
-
2026-01-09historical
-
2025-09-15$240,000 New Listing
-
2022-12-30soldstatus $100,500
-
2022-12-29soldstatus $100,500 Sold
-
2022-12-22price $92,000
-
2022-12-22status Under Con. Before Listed
-
2022-12-22status Price Change
-
2022-11-02historical
-
2022-10-04$99,900
-
2008-08-07soldstatus $85,000
-
2005-08-02soldstatus $58,000
-
2005-08-02soldstatus $76,000
ⓘ Source: listings_history table (triggers on properties + properties_extension) + one-shot
backfill from property_details.listing_events for pre-trigger history.
Tax reassessment forecast AR · Resets to sale price
- Current annual tax
- $436 · $36/mo
- Projected year-2 tax
- $1,216 · $101/mo
- Expected delta
- +$780/yr (+$65/mo · 178.6%)
ⓘ Screening estimate from a state-policy table — verify with the county assessor before closing.
Climate risk First Street
- Flood 1/10 Low FEMA zone X (unshaded) · 0% chance over 30 yrs
- Wildfire 4/10 Moderate
- Heat 6/10 Major 7 d/yr ≥110°F today · 19 d/yr by 30 yrs out
- Wind 4/10 Moderate 12% chance of damaging wind over 30 yrs
- Air quality 2/10 Low 0 unhealthy d/yr today · 1 by 30 yrs out
Nearby sold comps map
Loading sold comps map…
Walkable amenities ~0.75 mi
Loading nearby amenities…
Taxation est. · year 1
- Rental income
- $16,078
- − Mortgage interest
- −$10,643
- − Property taxes
- −$436
- − Insurance
- −$950
- − Repairs & maintenance
- −$1,286
- − Management
- −$1,286
- − Depreciation
- −$5,527
- Taxable loss
- −$4,051
- Est. tax savings @ 24.0%
- +$972
- After-tax cash flow
- $331/yr
For passive investors: Depreciation is non-cash, so a rental often shows a tax loss while cash-flowing — sheltering income. Rental losses are passive: they offset passive income freely, and up to $25,000/yr can offset ordinary (W-2) income if you actively participate and your MAGI is under $100k (phasing out to $0 by $150k); unused losses carry forward. On sale, claimed depreciation is recaptured at up to 25%, and gains may owe capital-gains tax (a 1031 exchange can defer both). Figures are a year-1 estimate at your 24.0% rate — not tax advice; consult a CPA.
Schools (NCES district)
- District
- Benton School District
- NCES district ID
- 0502960
- Math proficiency
- 51% ▼ -10.00%
- Reading proficiency
- 43% ▼ -10.00%
- Median HH income
- $51,870
- Composite
- 40.52/100
- National rank
- #3707
- State rank
- #25 of 238 in AR
Livability — Benton
- Score
- 66/100
- State rank
- #119
- US rank
- #11460
Category grades
Schools grade is shown separately in the Schools card above.
Census & demographics
- Census place
- Benton, AR
- County
- Saline County · 77,216 people
- City population
- 58,767
- Metro
- Little Rock-North Little Rock-Conway, AR
- Population (ZIP)
- 30,055
- Household income
- $87,869
- Rent vs Own
- Severe rent burden
- 331.0
Population outlook (Saline County) Hauer SSP2
- Today (2025)
- 140,141 people
- By 2030
- 151,233 · +7.9%
- By 2040
- 173,100 · +23.5%
- By 2050
- 194,368 · +38.7%
- By 2075
- 245,295 · +75.0%
- By 2100
- 279,117 · +99.2%
Race, ethnicity, and origin ACS 2023
- Neighborhood character
- Predominantly White (83%)
- Race & ethnicity
- White 83% Hispanic / Latino 8% Two or more races 5% Black 3% Asian 2%
- Hispanic origin (detail)
- Mexican 6%
- Common ancestry
- Italian 3% Slovak 2% Lithuanian 2%
- Foreign-born
- 3% · Canada, China, Vietnam
- Languages at home
- 92% English-only · Spanish 6% Vietnamese 1%
Political lean MEDSL · Saline
- 2024 margin
- Solid R (+40.1) · D 28.8% · R 69.0% · Other 2.2%
- 2008→2024 swing
- +0.8pp no change · 2008: -41.0pp · 2024: -40.1pp
- All cycles
- 2024: R+40.1 2020: R+41.2 2016: R+43.5 2012: R+42.7 2008: R+41.0
Not yet ingested
- Civics
- —
Market trends
- HPI YoY
- ▼ -29.95%
- Current HPI
- 215.1912
- Rent YoY
- ▲ 4.53%
- Metro
- Little Rock-North Little Rock-Conway, AR
- State GDP YoY
- ▲ 3.80%
- F500 in state
- 10
Industry mix (Fortune 500 HQ in AR)
| Industry | F500 HQs | Revenue |
|---|---|---|
| Retail | 1 | $681B |
|
||
| Food / Agriculture | 1 | $53B |
|
||
| Retail / Energy | 1 | $22B |
|
||
| Transportation / Logistics | 1 | $12B |
|
||
| Energy | 1 | $4B |
|
||
Price history
+227.6% since first listed14 events — show timeline
- 2026-01-23 Listed $190,000 HSBOR
- 2026-01-23 Listed $190,000 CARMLS
- 2026-01-09 Listing Removed — CARMLS
- 2025-09-15 Listed $240,000 CARMLS
- 2022-12-30 Sold (Public Records) $100,500 Public Records
- 2022-12-29 Sold (MLS) $100,500 CARMLS
- 2022-12-22 Price Changed $92,000 CARMLS
- 2022-12-22 Pending — CARMLS
- 2022-12-22 Relisted — CARMLS
- 2022-11-02 Listing Removed — CARMLS
- 2022-10-04 Listed $99,900 CARMLS
- 2008-08-07 Sold (Public Records) $85,000 Public Records
- 2005-08-02 Sold (Public Records) $76,000 Public Records
- 2005-08-02 Sold (Public Records) $58,000 Public Records
Property tax history
-2.9%/yrLatest (2025): $436 · -18.6% YoY. Source: county tax records.
Cash-flow waterfall
monthlySold comps — $/sqft
last 12 mo · ≤1 miLoading sold comps…