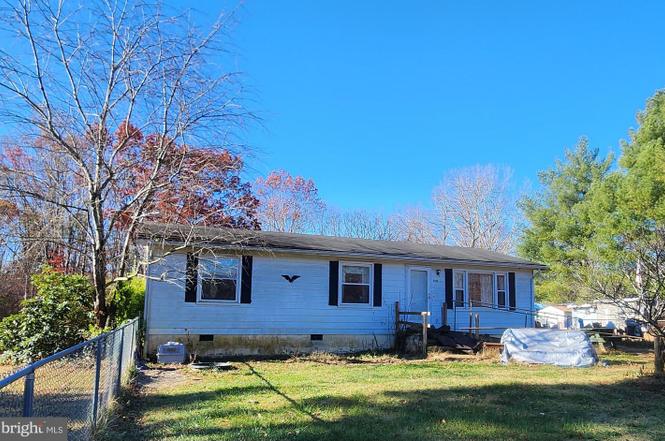
2430 Jefferson Hwy · Louisa, VA
Flood risk 1/10 · Minimal
- FEMA flood zone
- X (unshaded)
- Chance of flooding over 30 yrs
- 0.0%
- Est. flood insurance / yr
- $507 – $1,088
Fire risk 4/10 · Minor
- Est. fire insurance / yr
- $666 – $1,236
Heat risk 7/10 · Major
- Hot days now (above 106°F)
- 7 days/yr
- Hot days in 30 yrs
- 17 days/yr
Wind risk 3/10 · Minor
- Chance of severe wind over 30 yrs
- 8.0%
Air-quality risk 1/10 · Minimal
- Unhealthy air days now
- 0 days/yr
- Unhealthy air days in 30 yrs
- 0 days/yr
Risk factors via First Street. Map © Google.
Why this score? — see what drove the D grade
The composite is a weighted blend of 9 inputs, each scored 0–100. Each bar is that input's sub-score; the figure is the points it added to the 100-point composite (weight × sub-score).
- Cash flow +16.9/30.0
- Schools +6.0/10.0
- DSCR +5.2/10.0
- 1% rule +3.7/10.0
- Livability +3.6/5.0
- Rent growth +2.5/5.0
- Condition / age +2.5/5.0
- ARV discount +0.0/15.0
- Appreciation +0.0/10.0
$201,300
🖨 Deal sheet 📄 Offer letter ✓ Due diligence
Listing remarks
Calling cash buyers who can think out of the box to purchase these 3 acres, just a quick 3-mile drive from the Town of Louisa. This cozy home features 3 bedrooms and 1 full bathroom. The layout includes an eat-in kitchen, laundry and a den. The exterior is a true asset, boasting a securely fenced front yard for children or pets, plus the convenience of multiple outbuildings providing ample storage or workshop potential. With its ideal location offering country serenity and close proximity to town amenities, this property is poised to be an excellent investment and place to call home.
Key facts
- Eat-in kitchen
- Fenced front yard
- Den
Tags
Neighborhood map
What this means for you Summary
Snapshot
- This is a 2-bed/1.5-bath single-family listed at $201k.
Deal economics
- At list price, monthly cash flow is $132 ($2k/yr) — positive.
- The deal already cash-flows at list — no discount required.
- To meet the 1% rule (rent ≥ 1% of price), the offer needs to be $175k (13.0% below list).
- Recommended offer: $175k (13.0% below list) — sets the bar for 1% rule.
- Cap rate 7.1% vs local median 2.8% in Louisa — top-decile yield for the area; either an underpriced asset or a hidden risk that comps aren't pricing in. Stress-test before assuming the spread holds.
Location & tenants
- Location reads 72/100 on livability (#199 in VA) — a middle-class / working-renter tenant base. Strengths: health & safety A+, cost of living A, crime A-; Watch: housing D+, amenities F, commute F.
- Louisa County Public School District (rural): math 64% / reading 77% proficiency, ranked #19 of 131 in VA (top 14%) — strong family-tenant draw, lease renewals of 3-5y typical.
- Zoned schools: Thomas Jefferson Elementary (math 59% / reading 72%, grade B+, #410 of 1,108 statewide, top 37%, 632 students, 84% FRL); Louisa County Middle (math 59% / reading 76%, grade A-, #98 of 342 statewide, top 30%, 1,152 students, 64% FRL); Louisa County High (math 86% / reading 92%, grade A+, #10 of 319 statewide, top 3%, 1,653 students, 63% FRL) — zoned schools average 70% FRL vs 38% district-wide (32 pts higher); higher-poverty schools than district average — tighter screening recommended.
- Market conditions: 184 active listings in the ZIP; 408 units permitted in Louisa County in 2024 (0 in 5+ unit buildings).
Forward outlook
- Local home prices are declining (-3.0%/yr); year-one equity from $1k of loan paydown is wiped out by about $6k of value loss. Plan a longer hold.
- Louisa County population projected at +4% by 2050 — modest demand growth; plan on rents tracking national, not racing it.
Negotiation context
- It's been on market 81 days — a 6% lower offer ($189k) is reasonable based on typical stale-listing flexibility.
- 4 sale attempts since 18y ago with the ask held roughly flat each time — persistent listings suggest the price (not the market) is what's stuck; bring a comps-based counter.
Risks & watch-outs
- Watch-outs: built in 1953 — expect roof / HVAC / electrical / plumbing capex.
- Climate carrying-cost: extreme-heat days projected 7→17/yr by 2055 (HVAC capex compounding) — expect insurance premiums to compound above CPI over the hold.
Questions for the listing agent
- It's been on market 81 days. Have you received any prior offers? Is the seller open to a 13% concession, seller financing, or rate buy-down credit?
- Built in 1953 — when were the roof, HVAC, electrical panel, plumbing, and water heater last replaced?
- Why hasn't it sold? Are there any deal-killer items the seller is aware of (foundation, flood, title, zoning, code violations)?
- Is there a deadline driving the sale (1031 exchange, divorce, estate, relocation)? That informs how much negotiation room exists.
- Schools are B-rated — typically a magnet for longer-tenancy family renters. What's the average tenant stay here, and is there a school-zone premium baked into asking?
- The area grade is low — what's the realistic commute time and amenity access for the typical tenant pool here? Any planned neighborhood developments (good or bad) we should know about?
- What's the average days-on-market for RENTAL listings here right now (not sales)? A rising rental-DOM trend means longer vacancies and softer asking-rent achievability than the comps imply.
- What's the recent tenant-quality profile in this submarket — average credit score on applications, eviction rate, late-payment / NSF rate, and stable-employment percentage? A property-management company in the area should have these aggregated.
- How much new for-sale + rental construction is in the pipeline within 1–3 miles? Heavy new supply typically softens prices + rents 12–24 months out; constrained supply supports both.
Investment metrics
- 1% rule
- 0.87% ✗
- Cap rate
- 7.08%
- Cash-on-cash
- 2.81%
- DSCR
- 1.12
- GRM
- 9.6
CMA / ARV
- ARV (on-the-fly)
- $160,512
- Comps found
- 1
Show comp detail 1 sale within ~0.75 mi
| Address | Dist | Beds/Ba | Sqft | Sold | Price | $/sf | Match |
|---|---|---|---|---|---|---|---|
| 2430 Jefferson Hwy | 0.00mi | 3/1.0 (+1) | 1,056 (0%) | 1mo | $160,000 | $152 | 92 |
Match score weights: distance 35% · size 25% · config 20% · recency 20%. Top-matched comps best support the ARV.
Projected returns pro-forma
-3.0% appreciation · 3.0% rent growth · sell at horizon
- IRR
- -11.9%
- Equity multiple
- 0.57×
- Total profit
- $-24,277
- Equity at exit
- $30,014
- IRR
- -2.8%
- Equity multiple
- 0.81×
- Total profit
- $-10,563
- Equity at exit
- $17,405
Cash invested: $56,364 (down + closing). Projections, not guarantees.
Landlord ↔ Tenant lean methodology
- Overall (STATE)
- 55 Moderately Landlord-Leaning
- State Virginia
- 55 Moderately Landlord-Leaning · D+2
- County
- — inherits STATE
- City
- — inherits STATE
ZIP-level market 23093
- Home prices YoY
- -15.0%
- Active inventory
- 184
- Price-to-rent
- 9.6×
Monthly cashflow live
- Estimated rent
- $1,751 medium interval (Pro) →
- Mortgage (P&I)
- −$1,056
- Tax from tax record
- −$112 /mo · $1,346/yr
- Insurance
- −$84
- HOA
- −$0
- Vacancy / Maint / Mgmt
- −$368
- Net cashflow
- $132
Break-even live
UW: 25.0% down · 7.5% · 30yr · 1.5% tax · 5.0% vac · 8.0% maint · 8.0% mgmt
Financing live
Cash to close
- Down payment
- $50,325
- Closing costs
- $6,039
- Reserves months
- —
- Total cash needed
- —
Loan-product check · same deal, 3 products live
Conventional
25% down · 7.5% · 30yr
- Down + closing
- —
- Monthly P&I
- —
- Monthly cashflow
- —
- DSCR
- —
- Eligible?
- —
Personal DTI + credit; lowest rate.
DSCR
20% down · 8.5% · 30yr
- Down + closing
- —
- Monthly P&I
- —
- Monthly cashflow
- —
- DSCR
- —
- Eligible?
- —
No personal income docs; deal must DSCR.
Hard money
10% down · 12.0% · 12mo
- Down + closing
- —
- Monthly P&I
- —
- Monthly cashflow
- —
- DSCR
- —
- Eligible?
- —
Short-term bridge; refi at stabilization.
Listing history 7 events
-
2026-04-28status Pending
-
2026-02-06$201,300 Active
-
2026-01-31historical
-
2026-01-13status Active
-
2026-01-07status Pending
-
2025-12-31$204,750 Active
-
2008-01-10$129,900
ⓘ Source: listings_history table (triggers on properties + properties_extension) + one-shot
backfill from property_details.listing_events for pre-trigger history.
Tax reassessment forecast VA · Resets to sale price
- Current annual tax
- $1,346 · $112/mo
- Projected year-2 tax
- $1,651 · $138/mo
- Expected delta
- +$304/yr (+$25/mo · 22.6%)
ⓘ Screening estimate from a state-policy table — verify with the county assessor before closing.
Climate risk First Street
- Flood 1/10 Low FEMA zone X (unshaded) · 0% chance over 30 yrs
- Wildfire 4/10 Moderate
- Heat 7/10 Severe 7 d/yr ≥106°F today · 17 d/yr by 30 yrs out
- Wind 3/10 Moderate 8% chance of damaging wind over 30 yrs
- Air quality 1/10 Low 0 unhealthy d/yr today · 0 by 30 yrs out
Nearby sold comps map
Loading sold comps map…
Walkable amenities ~0.75 mi
Loading nearby amenities…
Taxation est. · year 1
- Rental income
- $21,017
- − Mortgage interest
- −$11,276
- − Property taxes
- −$1,346
- − Insurance
- −$1,006
- − Repairs & maintenance
- −$1,681
- − Management
- −$1,681
- − Depreciation
- −$5,856
- Taxable loss
- −$1,831
- Est. tax savings @ 24.0%
- +$439
- After-tax cash flow
- $2,022/yr
For passive investors: Depreciation is non-cash, so a rental often shows a tax loss while cash-flowing — sheltering income. Rental losses are passive: they offset passive income freely, and up to $25,000/yr can offset ordinary (W-2) income if you actively participate and your MAGI is under $100k (phasing out to $0 by $150k); unused losses carry forward. On sale, claimed depreciation is recaptured at up to 25%, and gains may owe capital-gains tax (a 1031 exchange can defer both). Figures are a year-1 estimate at your 24.0% rate — not tax advice; consult a CPA.
Schools (NCES district)
- District
- Louisa County Public School District
- NCES district ID
- 5102280
- Math proficiency
- 64% ▼ -21.00%
- Reading proficiency
- 77% ▬ 0.00%
- Median HH income
- $55,036
- Composite
- 60.21/100
- National rank
- #862
- State rank
- #19 of 131 in VA
Livability — Louisa
- Score
- 72/100
- State rank
- #199
- US rank
- #6156
Category grades
Schools grade is shown separately in the Schools card above.
Census & demographics
- Population (ZIP)
- 14,243
Population outlook (Louisa County) Hauer SSP2
- Today (2025)
- 36,941 people
- By 2030
- 37,752 · +2.2%
- By 2040
- 38,605 · +4.5%
- By 2050
- 38,480 · +4.2%
- By 2075
- 38,011 · +2.9%
- By 2100
- 34,748 · -5.9%
Race, ethnicity, and origin ACS 2023
- Neighborhood character
- Predominantly White (71%)
- Race & ethnicity
- White 71% Black 17% Two or more races 8% Hispanic / Latino 3%
- Common ancestry
- Lithuanian 3% Slovak 3% Italian 3%
- Foreign-born
- 4% · Canada
- Languages at home
- 94% English-only · Other Indo-European 3% Spanish 2%
Political lean MEDSL · Louisa
- 2024 margin
- Strong R (+26.2) · D 36.5% · R 62.7%
- 2008→2024 swing
- -18.4pp toward R · 2008: -7.8pp · 2024: -26.2pp
- All cycles
- 2024: R+26.2 2020: R+22.9 2016: R+24.6 2012: R+13.8 2008: R+7.8
Not yet ingested
- Civics
- —
Market trends
- HPI YoY
- ▼ -38.32%
- Current HPI
- 217.8884
- Rent YoY
- —
- Metro
- —
- State GDP YoY
- ▲ 2.40%
- F500 in state
- 50
Industry mix (Fortune 500 HQ in VA)
| Industry | F500 HQs | Revenue |
|---|---|---|
| Aerospace / Defense | 4 | $236B |
|
||
| Technology / Defense | 3 | $32B |
|
||
| Financial Services | 2 | $176B |
|
||
| Utilities | 2 | $27B |
|
||
| Insurance | 2 | $25B |
|
||
| Technology | 2 | $15B |
|
||
Price history
+55.0% since first listed7 events — show timeline
- 2026-04-28 Pending — BRIGHT MLS
- 2026-02-06 Listed $201,300 BRIGHT MLS
- 2026-01-31 Listing Removed — BRIGHT MLS
- 2026-01-13 Relisted — BRIGHT MLS
- 2026-01-07 Pending — BRIGHT MLS
- 2025-12-31 Listed $204,750 BRIGHT MLS
- 2008-01-10 Listed $129,900 CAAR
Property tax history
+7.7%/yrLatest (2024): $1,346 · +15.5% YoY. Source: county tax records.
Cash-flow waterfall
monthlySold comps — $/sqft
last 12 mo · ≤1 miLoading sold comps…