 🏗️ New Construction
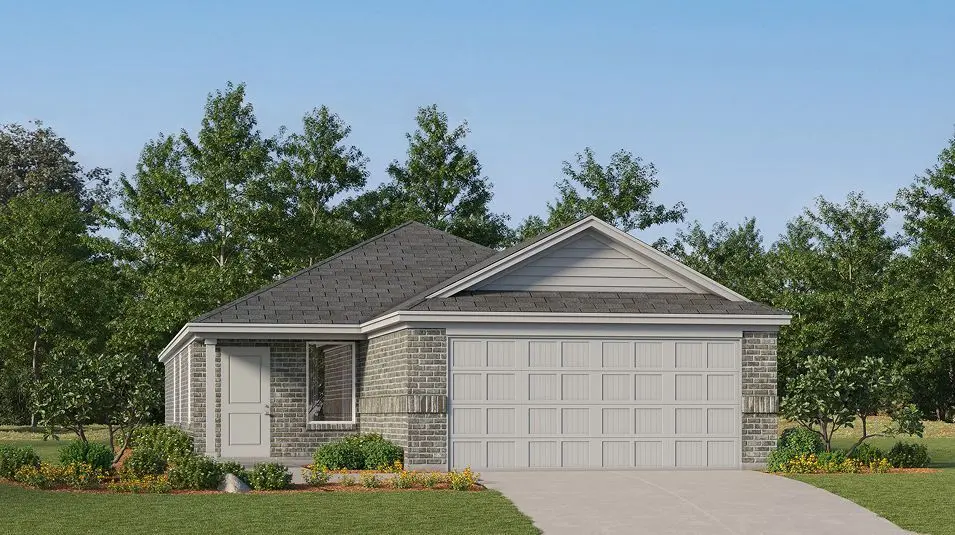
Sentosa Plan · Howe, TX
Flood risk No data
- FEMA flood zone
- —
- Chance of flooding over 30 yrs
- —
- Est. flood insurance / yr
- —
Fire risk No data
- Est. fire insurance / yr
- —
Heat risk No data
- Hot days now (above threshold)
- —
- Hot days in 30 yrs
- —
Wind risk No data
- Chance of severe wind over 30 yrs
- —
Air-quality risk No data
- Unhealthy air days now
- —
- Unhealthy air days in 30 yrs
- —
Risk factors via First Street. Map © Google.
Why this score? — see what drove the F grade
The composite is a weighted blend of 9 inputs, each scored 0–100. Each bar is that input's sub-score; the figure is the points it added to the 100-point composite (weight × sub-score).
- ARV discount +7.5/15.0
- Cash flow +5.7/30.0
- Schools +4.3/10.0
- Livability +3.5/5.0
- Rent growth +2.5/5.0
- Condition / age +2.5/5.0
- 1% rule +1.2/10.0
- DSCR +0.1/10.0
- Appreciation +0.0/10.0
$247,999
🖨 Deal sheet (PDF) 📄 Offer letter ✓ Due diligence
Listing remarks MLS
This new home offers simple living with a convenient single-level layout. An open-concept floorplan combines the kitchen, living and dining areas for simple entertaining and multitasking. Three secondary bedrooms are tucked away to the side of the home, and the owner's suite is nestled into a private rear corner, offering access to a spa-inspired bathroom and walk-in closet.
Key facts
- Walk-in closet
- Single-level layout
- 2 garage spots
Tags
Neighborhood map
What this means for you Summary
Snapshot
- This is a 4-bed/2.0-bath single-family listed at $248k.
Deal economics
- At list price, monthly cash flow is $-607 ($-7k/yr) — negative.
- To cash-flow at today's rent, offer at most $211k (14.9% below list).
- To meet the 1% rule (rent ≥ 1% of price), the offer needs to be $185k (25.5% below list).
- Recommended offer: $185k (25.5% below list) — sets the bar for 1% rule.
Location & tenants
- Location reads 70/100 on livability (#368 in TX) — a middle-class / working-renter tenant base. Strengths: crime A+, cost of living A+, housing A+; Watch: amenities F, commute F, health & safety F.
- Howe ISD (rural): math 47% / reading 51% proficiency, ranked #180 of 826 in TX (top 22%) — families likely to look elsewhere, expect single-tenant / working-renter base with shorter leases.
- Zoned schools: Summit Hill El (358 students, 69% FRL); Howe Middle (math 40% / reading 45%, grade D-, #553 of 1,662 statewide, top 34%, 292 students, 49% FRL); Howe H S (math 52% / reading 62%, grade C, #333 of 1,632 statewide, top 22%, 352 students, 41% FRL).
- Market conditions: 143 active listings in the ZIP; 9 comparable units currently listed for rent nearby; rentals lingering (median 46d on market — plan ~5-8 weeks vacancy on turnover, expect pricing pressure); 67% of comp listings sitting > 30 days — soft ceiling on asking rent; 2,272 units permitted in Grayson County in 2024 (750 in 5+ unit buildings).
Forward outlook
- Local home prices are declining (-3.0%/yr); year-one equity from $2k of loan paydown is wiped out by about $9k of value loss. Plan a longer hold.
- Grayson County population projected at +12% by 2050 — modest demand growth; plan on rents tracking national, not racing it.
Negotiation context
- It's been on market 295 days — a 12% lower offer ($218k) is reasonable based on typical stale-listing flexibility.
Questions for the listing agent
- What do current leases actually rent for vs. the listed asking? Can we see a recent rent roll and the last 12 months of T-12 income?
- It's been on market 295 days. Have you received any prior offers? Is the seller open to a 26% concession, seller financing, or rate buy-down credit?
- Why hasn't it sold? Are there any deal-killer items the seller is aware of (foundation, flood, title, zoning, code violations)?
- Is there a deadline driving the sale (1031 exchange, divorce, estate, relocation)? That informs how much negotiation room exists.
- Schools are D-rated, which usually means shorter tenancies and higher turnover. Who's the typical renter profile here, and what's been the actual vacancy rate?
- The area grade is low — what's the realistic commute time and amenity access for the typical tenant pool here? Any planned neighborhood developments (good or bad) we should know about?
- What's the average days-on-market for RENTAL listings here right now (not sales)? A rising rental-DOM trend means longer vacancies and softer asking-rent achievability than the comps imply.
- What's the recent tenant-quality profile in this submarket — average credit score on applications, eviction rate, late-payment / NSF rate, and stable-employment percentage? A property-management company in the area should have these aggregated.
- How much new for-sale + rental construction is in the pipeline within 1–3 miles? Heavy new supply typically softens prices + rents 12–24 months out; constrained supply supports both.
Investment metrics
- 1% rule
- 0.62% ✗
- Cap rate
- 3.86%
- Cash-on-cash
- -8.70%
- DSCR
- 0.61
- GRM
- 13.5
CMA / ARV
- ARV (median comp)
- $299,000
- List price
- $247,999
- Delta
- -17.06%
- Verdict
- UNDERPRICED
- Comps
- 20 within 1.0 mi
Show comp detail 12 sales within ~0.75 mi
| Address | Dist | Beds/Ba | Sqft | Sold | Price | $/sf | Match |
|---|---|---|---|---|---|---|---|
| 1808 Douglas St | 0.18mi | 4/2.0 | 1,666 (+2%) | 1mo | $249,000 | $149 | 87 |
| 1625 Elliot Rd | 0.21mi | 4/2.0 | 1,656 (+2%) | 2mo | $225,399 | $136 | 86 |
| 1317 Elliott Rd | 0.18mi | 3/2.0 (-1) | 1,589 (-2%) | 1mo | $268,490 | $169 | 82 |
| 904 Cole St | 0.15mi | 3/2.0 (-1) | 1,461 (-10%) | 1mo | $232,999 | $159 | 70 |
| 916 Cole St | 0.15mi | 4/2.0 | 1,867 (+14%) | 1mo | $267,999 | $144 | 68 |
| 900 Cole St | 0.15mi | 4/2.0 | 1,867 (+14%) | 2mo | $272,999 | $146 | 68 |
| 1640 Elliott Rd | 0.21mi | 3/2.0 (-1) | 1,451 (-11%) | 1mo | $216,199 | $149 | 66 |
| 1616 Elliott Rd | 0.21mi | 3/2.0 (-1) | 1,461 (-10%) | 2mo | $223,999 | $153 | 66 |
| 1629 Elliott Rd | 0.21mi | 3/2.0 (-1) | 1,451 (-11%) | 2mo | $219,999 | $152 | 65 |
| 1325 Elliott Rd | 0.18mi | 3/2.0 (-1) | 1,429 (-12%) | 1mo | $258,990 | $181 | 65 |
| 905 Cole St | 0.22mi | 4/2.0 | 1,867 (+14%) | 1mo | $260,549 | $140 | 65 |
| 808 N Hughes St | 0.68mi | 3/3.0 (-1) | 1,444 (-11%) | 2mo | $180,000 | $125 | 39 |
Match score weights: distance 35% · size 25% · config 20% · recency 20%. Top-matched comps best support the ARV.
Projected returns pro-forma
-3.0% appreciation · 3.0% rent growth · sell at horizon
- IRR
- -31.7%
- Equity multiple
- -0.04×
- Total profit
- $-87,083
- Equity at exit
- $44,582
- IRR
- -35.8%
- Equity multiple
- -0.50×
- Total profit
- $-125,499
- Equity at exit
- $25,852
Cash invested: $83,720 (down + closing). Projections, not guarantees.
Landlord ↔ Tenant lean methodology
- Overall (STATE)
- 87 Strongly Landlord-Friendly
- State Texas
- 87 Strongly Landlord-Friendly · R+5
- County
- — inherits STATE
- City
- — inherits STATE
ZIP-level market 75459
- Home prices YoY
- -18.5%
- Active inventory
- 143
- Price-to-rent
- 11.2×
Monthly cashflow live
- Estimated rent
- $1,847 high interval (Pro) →
- Mortgage (P&I)
- −$1,568
- Tax est. 1.5%
- −$374 /mo · $4,485/yr
- Insurance
- −$125
- HOA
- −$0
- Vacancy / Maint / Mgmt
- −$388
- Net cashflow
- $-607
Break-even live
Sensitivity live
| Price | -10% $-400 | -5% $-504 | +0% $-607 | +5% $-710 | +10% $-814 |
|---|---|---|---|---|---|
| Rent | -10% $-753 | -5% $-680 | +0% $-607 | +5% $-534 | +10% $-461 |
| Rate | -1.0pp $-456 | -0.5pp $-531 | base $-607 | +0.5pp $-684 | +1.0pp $-763 |
UW: 25.0% down · 7.5% · 30yr · 1.5% tax · 5.0% vac · 8.0% maint · 8.0% mgmt
Financing live
Cash to close
- Down payment
- $74,750
- Closing costs
- $8,970
- Reserves months
- —
- Total cash needed
- —
Loan-product check · same deal, 3 products live
Conventional
25% down · 7.5% · 30yr
- Down + closing
- —
- Monthly P&I
- —
- Monthly cashflow
- —
- DSCR
- —
- Eligible?
- —
Personal DTI + credit; lowest rate.
DSCR
20% down · 8.5% · 30yr
- Down + closing
- —
- Monthly P&I
- —
- Monthly cashflow
- —
- DSCR
- —
- Eligible?
- —
No personal income docs; deal must DSCR.
Hard money
10% down · 12.0% · 12mo
- Down + closing
- —
- Monthly P&I
- —
- Monthly cashflow
- —
- DSCR
- —
- Eligible?
- —
Short-term bridge; refi at stabilization.
Rent comps 9 comps
| Address | Beds | Baths | Sqft | Rent | $/sqft | DOM | Units | Dist |
|---|---|---|---|---|---|---|---|---|
| 1317 Kennedy Rd Howe, TX | 3.0 | 2.0 | 1600 | $1,795 | $1.12 | 45d | 1 | 0.11mi |
| 1301 Elliott Rd Howe, TX | 3.0 | 2.0 | 1589 | $1,850 | $1.16 | 22d | 1 | 0.18mi |
| 1632 Elliott Rd Howe, TX | 3.0 | 2.0 | 1461 | $1,800 | $1.23 | 22d | 1 | 0.18mi |
| 1629 Elliott Rd Howe, TX | 3.0 | 2.0 | 1451 | $1,800 | $1.24 | 45d | 1 | 0.18mi |
| 1625 Elliott Rd Howe, TX | 4.0 | 2.0 | 1656 | $1,950 | $1.18 | 45d | 1 | 0.18mi |
| 1636 Elliott Rd Howe, TX | 4.0 | 2.0 | 1656 | $1,950 | $1.18 | 45d | 1 | 0.18mi |
| 1520 Elliott Rd Howe, TX | 4.0 | 2.0 | 1810 | $2,100 | $1.16 | 45d | 1 | 0.19mi |
| 1810 Clegg St Howe, TX | 4.0 | 2.0 | 1658 | $1,595 | $0.96 | 22d | 1 | 0.22mi |
| 406 N Denny St Unit B Howe, TX | 3.0 | 2.0 | 1600 | $1,599 | $1.00 | 45d | 1 | 0.92mi |
Listing history 18 events
-
2026-06-21days on market $247,999 Active 295 DOM
-
2026-06-19days on market $247,999 Active 293 DOM
-
2026-06-18days on market $247,999 Active 292 DOM
-
2026-06-17days on market $247,999 Active 291 DOM
-
2026-06-16days on market $247,999 Active 290 DOM
-
2026-06-15days on market $247,999 Active 289 DOM
-
2026-06-14days on market $247,999 Active 287 DOM
-
2026-06-13days on market $247,999 Active 286 DOM
-
2026-06-10days on market $247,999 Active 284 DOM
-
2026-06-09days on market $247,999 Active 283 DOM
-
2026-06-08days on market $247,999 Active 282 DOM
-
2026-06-07days on market $247,999 Active 281 DOM
-
2026-06-05days on market $247,999 Active 278 DOM
-
2026-06-02days on market $247,999 Active 276 DOM
-
2026-06-01days on market $247,999 Active 275 DOM
-
2026-05-31days on market $247,999 Active 274 DOM
-
2026-05-30days on market $247,999 Active 273 DOM
-
2025-08-30$247,999 Active 377-char remark
Show marketing remark (377 chars)
This new home offers simple living with a convenient single-level layout. An open-concept floorplan combines the kitchen, living and dining areas for simple entertaining and multitasking. Three secondary bedrooms are tucked away to the side of the home, and the owner's suite is nestled into a private rear corner, offering access to a spa-inspired bathroom and walk-in closet.
ⓘ Source: listings_history table (triggers on properties + properties_extension) + one-shot
backfill from property_details.listing_events for pre-trigger history.
Nearby sold comps map
Loading sold comps map…
Walkable amenities ~0.75 mi
Loading nearby amenities…
Taxation est. · year 1
- Rental income
- $22,167
- − Mortgage interest
- −$16,749
- − Property taxes
- −$4,485
- − Insurance
- −$1,495
- − Repairs & maintenance
- −$1,773
- − Management
- −$1,773
- − Depreciation
- −$8,698
- Taxable loss
- −$12,807
- Est. tax savings @ 24.0%
- +$3,074
- After-tax cash flow
- $-4,210/yr
For passive investors: Depreciation is non-cash, so a rental often shows a tax loss while cash-flowing — sheltering income. Rental losses are passive: they offset passive income freely, and up to $25,000/yr can offset ordinary (W-2) income if you actively participate and your MAGI is under $100k (phasing out to $0 by $150k); unused losses carry forward. On sale, claimed depreciation is recaptured at up to 25%, and gains may owe capital-gains tax (a 1031 exchange can defer both). Figures are a year-1 estimate at your 24.0% rate — not tax advice; consult a CPA.
Schools (NCES district)
- District
- Howe ISD
- NCES district ID
- 4823670
- Math proficiency
- 47% ▼ -2.00%
- Reading proficiency
- 51% ▲ 1.00%
- Median HH income
- $60,164
- Composite
- 42.92/100
- National rank
- #3119
- State rank
- #180 of 826 in TX
Livability — Howe
- Score
- 70/100
- State rank
- #368
- US rank
- #7804
Category grades
Schools grade is shown separately in the Schools card above.
Census & demographics
- Census place
- Howe, TX
- Population (ZIP)
- 6,620
Population outlook (Grayson County) Hauer SSP2
- Today (2025)
- 134,540 people
- By 2030
- 138,653 · +3.1%
- By 2040
- 145,958 · +8.5%
- By 2050
- 151,218 · +12.4%
- By 2075
- 161,802 · +20.3%
- By 2100
- 159,036 · +18.2%
Race, ethnicity, and origin ACS 2023
- Neighborhood character
- Majority White (65%)
- Race & ethnicity
- White 65% Hispanic / Latino 28% Two or more races 9% Black 5%
- Hispanic origin (detail)
- Mexican 27%
- Common ancestry
- Slovak 4% Lithuanian 3% Italian 1%
- Foreign-born
- 11% · Canada
- Languages at home
- 82% English-only · Spanish 17%
Political lean MEDSL · Grayson
- 2024 margin
- Solid R (+54.3) · D 22.5% · R 76.7%
- 2008→2024 swing
- -16.4pp toward R · 2008: -37.9pp · 2024: -54.3pp
- All cycles
- 2024: R+54.3 2020: R+49.9 2016: R+53.1 2012: R+48.0 2008: R+37.9
Not yet ingested
- Civics
- —
Market trends
- HPI YoY
- ▼ -56.75%
- Current HPI
- 249.7211
- Rent YoY
- —
- Metro
- —
- State GDP YoY
- ▲ 3.95%
- F500 in state
- 110
Industry mix (Fortune 500 HQ in TX)
| Industry | F500 HQs | Revenue |
|---|---|---|
| Energy | 16 | $1,198B |
|
||
| Technology | 5 | $198B |
|
||
| Engineering / Construction | 4 | $72B |
|
||
| Energy Services | 3 | $60B |
|
||
| Utilities | 3 | $41B |
|
||
| Healthcare | 2 | $330B |
|
||
Price history
1 event — show timeline
- 2025-08-30 Listed $247,999 Zillow
Cash-flow waterfall
monthlySold comps — $/sqft
last 12 mo · ≤1 miLoading sold comps…