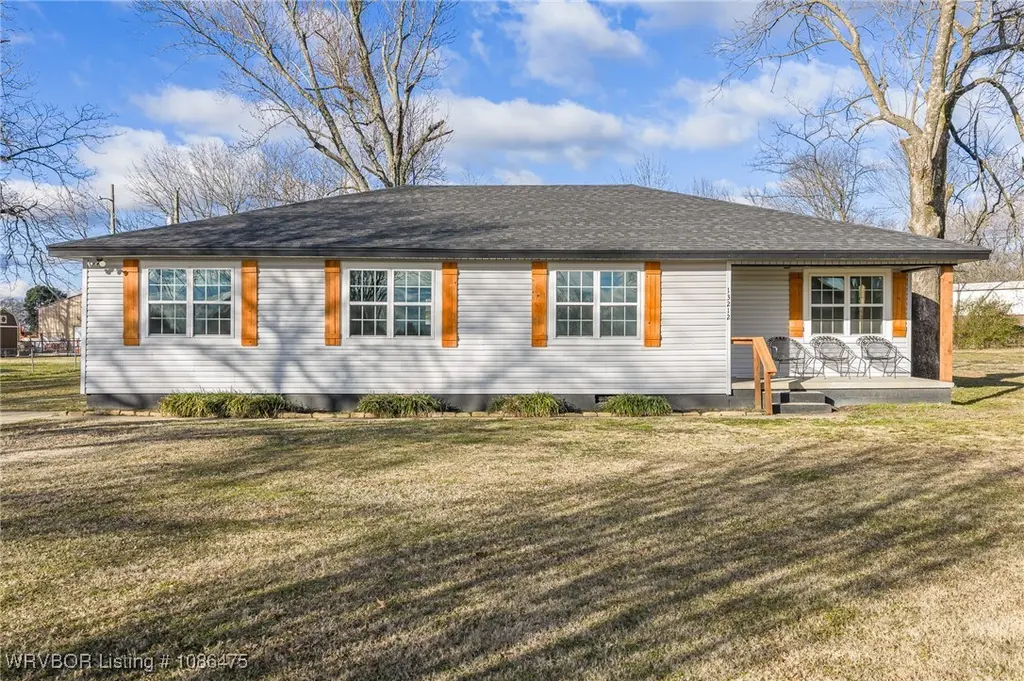
13212 Mine 18 Rd · Fort Smith, AR
Flood risk 1/10 · Minimal
- FEMA flood zone
- X (unshaded)
- Chance of flooding over 30 yrs
- 0.0%
- Est. flood insurance / yr
- $507 – $1,088
Fire risk 6/10 · Moderate
- Est. fire insurance / yr
- $1,499 – $2,785
Heat risk 6/10 · Moderate
- Hot days now (above 111°F)
- 7 days/yr
- Hot days in 30 yrs
- 20 days/yr
Wind risk 2/10 · Minimal
- Chance of severe wind over 30 yrs
- 3.0%
Air-quality risk 2/10 · Minimal
- Unhealthy air days now
- 0 days/yr
- Unhealthy air days in 30 yrs
- 1 days/yr
Risk factors via First Street. Map © Google.
Why this score? — see what drove the D+ grade
The composite is a weighted blend of 9 inputs, each scored 0–100. Each bar is that input's sub-score; the figure is the points it added to the 100-point composite (weight × sub-score).
- ARV discount +15.0/15.0
- Cash flow +14.3/30.0
- Schools +5.0/10.0
- DSCR +4.3/10.0
- Livability +3.2/5.0
- Rent growth +2.9/5.0
- 1% rule +2.7/10.0
- Condition / age +2.5/5.0
- Appreciation +0.0/10.0
$259,900
🖨 Deal sheet 📄 Offer letter ✓ Due diligence
Listing remarks MLS
Welcome home to this 4-bedroom, 2-bathroom property sitting on a half-acre lot, perfectly located between Fort Smith and Greenwood. Take a seat on the front porch and enjoy beautiful sunset views while soaking in the peaceful country feel—just minutes from town. Inside, you’ll find an open floor plan filled with a ton of natural light, beautifully finished interiors, two walk-in showers, and a spacious laundry room with plenty of room for storage and functionality. Located outside city limits, this home qualifies for a USDA Rural Development loan. The backyard includes a storage shed, making this property both practical and inviting.
Key facts
- Open floor plan
- Front porch
- Natural light
Tags
Neighborhood map
What this means for you Summary
Snapshot
- This is a 4-bed/2.0-bath single-family listed at $260k.
Deal economics
- At list price, monthly cash flow is $46 ($547/yr) — positive.
- The deal already cash-flows at list — no discount required.
- To meet the 1% rule (rent ≥ 1% of price), the offer needs to be $201k (22.7% below list).
- Recommended offer: $201k (22.7% below list) — sets the bar for 1% rule.
- Cap rate 6.5% vs local median 4.3% in Fort Smith — top-decile yield for the area; either an underpriced asset or a hidden risk that comps aren't pricing in. Stress-test before assuming the spread holds.
Location & tenants
- Location reads 65/100 on livability (#151 in AR) — a middle-class / working-renter tenant base. Strengths: cost of living A+, housing A+, health & safety A+; Watch: schools D, crime F, amenities F.
- Greenwood School District (town): math 59% / reading 58% proficiency, ranked #5 of 238 in AR (top 2%) — acceptable for families but not a draw, mixed tenant base, ~2y average lease.
- Market conditions: Rents rising (+1.6%/yr); 235 active listings in the ZIP; 3 comparable units currently listed for rent nearby; rentals leasing fast (median 13d on market — plan ~1-2 weeks tenant-placement turnaround); solid renter incomes; 388 units permitted in Sebastian County in 2024 (16 in 5+ unit buildings).
Forward outlook
- Local home prices are declining (-3.0%/yr); year-one equity from $2k of loan paydown is wiped out by about $8k of value loss. Plan a longer hold.
- Sebastian County population projected at +7% by 2050 — modest demand growth; plan on rents tracking national, not racing it.
Negotiation context
- It's been on market 154 days — a 12% lower offer ($229k) is reasonable based on typical stale-listing flexibility.
- Current owner paid $85k; list at $260k implies a 206% gain — meaningful room to come down on a strong offer.
Risks & watch-outs
- Climate carrying-cost: major wildfire risk; extreme-heat days projected 7→20/yr by 2055 (HVAC capex compounding) — expect insurance premiums to compound above CPI over the hold.
Questions for the listing agent
- It's been on market 154 days. Have you received any prior offers? Is the seller open to a 23% concession, seller financing, or rate buy-down credit?
- Why hasn't it sold? Are there any deal-killer items the seller is aware of (foundation, flood, title, zoning, code violations)?
- Is there a deadline driving the sale (1031 exchange, divorce, estate, relocation)? That informs how much negotiation room exists.
- Schools are D-rated, which usually means shorter tenancies and higher turnover. Who's the typical renter profile here, and what's been the actual vacancy rate?
- Crime grade is F in this area — have there been break-ins, vandalism, or insurance claims at this property in the last 3 years? What carrier currently insures it and at what premium?
- The area grade is low — what's the realistic commute time and amenity access for the typical tenant pool here? Any planned neighborhood developments (good or bad) we should know about?
- What's the average days-on-market for RENTAL listings here right now (not sales)? A rising rental-DOM trend means longer vacancies and softer asking-rent achievability than the comps imply.
- What's the recent tenant-quality profile in this submarket — average credit score on applications, eviction rate, late-payment / NSF rate, and stable-employment percentage? A property-management company in the area should have these aggregated.
- How much new for-sale + rental construction is in the pipeline within 1–3 miles? Heavy new supply typically softens prices + rents 12–24 months out; constrained supply supports both.
Investment metrics
- 1% rule
- 0.77% ✗
- Cap rate
- 6.50%
- Cash-on-cash
- 0.75%
- DSCR
- 1.03
- GRM
- 10.8
CMA / ARV
- ARV (median comp)
- $345,521
- List price
- $259,900
- Delta
- -24.78%
- Verdict
- UNDERPRICED
- Comps
- 20 within 1.0 mi
Show comp detail 8 sales within ~0.75 mi
| Address | Dist | Beds/Ba | Sqft | Sold | Price | $/sf | Match |
|---|---|---|---|---|---|---|---|
| 5716 Thomas Rd | 0.39mi | 4/2.0 | 1,825 (+6%) | 0mo | $405,000 | $222 | 72 |
| 13104 Mine 18 Rd | 0.09mi | 3/2.0 (-1) | 1,926 (+12%) | 12mo | $310,000 | $161 | 60 |
| 12516 Wilmington Way | 0.58mi | 4/2.0 | 1,773 (+3%) | 9mo | $305,000 | $172 | 60 |
| 5800 Callaway Ln | 0.43mi | 3/2.0 (-1) | 1,702 (-1%) | 17mo | $289,000 | $170 | 59 |
| 5600 Thomas Rd | 0.47mi | 4/2.0 | 1,853 (+8%) | 22mo | $345,000 | $186 | 46 |
| 5706 Callaway Ln | 0.45mi | 3/2.0 (-1) | 1,916 (+12%) | 12mo | $319,500 | $167 | 44 |
| 5707 Callaway Ln | 0.48mi | 3/2.0 (-1) | 1,952 (+14%) | 11mo | $315,000 | $161 | 41 |
| 5508 Thomas Rd | 0.51mi | 4/2.0 | 1,925 (+12%) | 19mo | $352,000 | $183 | 40 |
Match score weights: distance 35% · size 25% · config 20% · recency 20%. Top-matched comps best support the ARV.
Projected returns pro-forma
-3.0% appreciation · 1.57% rent growth · sell at horizon
- IRR
- -16.6%
- Equity multiple
- 0.42×
- Total profit
- $-42,189
- Equity at exit
- $38,752
- IRR
- -10.8%
- Equity multiple
- 0.38×
- Total profit
- $-44,874
- Equity at exit
- $22,471
Cash invested: $72,772 (down + closing). Projections, not guarantees.
Landlord ↔ Tenant lean methodology
- Overall (STATE)
- 92 Strongly Landlord-Friendly
- State Arkansas
- 92 Strongly Landlord-Friendly · R+14
- County
- — inherits STATE
- City
- — inherits STATE
ZIP-level market 72916
- Home prices YoY
- -20.1%
- Rents YoY
- 1.6%
- Active inventory
- 235
- Price-to-rent
- 10.8×
Monthly cashflow live
- Estimated rent
- $2,008 medium interval (Pro) →
- Mortgage (P&I)
- −$1,363
- Tax from tax record
- −$70 /mo · $837/yr
- Insurance
- −$108
- HOA
- −$0
- Vacancy / Maint / Mgmt
- −$422
- Net cashflow
- $46
Break-even live
UW: 25.0% down · 7.5% · 30yr · 1.5% tax · 5.0% vac · 8.0% maint · 8.0% mgmt
Financing live
Cash to close
- Down payment
- $64,975
- Closing costs
- $7,797
- Reserves months
- —
- Total cash needed
- —
Loan-product check · same deal, 3 products live
Conventional
25% down · 7.5% · 30yr
- Down + closing
- —
- Monthly P&I
- —
- Monthly cashflow
- —
- DSCR
- —
- Eligible?
- —
Personal DTI + credit; lowest rate.
DSCR
20% down · 8.5% · 30yr
- Down + closing
- —
- Monthly P&I
- —
- Monthly cashflow
- —
- DSCR
- —
- Eligible?
- —
No personal income docs; deal must DSCR.
Hard money
10% down · 12.0% · 12mo
- Down + closing
- —
- Monthly P&I
- —
- Monthly cashflow
- —
- DSCR
- —
- Eligible?
- —
Short-term bridge; refi at stabilization.
Rent comps 3 comps
| Address | Beds | Baths | Sqft | Rent | $/sqft | DOM | Units | Dist |
|---|---|---|---|---|---|---|---|---|
| 8908 Cambria Cir Unit B Fort Smith, AR | 3.0 | 2.0 | 1399 | $1,599 | $1.14 | 13d | 1 | 0.88mi |
| 10108 Talavera Trl Unit A Fort Smith, AR | 3.0 | 2.0 | 1487 | $1,649 | $1.11 | 43d | 1 | 0.88mi |
| 11601 Kenwood Dr Fort Smith, AR | 3.0 | 2.0 | 1685 | $2,395 | $1.42 | 13d | 8 | 1.00mi |
Listing history 21 events
-
2026-06-19days on market $259,900 Active 154 DOM
-
2026-06-18days on market $259,900 Active 153 DOM
-
2026-06-17days on market $259,900 Active 152 DOM
-
2026-06-16days on market $259,900 Active 151 DOM
-
2026-06-15days on market $259,900 Active 150 DOM
-
2026-06-14days on market $259,900 Active 148 DOM
-
2026-06-13days on market $259,900 Active 147 DOM
-
2026-06-10days on market $259,900 Active 145 DOM
-
2026-06-09days on market $259,900 Active 144 DOM
-
2026-06-08days on market $259,900 Active 143 DOM
-
2026-06-07days on market $259,900 Active 142 DOM
-
2026-06-05days on market $259,900 Active 139 DOM
-
2026-06-03days on market $259,900 Active 138 DOM
-
2026-06-02days on market $259,900 Active 137 DOM
-
2026-06-01days on market $259,900 Active 136 DOM
-
2026-05-31days on market $259,900 Active 135 DOM
-
2026-05-30days on market $259,900 Active 134 DOM
-
2026-03-02price $275,000 653-char remark
Show marketing remark (653 chars)
Welcome home to this 4-bedroom, 2-bathroom property sitting on a half-acre lot, perfectly located between Fort Smith and Greenwood. Take a seat on the front porch and enjoy beautiful sunset views while soaking in the peaceful country feel—just minutes from town. Inside, you’ll find an open floor plan filled with a ton of natural light, beautifully finished interiors, two walk-in showers, and a spacious laundry room with plenty of room for storage and functionality. Located outside city limits, this home qualifies for a USDA Rural Development loan. The backyard includes a storage shed, making this property both practical and inviting.
-
2026-01-17$289,000 Active 653-char remark
Show marketing remark (653 chars)
Welcome home to this 4-bedroom, 2-bathroom property sitting on a half-acre lot, perfectly located between Fort Smith and Greenwood. Take a seat on the front porch and enjoy beautiful sunset views while soaking in the peaceful country feel—just minutes from town. Inside, you’ll find an open floor plan filled with a ton of natural light, beautifully finished interiors, two walk-in showers, and a spacious laundry room with plenty of room for storage and functionality. Located outside city limits, this home qualifies for a USDA Rural Development loan. The backyard includes a storage shed, making this property both practical and inviting.
-
2023-08-25soldstatus $85,000
-
2005-06-14soldstatus $32,000
ⓘ Source: listings_history table (triggers on properties + properties_extension) + one-shot
backfill from property_details.listing_events for pre-trigger history.
Tax reassessment forecast AR · Resets to sale price
- Current annual tax
- $837 · $70/mo
- Projected year-2 tax
- $1,663 · $139/mo
- Expected delta
- +$826/yr (+$69/mo · 98.7%)
ⓘ Screening estimate from a state-policy table — verify with the county assessor before closing.
Climate risk First Street
- Flood 1/10 Low FEMA zone X (unshaded) · 0% chance over 30 yrs
- Wildfire 6/10 Major
- Heat 6/10 Major 7 d/yr ≥111°F today · 20 d/yr by 30 yrs out
- Wind 2/10 Low 3% chance of damaging wind over 30 yrs
- Air quality 2/10 Low 0 unhealthy d/yr today · 1 by 30 yrs out
Nearby sold comps map
Loading sold comps map…
Walkable amenities ~0.75 mi
Loading nearby amenities…
Taxation est. · year 1
- Rental income
- $24,100
- − Mortgage interest
- −$14,558
- − Property taxes
- −$837
- − Insurance
- −$1,300
- − Repairs & maintenance
- −$1,928
- − Management
- −$1,928
- − Depreciation
- −$7,561
- Taxable loss
- −$4,012
- Est. tax savings @ 24.0%
- +$963
- After-tax cash flow
- $1,510/yr
For passive investors: Depreciation is non-cash, so a rental often shows a tax loss while cash-flowing — sheltering income. Rental losses are passive: they offset passive income freely, and up to $25,000/yr can offset ordinary (W-2) income if you actively participate and your MAGI is under $100k (phasing out to $0 by $150k); unused losses carry forward. On sale, claimed depreciation is recaptured at up to 25%, and gains may owe capital-gains tax (a 1031 exchange can defer both). Figures are a year-1 estimate at your 24.0% rate — not tax advice; consult a CPA.
Schools (NCES district)
- District
- Greenwood School District
- NCES district ID
- 0506990
- Math proficiency
- 59% ▼ -9.00%
- Reading proficiency
- 58% ▼ -4.00%
- Median HH income
- $55,015
- Composite
- 50.33/100
- National rank
- #1879
- State rank
- #5 of 238 in AR
Livability — Fort Smith
- Score
- 65/100
- State rank
- #151
- US rank
- #13185
Category grades
Schools grade is shown separately in the Schools card above.
Census & demographics
- County
- Sebastian County · 99,312 people
- City population
- 94,356
- Metro
- Fort Smith, AR-OK
- Population (ZIP)
- 11,711
- Household income
- $87,983
- Rent vs Own
- Severe rent burden
- 141.0
Population outlook (Sebastian County) Hauer SSP2
- Today (2025)
- 133,992 people
- By 2030
- 136,620 · +2.0%
- By 2040
- 140,832 · +5.1%
- By 2050
- 143,301 · +6.9%
- By 2075
- 147,964 · +10.4%
- By 2100
- 145,848 · +8.8%
Race, ethnicity, and origin ACS 2023
- Neighborhood character
- Predominantly White (75%)
- Race & ethnicity
- White 75% Two or more races 10% Asian 7% Hispanic / Latino 6% Black 4%
- Hispanic origin (detail)
- Mexican 5%
- Common ancestry
- Italian 4% Scandinavian 2% Slovak 2%
- Foreign-born
- 6% · Canada
- Languages at home
- 89% English-only · Spanish 3% Other Asian/Pacific 3% German/W. Germanic 2%
Political lean MEDSL · Sebastian
- 2024 margin
- Solid R (+37.5) · D 30.0% · R 67.6% · Other 2.4%
- 2008→2024 swing
- -2.9pp toward R · 2008: -34.6pp · 2024: -37.5pp
- All cycles
- 2024: R+37.5 2020: R+35.5 2016: R+38.1 2012: R+37.1 2008: R+34.6
Not yet ingested
- Civics
- —
Market trends
- HPI YoY
- ▼ -54.92%
- Current HPI
- 218.0302
- Rent YoY
- ▲ 1.57%
- Metro
- Fort Smith, AR-OK
- State GDP YoY
- ▲ 3.80%
- F500 in state
- 10
Industry mix (Fortune 500 HQ in AR)
| Industry | F500 HQs | Revenue |
|---|---|---|
| Retail | 1 | $681B |
|
||
| Food / Agriculture | 1 | $53B |
|
||
| Retail / Energy | 1 | $22B |
|
||
| Transportation / Logistics | 1 | $12B |
|
||
| Energy | 1 | $4B |
|
||
Price history
+759.4% since first listed4 events — show timeline
- 2026-03-02 Price Changed $275,000 WRVBOR
- 2026-01-17 Listed $289,000 WRVBOR
- 2023-08-25 Sold (Public Records) $85,000 Public Records
- 2005-06-14 Sold (Public Records) $32,000 Public Records
Property tax history
+2.2%/yrLatest (2025): $837 · +8.7% YoY. Source: county tax records.
Cash-flow waterfall
monthlySold comps — $/sqft
last 12 mo · ≤1 miLoading sold comps…