825 N Lamb Blvd · Las Vegas, NV
Flood risk No data
- FEMA flood zone
- —
- Chance of flooding over 30 yrs
- —
- Est. flood insurance / yr
- —
Fire risk No data
- Est. fire insurance / yr
- —
Heat risk 8/10 · Major
- Hot days now (above threshold)
- 7 days/yr
- Hot days in 30 yrs
- 16 days/yr
Wind risk No data
- Chance of severe wind over 30 yrs
- —
Air-quality risk 4/10 · Minor
- Unhealthy air days now
- 4 days/yr
- Unhealthy air days in 30 yrs
- 5 days/yr
Risk factors via First Street. Map © Google.
Why this score? — see what drove the B- grade
The composite is a weighted blend of 9 inputs, each scored 0–100. Each bar is that input's sub-score; the figure is the points it added to the 100-point composite (weight × sub-score).
- Cash flow +30.0/30.0
- 1% rule +10.0/10.0
- DSCR +10.0/10.0
- ARV discount +7.5/15.0
- Livability +4.0/5.0
- Rent growth +2.9/5.0
- Schools +2.6/10.0
- Condition / age +2.5/5.0
- Appreciation +0.0/10.0
$30,000
🖨 Deal sheet 📄 Offer letter ✓ Due diligence
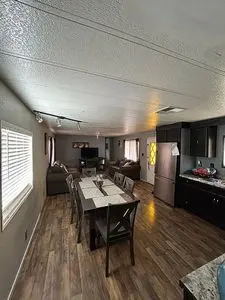
Listing remarks
It & acirc; & euro; & trade; s a very nice family home, three spacious bedrooms, and two full bathrooms. Parking for three cars. Very nice place. The ac and the heater works good.
Key facts
- Built 1974
- Listed 14 days
Property features AI
Exterior
- Home design: Built in 1974
- Construction: 980 square feet of living area
- Exterior features: Located in the East Las Vegas subdivision
Neighborhood map
What this means for you Summary
Snapshot
- This is a 3-bed/2.0-bath land listed at $30k.
Deal economics
- At list price, monthly cash flow is $766 ($9k/yr) — positive.
- The deal already cash-flows at list — no discount required.
- Meets the 1% rule at list price ($1k rent vs $30k).
- Recommended offer: $30k (1.5% below list) — sets the bar for market timing.
Location & tenants
- Location reads 80/100 on livability (#2 in NV, #1,723 nationally) — a professional / high-income tenant draw. Strengths: amenities A+, commute A+, housing A+; Watch: crime F.
- Clark County School District (urban): math 21% / reading 39% proficiency, ranked #11 of 17 in NV (top 65%) — families likely to look elsewhere, expect single-tenant / working-renter base with shorter leases.
- Market conditions: Rents rising (+1.8%/yr); 260 active listings in the ZIP; 18 comparable units currently listed for rent nearby; rentals lingering (median 44d on market — plan ~5-8 weeks vacancy on turnover, expect pricing pressure); 50% of comp listings sitting > 30 days — soft ceiling on asking rent; 14,754 units permitted in Clark County in 2024 (2,301 in 5+ unit buildings).
Forward outlook
- Local home prices are declining (-3.0%/yr); year-one equity from $207 of loan paydown is wiped out by about $900 of value loss. Plan a longer hold.
- Clark County population projected at +36% by 2050 — long-run rental-demand tailwind backs the buy-and-hold thesis.
- At projected returns (-3.0% appreciation + 1.8% rent growth), your $8k cash investment doubles in ~1 year — after that, you're playing with house money.
Negotiation context
- It's been on market 15 days — a 2% lower offer ($30k) is reasonable based on typical stale-listing flexibility.
Risks & watch-outs
- Climate carrying-cost: extreme-heat days projected 7→16/yr by 2055 (HVAC capex compounding) — expect insurance premiums to compound above CPI over the hold.
Questions for the listing agent
- Built in 1974 — when were the roof, HVAC, electrical panel, plumbing, and water heater last replaced?
- Is there a deadline driving the sale (1031 exchange, divorce, estate, relocation)? That informs how much negotiation room exists.
- Crime grade is F in this area — have there been break-ins, vandalism, or insurance claims at this property in the last 3 years? What carrier currently insures it and at what premium?
- What's the average days-on-market for RENTAL listings here right now (not sales)? A rising rental-DOM trend means longer vacancies and softer asking-rent achievability than the comps imply.
- What's the recent tenant-quality profile in this submarket — average credit score on applications, eviction rate, late-payment / NSF rate, and stable-employment percentage? A property-management company in the area should have these aggregated.
- How much new for-sale + rental construction is in the pipeline within 1–3 miles? Heavy new supply typically softens prices + rents 12–24 months out; constrained supply supports both.
Investment metrics
- 1% rule
- 4.11% ✓
- Cap rate
- 36.94%
- Cash-on-cash
- 109.46%
- DSCR
- 5.87
- GRM
- 2.0
CMA / ARV
No comps found within radius.
Projected returns pro-forma
-3.0% appreciation · 1.78% rent growth · sell at horizon
- IRR
- —
- Equity multiple
- 6.06×
- Total profit
- $42,464
- Equity at exit
- $4,473
- IRR
- —
- Equity multiple
- 12.18×
- Total profit
- $93,908
- Equity at exit
- $2,594
Cash invested: $8,400 (down + closing). Projections, not guarantees.
Landlord ↔ Tenant lean methodology
- Overall (STATE)
- 71 Landlord-Friendly
- State Nevada
- 71 Landlord-Friendly · R+1
- County
- — inherits STATE
- City
- — inherits STATE
ZIP-level market 89110
- Rents YoY
- 1.8%
- Active inventory
- 260
- Price-to-rent
- 2.0×
Monthly cashflow live
- Estimated rent
- $1,232 high interval (Pro) →
- Mortgage (P&I)
- −$157
- Tax est. 1.5%
- −$38 /mo · $450/yr
- Insurance
- −$12
- HOA
- −$0
- Vacancy / Maint / Mgmt
- −$259
- Net cashflow
- $766
Break-even live
UW: 25.0% down · 7.5% · 30yr · 1.5% tax · 5.0% vac · 8.0% maint · 8.0% mgmt
Financing live
Cash to close
- Down payment
- $7,500
- Closing costs
- $900
- Reserves months
- —
- Total cash needed
- —
Loan-product check · same deal, 3 products live
Conventional
25% down · 7.5% · 30yr
- Down + closing
- —
- Monthly P&I
- —
- Monthly cashflow
- —
- DSCR
- —
- Eligible?
- —
Personal DTI + credit; lowest rate.
DSCR
20% down · 8.5% · 30yr
- Down + closing
- —
- Monthly P&I
- —
- Monthly cashflow
- —
- DSCR
- —
- Eligible?
- —
No personal income docs; deal must DSCR.
Hard money
10% down · 12.0% · 12mo
- Down + closing
- —
- Monthly P&I
- —
- Monthly cashflow
- —
- DSCR
- —
- Eligible?
- —
Short-term bridge; refi at stabilization.
Rent comps 18 comps
| Address | Beds | Baths | Sqft | Rent | $/sqft | DOM | Units | Dist |
|---|---|---|---|---|---|---|---|---|
| 921 Snug Harbor St Unit D Las Vegas, NV | 2.0 | 1.0 | 2896 | $1,200 | $0.41 | 23d | 1 | 0.26mi |
| 4201 Terrestrial Dr Unit 122 Las Vegas, NV | 2.0 | 1.0 | 3212 | $1,100 | $0.34 | 43d | 1 | 0.95mi |
| 1843 Cosmic Dr #268 Las Vegas, NV | 2.0 | 1.0 | 3212 | $1,100 | $0.34 | 43d | 1 | 0.98mi |
| 1843 Cosmic Dr #268 Las Vegas, NV | 2.0 | 1.0 | 3212 | $1,100 | $0.34 | 7d | 1 | 0.98mi |
| 1842 Nebula Dr Unit 270 Las Vegas, NV | 2.0 | 1.0 | 3212 | $1,150 | $0.36 | 7d | 1 | 0.99mi |
| 1858 Dwarf Star Dr Unit 233 Las Vegas, NV | 2.0 | 1.0 | 3212 | $1,100 | $0.34 | 43d | 1 | 0.99mi |
| 1641 N Lamont St Unit C Las Vegas, NV | 2.0 | 1.0 | 3080 | $945 | $0.31 | 20d | 1 | 0.99mi |
| 1872 Cosmic Dr Unit 254 Las Vegas, NV | 2.0 | 1.0 | 3212 | $1,042 | $0.32 | 23d | 1 | 1.00mi |
| 1662 N Lamont St Unit 102 Las Vegas, NV | 2.0 | 2.0 | 3936 | $1,250 | $0.32 | 43d | 1 | 1.03mi |
| 1662 N Lamont St Unit 202 Las Vegas, NV | 2.0 | 2.0 | 3936 | $1,250 | $0.32 | 23d | 1 | 1.03mi |
| 1884 Nebula Dr Unit 276 Las Vegas, NV | 2.0 | 1.0 | 3212 | $950 | $0.30 | 43d | 1 | 1.03mi |
| 1724 Breckenwood Ct Unit 2 Las Vegas, NV | 2.0 | 1.0 | 3200 | $995 | $0.31 | 43d | 1 | 1.05mi |
| 4920 Stanley Ave Unit 3 Las Vegas, NV | 2.0 | 1.0 | 3290 | $1,300 | $0.40 | 23d | 1 | 1.09mi |
| 1983 Cosmic Dr Unit 193 Las Vegas, NV | 2.0 | 1.0 | 3212 | $1,100 | $0.34 | 43d | 1 | 1.12mi |
| 1896 Fulstone Way Unit 3 Las Vegas, NV | 2.0 | 1.0 | 3290 | $800 | $0.24 | 23d | 1 | 1.17mi |
| 4945 Kell Ln Unit 2 Las Vegas, NV | 2.0 | 1.0 | 3290 | $900 | $0.27 | 43d | 1 | 1.18mi |
| 5270 Carriellen Ln Unit A Las Vegas, NV | 2.0 | 1.0 | 3488 | $950 | $0.27 | 43d | 1 | 1.25mi |
| 5270 Carriellen Ln Unit A Las Vegas, NV | 2.0 | 1.0 | 3488 | $950 | $0.27 | 23d | 1 | 1.25mi |
Listing history 9 events
-
2026-06-16days on market $30,000 Active 15 DOM
-
2026-06-15days on market $30,000 Active 14 DOM
-
2026-06-13days on market $30,000 Active 12 DOM
-
2026-06-09days on market $30,000 Active 8 DOM
-
2026-06-08days on market $30,000 Active 7 DOM
-
2026-06-08days on market $30,000 Active 6 DOM
-
2026-06-03days on market $30,000 Active 2 DOM
-
2026-06-02remarks 179-char remark
-
2026-06-02$30,000 Active 1 DOM
ⓘ Source: listings_history table (triggers on properties + properties_extension) + one-shot
backfill from property_details.listing_events for pre-trigger history.
Climate risk First Street
- Heat 8/10 Severe
- Air quality 4/10 Moderate 4 unhealthy d/yr today · 5 by 30 yrs out
Nearby sold comps map
Loading sold comps map…
Walkable amenities ~0.75 mi
Loading nearby amenities…
Taxation est. · year 1
- Rental income
- $14,788
- − Mortgage interest
- −$1,680
- − Property taxes
- −$450
- − Insurance
- −$150
- − Repairs & maintenance
- −$1,183
- − Management
- −$1,183
- − Depreciation
- −$873
- Taxable income
- $9,269
- Est. tax owed @ 24.0%
- −$2,225
- After-tax cash flow
- $6,970/yr
For passive investors: Depreciation is non-cash, so a rental often shows a tax loss while cash-flowing — sheltering income. Rental losses are passive: they offset passive income freely, and up to $25,000/yr can offset ordinary (W-2) income if you actively participate and your MAGI is under $100k (phasing out to $0 by $150k); unused losses carry forward. On sale, claimed depreciation is recaptured at up to 25%, and gains may owe capital-gains tax (a 1031 exchange can defer both). Figures are a year-1 estimate at your 24.0% rate — not tax advice; consult a CPA.
Schools (NCES district)
- District
- Clark County School District
- NCES district ID
- 3200060
- Math proficiency
- 21% ▼ -13.00%
- Reading proficiency
- 39% ▼ -8.00%
- Median HH income
- $53,611
- Composite
- 26.48/100
- National rank
- #7211
- State rank
- #11 of 17 in NV
Livability — Las Vegas
- Score
- 80/100
- State rank
- #2
- US rank
- #1723
Category grades
Schools grade is shown separately in the Schools card above.
Census & demographics
- Census place
- Las Vegas, NV
- County
- Clark County · 2,306,105 people
- City population
- 1,643,591
- Metro
- Las Vegas-Henderson-Paradise, NV
- Population (ZIP)
- 69,107
- Household income
- $61,001
- Rent vs Own
- Severe rent burden
- 3134.0
Population outlook (Clark County) Hauer SSP2
- Today (2025)
- 2,504,101 people
- By 2030
- 2,693,770 · +7.6%
- By 2040
- 3,061,208 · +22.2%
- By 2050
- 3,400,072 · +35.8%
- By 2075
- 4,139,522 · +65.3%
- By 2100
- 4,596,916 · +83.6%
Race, ethnicity, and origin ACS 2023
- Neighborhood character
- Diverse neighborhood (Simpson 0.55)
- Race & ethnicity
- Hispanic / Latino 63% White 20% Two or more races 18% Black 8% Asian 5% Native American 2%
- Hispanic origin (detail)
- Mexican 52% Cuban 3%
- Common ancestry
- Lithuanian 1% Italian 1% Romanian 1%
- Foreign-born
- 31% · Canada
- Languages at home
- 42% English-only · Spanish 53% Tagalog/Filipino 2% Other Asian/Pacific 1%
Political lean MEDSL · Clark
- 2024 margin
- Toss-up / Even · D 50.4% · R 47.8% · Other 1.7%
- 2008→2024 swing
- -16.5pp toward R · 2008: 19.1pp · 2024: 2.6pp
- All cycles
- 2024: D+2.6 2020: D+9.3 2016: D+10.7 2012: D+14.5 2008: D+19.1
Not yet ingested
- Civics
- —
Market trends
- HPI YoY
- ▼ -165.11%
- Current HPI
- 299.1815
- Rent YoY
- ▲ 1.78%
- Metro
- Las Vegas-Henderson-Paradise, NV
- State GDP YoY
- ▲ 3.08%
- F500 in state
- 6
Industry mix (Fortune 500 HQ in NV)
| Industry | F500 HQs | Revenue |
|---|---|---|
| Hotels / Casinos | 3 | $36B |
|
||
Price history
-99.6% since first listed3 events — show timeline
- 2026-06-02 Listed $30,000 FSBO.com
- 2015-09-25 Sold (Public Records) $6,700,000 Public Records
- 1988-01-15 Sold (Public Records) $7,400,000 Public Records
Property tax history
+5.2%/yrLatest (2025): $92,829 · +8.0% YoY. Source: county tax records.
Cash-flow waterfall
monthlySold comps — $/sqft
last 12 mo · ≤1 miLoading sold comps…