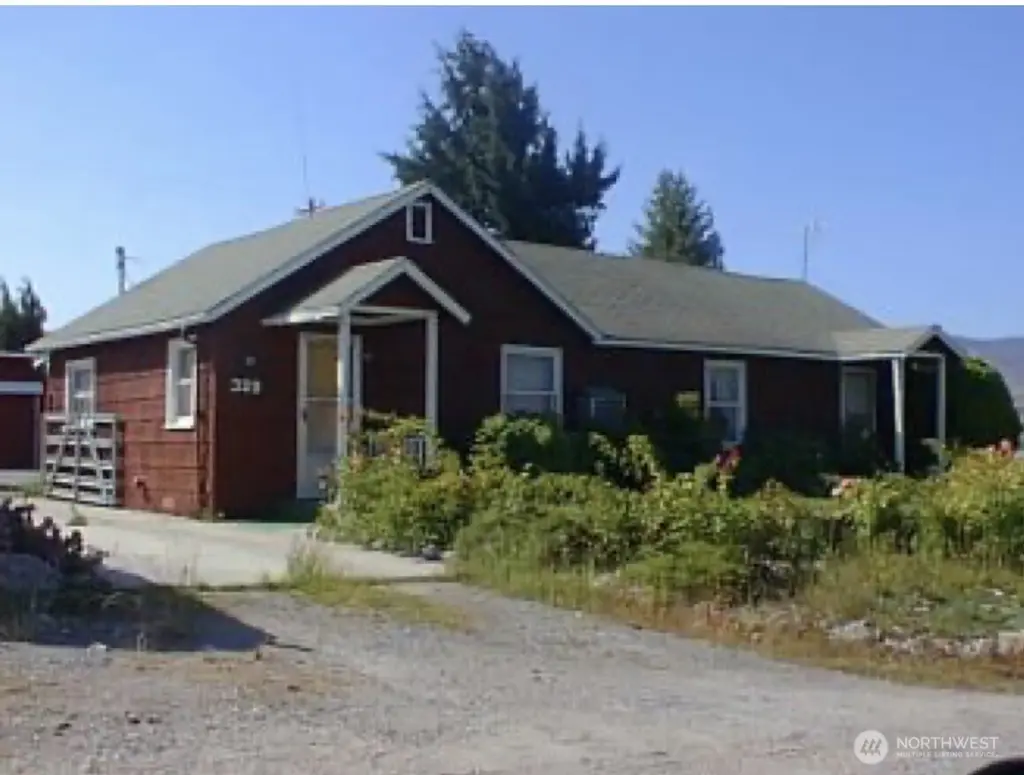
329 Mountain View Pl · Wenatchee, WA
Flood risk 1/10 · Minimal
- FEMA flood zone
- X (shaded)
- Chance of flooding over 30 yrs
- 0.0%
- Est. flood insurance / yr
- $473 – $860
Fire risk 6/10 · Moderate
- Est. fire insurance / yr
- $604 – $1,122
Heat risk 4/10 · Minor
- Hot days now (above 94°F)
- 7 days/yr
- Hot days in 30 yrs
- 14 days/yr
Wind risk 1/10 · Minimal
- Chance of severe wind over 30 yrs
- —
Air-quality risk 10/10 · Severe
- Unhealthy air days now
- 20 days/yr
- Unhealthy air days in 30 yrs
- 21 days/yr
Risk factors via First Street. Map © Google.
Why this score? — see what drove the C- grade
The composite is a weighted blend of 9 inputs, each scored 0–100. Each bar is that input's sub-score; the figure is the points it added to the 100-point composite (weight × sub-score).
- ARV discount +15.0/15.0
- Cash flow +14.1/30.0
- Schools +4.7/10.0
- DSCR +4.3/10.0
- Livability +3.6/5.0
- 1% rule +3.1/10.0
- Rent growth +2.9/5.0
- Condition / age +2.5/5.0
- Appreciation +0.0/10.0
$325,000
🖨 Deal sheet (PDF) 📄 Offer letter ✓ Due diligence
Listing remarks
Rare opportunity to create your dream home on a view property in East Wenatchee. Situated on over half an acre with sweeping Columbia River and mountain views, this property offers tremendous upside for investors, builders, or buyers ready to renovate. Home requires significant repairs, including foundation work and a complete remodel, but the setting is exceptional. Estate sale - sold as-is.
Key facts
- Over half an acre
- Complete remodel
- Columbia river views
Tags
Property features AI
Finance
- Financial info: Listing available for cash buyers
Exterior
- Parking: Detached garage; Covered parking for 2 vehicles; Driveway parking; RV parking available
- Security: Fully fenced
- Utilities: Electric energy source; Public water; Septic tank sewer
- Home design: Single-family, one-story house; Built on lot; Has a view
- Construction: Wood construction; Composition (asphalt) roof; Poured concrete foundation; Built as a house (one level)
- Exterior features: Fully fenced property; Wood exterior; Pasture vegetation; RV parking; On-site shop
Interior
- Bedrooms: 3 bedrooms (all on the main level)
- Bathrooms: 2 full bathrooms (both on the main level); 2 bathtubs
- Heating & cooling: Baseboard heating; No central air conditioning
- Interior features: Wood-burning fireplace; Fireplace in main living area
Neighborhood map
What this means for you Summary
Snapshot
- This is a 3-bed/2.0-bath single-family listed at $325k.
Deal economics
- At list price, monthly cash flow is $46 ($549/yr) — positive.
- The deal already cash-flows at list — no discount required.
- To meet the 1% rule (rent ≥ 1% of price), the offer needs to be $264k (18.7% below list).
- Recommended offer: $264k (18.7% below list) — sets the bar for 1% rule.
- Cap rate 6.5% vs local median 2.9% in Wenatchee — top-decile yield for the area; either an underpriced asset or a hidden risk that comps aren't pricing in. Stress-test before assuming the spread holds.
Location & tenants
- Location reads 72/100 on livability (#211 in WA) — a middle-class / working-renter tenant base. Strengths: health & safety A+, housing A, amenities B; Watch: crime C-, commute F.
- Eastmont School District (suburban): math 45% / reading 60% proficiency, ranked #118 of 291 in WA (top 40%) — acceptable for families but not a draw, mixed tenant base, ~2y average lease.
- Zoned schools: Cascade Elementary (615 students, 60% FRL); Eastmont Senior High (1,454 students, 62% FRL).
- Market conditions: Rents rising (+1.5%/yr); 326 active listings in the ZIP; 3 comparable units currently listed for rent nearby; rentals lingering (median 46d on market — plan ~5-8 weeks vacancy on turnover, expect pricing pressure); 100% of comp listings sitting > 30 days — soft ceiling on asking rent; solid renter incomes; 263 units permitted in Douglas County in 2024 (0 in 5+ unit buildings).
- This rent runs 36% of the median local income ($88k/yr) — at the standard rent-burdened threshold; future hikes will face affordability resistance.
Forward outlook
- Local home prices are declining (-3.0%/yr); year-one equity from $2k of loan paydown is wiped out by about $10k of value loss. Plan a longer hold.
- Douglas County population projected at +22% by 2050 — long-run rental-demand tailwind backs the buy-and-hold thesis.
Negotiation context
- Only 9 days on market — expect competitive offers; lowballing is unlikely to land.
Risks & watch-outs
- Watch-outs: built in 1947 — expect roof / HVAC / electrical / plumbing capex.
- Climate carrying-cost: major wildfire risk — expect insurance premiums to compound above CPI over the hold.
Questions for the listing agent
- Built in 1947 — when were the roof, HVAC, electrical panel, plumbing, and water heater last replaced?
- Is there a deadline driving the sale (1031 exchange, divorce, estate, relocation)? That informs how much negotiation room exists.
- What's the average days-on-market for RENTAL listings here right now (not sales)? A rising rental-DOM trend means longer vacancies and softer asking-rent achievability than the comps imply.
- What's the recent tenant-quality profile in this submarket — average credit score on applications, eviction rate, late-payment / NSF rate, and stable-employment percentage? A property-management company in the area should have these aggregated.
- How much new for-sale + rental construction is in the pipeline within 1–3 miles? Heavy new supply typically softens prices + rents 12–24 months out; constrained supply supports both.
Investment metrics
- 1% rule
- 0.81% ✗
- Cap rate
- 6.46%
- Cash-on-cash
- 0.60%
- DSCR
- 1.03
- GRM
- 10.2
CMA / ARV
- ARV (on-the-fly)
- $563,127
- Comps found
- 7
Show comp detail 7 sales within ~0.75 mi
| Address | Dist | Beds/Ba | Sqft | Sold | Price | $/sf | Match |
|---|---|---|---|---|---|---|---|
| 146 33rd St | 0.34mi | 3/2.0 | 1,816 (+9%) | 1mo | $599,000 | $330 | 69 |
| 326 Goldcrest St | 0.33mi | 3/2.5 | 1,780 (+6%) | 4mo | $550,000 | $309 | 68 |
| 3251 NW Empire Ave | 0.11mi | 2/2.0 (-1) | 1,560 (-7%) | 14mo | $649,000 | $416 | 67 |
| 464 Hawthorn Ct NW | 0.14mi | 3/2.0 | 1,848 (+11%) | 17mo | $625,000 | $338 | 61 |
| 2813 Cascade Rdg | 0.55mi | 3/2.0 | 1,767 (+6%) | 7mo | $595,500 | $337 | 59 |
| 321 Goldcrest St NW | 0.36mi | 3/2.0 | 1,466 (-12%) | 12mo | $470,000 | $321 | 53 |
| 3213 Vine St NE | 0.59mi | 3/2.0 | 1,839 (+10%) | 19mo | $635,000 | $345 | 40 |
Match score weights: distance 35% · size 25% · config 20% · recency 20%. Top-matched comps best support the ARV.
Projected returns pro-forma
-3.0% appreciation · 1.47% rent growth · sell at horizon
- IRR
- -16.9%
- Equity multiple
- 0.41×
- Total profit
- $-53,841
- Equity at exit
- $48,459
- IRR
- -11.7%
- Equity multiple
- 0.35×
- Total profit
- $-59,422
- Equity at exit
- $28,100
Cash invested: $91,000 (down + closing). Projections, not guarantees.
Landlord ↔ Tenant lean methodology
- Overall (STATE)
- 28 Tenant-Leaning
- State Washington
- 28 Tenant-Leaning · D+8
- County
- — inherits STATE
- City
- — inherits STATE
ZIP-level market 98802
- Rents YoY
- 1.5%
- Active inventory
- 326
- Price-to-rent
- 10.2×
Monthly cashflow live
- Estimated rent
- $2,643 medium interval (Pro) →
- Mortgage (P&I)
- −$1,704
- Tax from tax record
- −$202 /mo · $2,428/yr
- Insurance
- −$135
- HOA
- −$0
- Vacancy / Maint / Mgmt
- −$555
- Net cashflow
- $46
Break-even live
Sensitivity live
| Price | -10% $230 | -5% $138 | +0% $46 | +5% $-46 | +10% $-138 |
|---|---|---|---|---|---|
| Rent | -10% $-163 | -5% $-59 | +0% $46 | +5% $150 | +10% $255 |
| Rate | -1.0pp $209 | -0.5pp $128 | base $46 | +0.5pp $-38 | +1.0pp $-124 |
UW: 25.0% down · 7.5% · 30yr · 1.5% tax · 5.0% vac · 8.0% maint · 8.0% mgmt
Financing live
Cash to close
- Down payment
- $81,250
- Closing costs
- $9,750
- Reserves months
- —
- Total cash needed
- —
Loan-product check · same deal, 3 products live
Conventional
25% down · 7.5% · 30yr
- Down + closing
- —
- Monthly P&I
- —
- Monthly cashflow
- —
- DSCR
- —
- Eligible?
- —
Personal DTI + credit; lowest rate.
DSCR
20% down · 8.5% · 30yr
- Down + closing
- —
- Monthly P&I
- —
- Monthly cashflow
- —
- DSCR
- —
- Eligible?
- —
No personal income docs; deal must DSCR.
Hard money
10% down · 12.0% · 12mo
- Down + closing
- —
- Monthly P&I
- —
- Monthly cashflow
- —
- DSCR
- —
- Eligible?
- —
Short-term bridge; refi at stabilization.
Rent comps 3 comps
| Address | Beds | Baths | Sqft | Rent | $/sqft | DOM | Units | Dist |
|---|---|---|---|---|---|---|---|---|
| 321 27th St NW East Wenatchee, WA | 4.0 | 1.0 | 1200 | $2,495 | $2.08 | 45d | 1 | 0.55mi |
| 2869 Breckenridge Dr East Wenatchee, WA | 3.0 | 2.0 | 1805 | $2,750 | $1.52 | 45d | 1 | 0.77mi |
| 2210 Arden Ct N East Wenatchee, WA | 2.0 | 1.0 | 1250 | $2,150 | $1.72 | 45d | 1 | 1.22mi |
Listing history 9 events
-
2026-06-18status $325,000 Pending 9 DOM
-
2026-06-17days on market $325,000 Active 9 DOM
-
2026-06-16days on market $325,000 Active 8 DOM
-
2026-06-15days on market $325,000 Active 7 DOM
-
2026-06-14days on market $325,000 Active 5 DOM
-
2026-06-13days on market $325,000 Active 4 DOM
-
2026-06-10days on market $325,000 Active 2 DOM
-
2026-06-09remarks 395-char remark
-
2026-06-09$325,000 Active 1 DOM
ⓘ Source: listings_history table (triggers on properties + properties_extension) + one-shot
backfill from property_details.listing_events for pre-trigger history.
Tax reassessment forecast WA · Resets to sale price
- Current annual tax
- $2,428 · $202/mo
- Projected year-2 tax
- $3,185 · $265/mo
- Expected delta
- +$757/yr (+$63/mo · 31.2%)
ⓘ Screening estimate from a state-policy table — verify with the county assessor before closing.
Climate risk First Street
- Flood 1/10 Low FEMA zone X (shaded) · 0% chance over 30 yrs
- Wildfire 6/10 Major
- Heat 4/10 Moderate 7 d/yr ≥94°F today · 14 d/yr by 30 yrs out
- Wind 1/10 Low
- Air quality 10/10 Extreme 20 unhealthy d/yr today · 21 by 30 yrs out
Nearby sold comps map
Loading sold comps map…
Walkable amenities ~0.75 mi
Loading nearby amenities…
Taxation est. · year 1
- Rental income
- $31,715
- − Mortgage interest
- −$18,205
- − Property taxes
- −$2,428
- − Insurance
- −$1,625
- − Repairs & maintenance
- −$2,537
- − Management
- −$2,537
- − Depreciation
- −$9,455
- Taxable loss
- −$5,072
- Est. tax savings @ 24.0%
- +$1,217
- After-tax cash flow
- $1,767/yr
For passive investors: Depreciation is non-cash, so a rental often shows a tax loss while cash-flowing — sheltering income. Rental losses are passive: they offset passive income freely, and up to $25,000/yr can offset ordinary (W-2) income if you actively participate and your MAGI is under $100k (phasing out to $0 by $150k); unused losses carry forward. On sale, claimed depreciation is recaptured at up to 25%, and gains may owe capital-gains tax (a 1031 exchange can defer both). Figures are a year-1 estimate at your 24.0% rate — not tax advice; consult a CPA.
Schools (NCES district)
- District
- Eastmont School District
- NCES district ID
- 5302310
- Math proficiency
- 45% ▬ 0.00%
- Reading proficiency
- 60% ▲ 1.00%
- Median HH income
- $56,015
- Composite
- 47.31/100
- National rank
- #5047
- State rank
- #118 of 291 in WA
Livability — Wenatchee
- Score
- 72/100
- State rank
- #211
- US rank
- #6003
Category grades
Schools grade is shown separately in the Schools card above.
Census & demographics
- County
- Douglas County · 33,539 people
- City population
- 45,426
- Metro
- Wenatchee, WA
- Population (ZIP)
- 33,539
- Household income
- $87,744
- Rent vs Own
- Severe rent burden
- 741.0
Population outlook (Douglas County) Hauer SSP2
- Today (2025)
- 45,264 people
- By 2030
- 47,398 · +4.7%
- By 2040
- 51,407 · +13.6%
- By 2050
- 55,020 · +21.6%
- By 2075
- 63,862 · +41.1%
- By 2100
- 69,870 · +54.4%
Race, ethnicity, and origin ACS 2023
- Neighborhood character
- Majority White (63%)
- Race & ethnicity
- White 63% Hispanic / Latino 30% Two or more races 10% Asian 1%
- Hispanic origin (detail)
- Mexican 29%
- Common ancestry
- Lithuanian 3% Portuguese 3% Slovak 2%
- Foreign-born
- 14% · Canada
- Languages at home
- 76% English-only · Spanish 23% Other Indo-European 1%
Political lean MEDSL · Douglas
- 2024 margin
- Strong R (+27.0) · D 35.2% · R 62.1% · Other 2.7%
- 2008→2024 swing
- -5.6pp toward R · 2008: -21.4pp · 2024: -27.0pp
- All cycles
- 2024: R+27.0 2020: R+24.1 2016: R+31.5 2012: R+28.9 2008: R+21.4
Not yet ingested
- Civics
- —
Market trends
- HPI YoY
- ▼ -570.14%
- Current HPI
- 305.0094
- Rent YoY
- ▲ 1.47%
- Metro
- Wenatchee, WA
- State GDP YoY
- ▲ 4.65%
- F500 in state
- 22
Industry mix (Fortune 500 HQ in WA)
| Industry | F500 HQs | Revenue |
|---|---|---|
| Retail | 2 | $269B |
|
||
| Technology / Retail | 1 | $638B |
|
||
| Technology | 1 | $245B |
|
||
| Telecommunications | 1 | $38B |
|
||
| Food / Beverage | 1 | $36B |
|
||
| Automotive / Trucks | 1 | $34B |
|
||
Price history
1 event — show timeline
- 2026-06-08 Listed $325,000 NWMLS as Distributed by MLS Grid
Property tax history
+1.7%/yrLatest (2026): $2,428 · -0.7% YoY. Source: county tax records.
Cash-flow waterfall
monthlySold comps — $/sqft
last 12 mo · ≤1 miLoading sold comps…