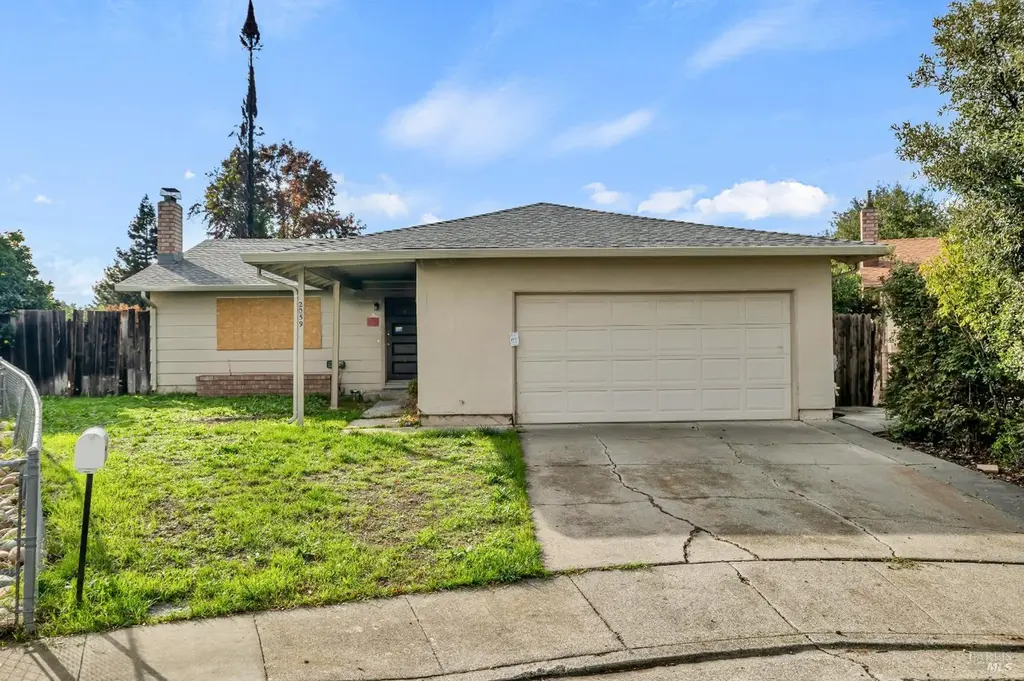
2059 Tilden Ct · Fairfield, CA
Flood risk 1/10 · Minimal
- FEMA flood zone
- X (unshaded)
- Chance of flooding over 30 yrs
- 0.0%
- Est. flood insurance / yr
- $507 – $1,088
Fire risk 6/10 · Moderate
- Est. fire insurance / yr
- $659 – $1,223
Heat risk 6/10 · Moderate
- Hot days now (above 97°F)
- 7 days/yr
- Hot days in 30 yrs
- 14 days/yr
Wind risk 1/10 · Minimal
- Chance of severe wind over 30 yrs
- —
Air-quality risk 10/10 · Severe
- Unhealthy air days now
- 21 days/yr
- Unhealthy air days in 30 yrs
- 22 days/yr
Risk factors via First Street. Map © Google.
Why this score? — see what drove the C- grade
The composite is a weighted blend of 9 inputs, each scored 0–100. Each bar is that input's sub-score; the figure is the points it added to the 100-point composite (weight × sub-score).
- Cash flow +15.2/30.0
- ARV discount +15.0/15.0
- DSCR +4.7/10.0
- Schools +3.5/10.0
- 1% rule +3.4/10.0
- Livability +3.4/5.0
- Rent growth +2.5/5.0
- Condition / age +2.5/5.0
- Appreciation +0.0/10.0
$315,000
🖨 Deal sheet (PDF) 📄 Offer letter ✓ Due diligence
Listing remarks
Opportunity Awaits in Fairfield! This 3-bedroom, 2-bath home offers 1,438 square feet of potential and is ready for the right buyer to bring it back to life. Located in an established neighborhood, the property has experienced fire damage, providing a unique chance for investors, contractors, or buyers looking to customize a home from the ground up. The spacious layout includes generously sized bedrooms and a comfortable floor plan that can be reimagined to suit modern living. Outside, the backyard features a built-in swimming pool an excellent foundation for creating a standout outdoor oasis once restored. Conveniently situated near shopping, dining, schools, and commuter routes, this pro
Key facts
- 5,663 sq ft lot
- 2 garage spots
- Pool
Property features AI
Finance
- Other: Property located in Dover Terrace subdivision; Directions available: From I-80 W, exit for Air Base Pkwy and merge onto Air Base. Turn right on Clay Bank Rd, left on Meadowlark Dr, right onto Tilden Ct to address.
- HOA & community: No homeowners association; Not a senior community
Exterior
- Parking: Attached garage facing front; 2 garage spaces; Paved driveway and paved sidewalk; Total parking for 2 vehicles
- Utilities: Public water; Public sewer
- Home design: Detached single-family home; Built in 1974; Described as a fixer
- Exterior features: Built-in private pool; Curb(s)
Interior
- Bedrooms: 3 bedrooms (main level)
- Bathrooms: 2 full bathrooms
- Heating & cooling: Heating: Other; Cooling: Other
- Interior features: Single-story layout; No basement; Backyard fenced
- Laundry & utility: Laundry facilities (details not specified)
Neighborhood map
What this means for you Summary
Snapshot
- This is a 3-bed/2.0-bath single-family listed at $315k.
Deal economics
- At list price, monthly cash flow is $111 ($1k/yr) — positive.
- The deal already cash-flows at list — no discount required.
- To meet the 1% rule (rent ≥ 1% of price), the offer needs to be $264k (16.1% below list).
- Recommended offer: $264k (16.1% below list) — sets the bar for 1% rule.
- Cap rate 6.7% vs local median 3.0% in Fairfield — top-decile yield for the area; either an underpriced asset or a hidden risk that comps aren't pricing in. Stress-test before assuming the spread holds.
Location & tenants
- Location reads 67/100 on livability (#314 in CA) — a middle-class / working-renter tenant base. Strengths: employment A+, housing A+, health & safety A+; Watch: schools C-, crime D-, commute F.
- Fairfield-Suisun Unified (urban): math 23% / reading 53% proficiency, ranked #238 of 517 in CA (top 46%) — families likely to look elsewhere, expect single-tenant / working-renter base with shorter leases.
- Market conditions: Rents flat; 264 active listings in the ZIP; 34 comparable units currently listed for rent nearby; rentals lingering (median 45d on market — plan ~5-8 weeks vacancy on turnover, expect pricing pressure); 50% of comp listings sitting > 30 days — soft ceiling on asking rent; solid renter incomes; 1,472 units permitted in Solano County in 2024 (131 in 5+ unit buildings).
- This rent runs 36% of the median local income ($87k/yr) — at the standard rent-burdened threshold; future hikes will face affordability resistance.
Forward outlook
- Local home prices are declining (-3.0%/yr); year-one equity from $2k of loan paydown is wiped out by about $9k of value loss. Plan a longer hold.
- Solano County population projected at +15% by 2050 — modest demand growth; plan on rents tracking national, not racing it.
Negotiation context
- Only 5 days on market — expect competitive offers; lowballing is unlikely to land.
Risks & watch-outs
- Climate carrying-cost: major wildfire risk; extreme-heat days projected 7→14/yr by 2055 (HVAC capex compounding) — expect insurance premiums to compound above CPI over the hold.
Questions for the listing agent
- Built in 1974 — when were the roof, HVAC, electrical panel, plumbing, and water heater last replaced?
- Is there a deadline driving the sale (1031 exchange, divorce, estate, relocation)? That informs how much negotiation room exists.
- Crime grade is D in this area — have there been break-ins, vandalism, or insurance claims at this property in the last 3 years? What carrier currently insures it and at what premium?
- What's the average days-on-market for RENTAL listings here right now (not sales)? A rising rental-DOM trend means longer vacancies and softer asking-rent achievability than the comps imply.
- What's the recent tenant-quality profile in this submarket — average credit score on applications, eviction rate, late-payment / NSF rate, and stable-employment percentage? A property-management company in the area should have these aggregated.
- How much new for-sale + rental construction is in the pipeline within 1–3 miles? Heavy new supply typically softens prices + rents 12–24 months out; constrained supply supports both.
Investment metrics
- 1% rule
- 0.84% ✗
- Cap rate
- 6.72%
- Cash-on-cash
- 1.51%
- DSCR
- 1.07
- GRM
- 9.9
CMA / ARV
- ARV (median comp)
- $573,160
- List price
- $315,000
- Delta
- -45.04%
- Verdict
- UNDERPRICED
- Comps
- 20 within 1.0 mi
Show comp detail 12 sales within ~0.75 mi
| Address | Dist | Beds/Ba | Sqft | Sold | Price | $/sf | Match |
|---|---|---|---|---|---|---|---|
| 2059 Tilden Ct | 0.00mi | 3/2.0 | 1,438 (0%) | 1mo | $310,000 | $216 | 99 |
| 1625 Meadowlark Dr | 0.18mi | 3/2.0 | 1,438 (0%) | 1mo | $535,000 | $372 | 91 |
| 2351 Twain Ct | 0.27mi | 3/2.0 | 1,438 (0%) | 4mo | $535,000 | $372 | 84 |
| 2120 Merritt Pl | 0.22mi | 3/2.0 | 1,438 (0%) | 7mo | $525,000 | $365 | 84 |
| 1312 Sutter Ct | 0.33mi | 3/2.0 | 1,438 (0%) | 2mo | $525,000 | $365 | 83 |
| 2045 Wylie Ct | 0.09mi | 4/2.0 (+1) | 1,618 (+12%) | 2mo | $570,000 | $352 | 68 |
| 1464 Descanso Ln | 0.57mi | 3/2.5 | 1,516 (+5%) | 2mo | $585,000 | $386 | 61 |
| 1168 Sanderling Dr | 0.49mi | 4/2.0 (+1) | 1,380 (-4%) | 6mo | $520,000 | $377 | 61 |
| 2538 Aspire Way | 0.67mi | 3/2.5 | 1,516 (+5%) | 6mo | $590,000 | $389 | 53 |
| 2142 Kingfisher Way | 0.58mi | 4/2.0 (+1) | 1,608 (+12%) | 1mo | $530,000 | $330 | 48 |
| 2202 Sandpiper Dr | 0.54mi | 4/2.0 (+1) | 1,608 (+12%) | 3mo | $421,000 | $262 | 47 |
| 2350 Gull Ct | 0.52mi | 4/2.0 (+1) | 1,608 (+12%) | 6mo | $540,000 | $336 | 46 |
Match score weights: distance 35% · size 25% · config 20% · recency 20%. Top-matched comps best support the ARV.
Projected returns pro-forma
-3.0% appreciation · 0.15% rent growth · sell at horizon
- IRR
- -16.9%
- Equity multiple
- 0.42×
- Total profit
- $-51,422
- Equity at exit
- $46,968
- IRR
- -14.5%
- Equity multiple
- 0.27×
- Total profit
- $-64,572
- Equity at exit
- $27,235
Cash invested: $88,200 (down + closing). Projections, not guarantees.
Landlord ↔ Tenant lean methodology
- Overall (STATE)
- 18 Strongly Tenant-Friendly
- State California
- 18 Strongly Tenant-Friendly · D+13
- County
- — inherits STATE
- City
- — inherits STATE
ZIP-level market 94533
- Rents YoY
- 0.1%
- Active inventory
- 264
- Price-to-rent
- 9.9×
Monthly cashflow live
- Estimated rent
- $2,643 high interval (Pro) →
- Mortgage (P&I)
- −$1,652
- Tax from tax record
- −$194 /mo · $2,329/yr
- Insurance
- −$131
- HOA
- −$0
- Vacancy / Maint / Mgmt
- −$555
- Net cashflow
- $111
Break-even live
Sensitivity live
| Price | -10% $289 | -5% $200 | +0% $111 | +5% $22 | +10% $-67 |
|---|---|---|---|---|---|
| Rent | -10% $-98 | -5% $7 | +0% $111 | +5% $215 | +10% $320 |
| Rate | -1.0pp $270 | -0.5pp $191 | base $111 | +0.5pp $29 | +1.0pp $-54 |
UW: 25.0% down · 7.5% · 30yr · 1.5% tax · 5.0% vac · 8.0% maint · 8.0% mgmt
Financing live
Cash to close
- Down payment
- $78,750
- Closing costs
- $9,450
- Reserves months
- —
- Total cash needed
- —
Loan-product check · same deal, 3 products live
Conventional
25% down · 7.5% · 30yr
- Down + closing
- —
- Monthly P&I
- —
- Monthly cashflow
- —
- DSCR
- —
- Eligible?
- —
Personal DTI + credit; lowest rate.
DSCR
20% down · 8.5% · 30yr
- Down + closing
- —
- Monthly P&I
- —
- Monthly cashflow
- —
- DSCR
- —
- Eligible?
- —
No personal income docs; deal must DSCR.
Hard money
10% down · 12.0% · 12mo
- Down + closing
- —
- Monthly P&I
- —
- Monthly cashflow
- —
- DSCR
- —
- Eligible?
- —
Short-term bridge; refi at stabilization.
Rent comps 34 comps
| Address | Beds | Baths | Sqft | Rent | $/sqft | DOM | Units | Dist |
|---|---|---|---|---|---|---|---|---|
| 1431 Catlin Ct Fairfield, CA | 3.0 | 2.0 | 1696 | $2,750 | $1.62 | 44d | 1 | 0.16mi |
| 2000 Clay Bank Rd Fairfield, CA | 1.0–2.0 | 1.0–2.0 | 834 | $2,719 | $3.26 | 3d | 10 | 0.34mi |
| 89 Villa Cir Fairfield, CA | 2.0 | 1.5 | 968 | $1,900 | $1.96 | 24d | 1 | 0.53mi |
| 1990 Grande Cir Fairfield, CA | 2.0 | 1.0–1.5 | 895 | $2,135 | $2.39 | 3d | 15 | 0.57mi |
| 1930 Grande Cir #77 Fairfield, CA | 2.0 | 2.0 | 1095 | $1,750 | $1.60 | 44d | 1 | 0.57mi |
| 1970 Grande Cir #19 Fairfield, CA | 2.0 | 1.5 | 1095 | $2,200 | $2.01 | 24d | 1 | 0.59mi |
| 1960 Grande Cir #42 Fairfield, CA | 3.0 | 1.5 | 1176 | $2,500 | $2.13 | 44d | 1 | 0.62mi |
| 1335 Phillip Way Suisun City, CA | 3.0 | 2.5 | 1606 | $3,000 | $1.87 | 14d | 1 | 0.65mi |
| 1930 Manor Pl Unit 1 Fairfield, CA | 2.0 | 1.5 | 1100 | $2,150 | $1.95 | 22d | 1 | 0.69mi |
| 1400 Humphrey Dr Suisun City, CA | 2.0–3.0 | 1.5 | 1075 | $2,425 | $2.26 | 4d | 4 | 0.70mi |
| 1955 Grande Cir Unit U Fairfield, CA | 2.0 | 1.5 | 964 | $1,800 | $1.87 | 14d | 1 | 0.70mi |
| 1955 Grande Cir Unit U Fairfield, CA | 2.0 | 1.5 | 964 | $1,800 | $1.87 | 44d | 1 | 0.70mi |
| 2776 Woodmont Dr Fairfield, CA | 3.0 | 2.5 | 1578 | $2,995 | $1.90 | 44d | 1 | 0.81mi |
| 1037 Mockingbird Ln Fairfield, CA | 3.0 | 2.0 | 1476 | $2,695 | $1.83 | 44d | 1 | 0.82mi |
| 2751 Peppertree Dr Fairfield, CA | 2.0 | 1.0–2.0 | 726 | $2,175 | $2.99 | 14d | 7 | 0.99mi |
| 1349 Blossom Ave Fairfield, CA | 1.0–3.0 | 1.0–3.0 | 1017 | $3,340 | $3.28 | 2d | 11 | 0.99mi |
| 849 Finch Way Fairfield, CA | 3.0 | 2.0 | 1300 | $2,895 | $2.23 | 44d | 1 | 1.00mi |
| 849 Finch Way Fairfield, CA | 3.0 | 2.0 | 1300 | $2,895 | $2.23 | 45d | 1 | 1.00mi |
| 1777 Daniel Ct Fairfield, CA | 3.0 | 2.5 | 1600 | $2,955 | $1.85 | 24d | 1 | 1.09mi |
| 995 Matthew Ct Fairfield, CA | 4.0 | 2.0 | 1560 | $3,150 | $2.02 | 44d | 1 | 1.13mi |
| 766 E Tabor Ave Unit 12 Fairfield, CA | 2.0 | 1.0 | 950 | $1,750 | $1.84 | 44d | 1 | 1.15mi |
| 145 Del Rey Ct Fairfield, CA | 3.0 | 1.5 | 1164 | $2,500 | $2.15 | 14d | 1 | 1.16mi |
| 1648 Little Rock Cir Suisun City, CA | 3.0 | 3.0 | 1839 | $3,300 | $1.79 | 22d | 1 | 1.17mi |
| 1648 Little Rock Cir Suisun City, CA | 3.0 | 3.0 | 1839 | $3,300 | $1.79 | 44d | 1 | 1.17mi |
| 1890 Dover Ave Fairfield, CA | 1.0–2.0 | 1.0–2.0 | 835 | $1,995 | $2.39 | 14d | 2 | 1.27mi |
| 708 E Tabor Ave Unit 76612 Fairfield, CA | 2.0 | 1.0 | 950 | $1,750 | $1.84 | 44d | 1 | 1.28mi |
| 53 El Basset Ct Fairfield, CA | 2.0 | 1.5 | 997 | $2,100 | $2.11 | 14d | 1 | 1.29mi |
| 2275 Dover Ave Fairfield, CA | 4.0 | 2.0 | 1468 | $3,100 | $2.11 | 44d | 1 | 1.34mi |
| 713 E Travis Blvd Fairfield, CA | 1.0–2.0 | 1.0–1.5 | 827 | $2,277 | $2.75 | 44d | 1 | 1.42mi |
| 745 Monte Carlo Dr Suisun City, CA | 4.0 | 3.0 | 1775 | $3,400 | $1.92 | 14d | 1 | 1.42mi |
| 2217 Santa Fe Ct Fairfield, CA | 3.0 | 2.0 | 1398 | $2,700 | $1.93 | 44d | 1 | 1.45mi |
| 519 San Remo St Fairfield, CA | 3.0 | 2.0 | 1860 | $2,700 | $1.45 | 44d | 1 | 1.46mi |
| 1104 Waxwing Dr Suisun City, CA | 3.0 | 2.0 | 1279 | $3,079 | $2.41 | 44d | 1 | 1.46mi |
| 2800 Dover Ave Unit G6 Fairfield, CA | 2.0 | 1.0 | 950 | $2,095 | $2.21 | 24d | 1 | 1.49mi |
Listing history 4 events
-
2026-04-09soldstatus $235,000
-
2005-05-26soldstatus $425,000
-
1993-10-29soldstatus $130,830
-
1992-04-22soldstatus $140,000
ⓘ Source: listings_history table (triggers on properties + properties_extension) + one-shot
backfill from property_details.listing_events for pre-trigger history.
Tax reassessment forecast CA · Resets to sale price
- Current annual tax
- $2,329 · $194/mo
- Projected year-2 tax
- $2,394 · $200/mo
- Expected delta
- +$65/yr (+$5/mo · 2.8%)
ⓘ Screening estimate from a state-policy table — verify with the county assessor before closing.
Climate risk First Street
- Flood 1/10 Low FEMA zone X (unshaded) · 0% chance over 30 yrs
- Wildfire 6/10 Major
- Heat 6/10 Major 7 d/yr ≥97°F today · 14 d/yr by 30 yrs out
- Wind 1/10 Low
- Air quality 10/10 Extreme 21 unhealthy d/yr today · 22 by 30 yrs out
Nearby sold comps map
Loading sold comps map…
Walkable amenities ~0.75 mi
Loading nearby amenities…
Taxation est. · year 1
- Rental income
- $31,721
- − Mortgage interest
- −$17,645
- − Property taxes
- −$2,329
- − Insurance
- −$1,575
- − Repairs & maintenance
- −$2,538
- − Management
- −$2,538
- − Depreciation
- −$9,164
- Taxable loss
- −$4,067
- Est. tax savings @ 24.0%
- +$976
- After-tax cash flow
- $2,309/yr
For passive investors: Depreciation is non-cash, so a rental often shows a tax loss while cash-flowing — sheltering income. Rental losses are passive: they offset passive income freely, and up to $25,000/yr can offset ordinary (W-2) income if you actively participate and your MAGI is under $100k (phasing out to $0 by $150k); unused losses carry forward. On sale, claimed depreciation is recaptured at up to 25%, and gains may owe capital-gains tax (a 1031 exchange can defer both). Figures are a year-1 estimate at your 24.0% rate — not tax advice; consult a CPA.
Schools (NCES district)
- District
- Fairfield-Suisun Unified
- NCES district ID
- 0613360
- Math proficiency
- 23% ▼ -10.00%
- Reading proficiency
- 53% ▲ 8.00%
- Median HH income
- $69,654
- Composite
- 34.59/100
- National rank
- #5157
- State rank
- #238 of 517 in CA
Livability — Fairfield
- Score
- 67/100
- State rank
- #314
- US rank
- #10551
Category grades
Schools grade is shown separately in the Schools card above.
Census & demographics
- Census place
- Fairfield, CA
- County
- Solano County · 433,239 people
- City population
- 120,008
- Metro
- Vallejo, CA
- Population (ZIP)
- 78,805
- Household income
- $87,384
- Rent vs Own
- Severe rent burden
- 3474.0
Population outlook (Solano County) Hauer SSP2
- Today (2025)
- 478,685 people
- By 2030
- 497,974 · +4.0%
- By 2040
- 528,515 · +10.4%
- By 2050
- 549,115 · +14.7%
- By 2075
- 587,229 · +22.7%
- By 2100
- 571,378 · +19.4%
Race, ethnicity, and origin ACS 2023
- Neighborhood character
- Highly diverse neighborhood (Simpson 0.75)
- Race & ethnicity
- Hispanic / Latino 39% White 23% Black 16% Two or more races 16% Asian 14% Pacific Islander 1%
- Hispanic origin (detail)
- Mexican 34%
- Common ancestry
- Italian 5% Lithuanian 1% Slovak 1%
- Foreign-born
- 26% · Canada, Vietnam, China
- Languages at home
- 59% English-only · Spanish 28% Tagalog/Filipino 6% Other Indo-European 2%
Political lean MEDSL · Solano
- 2024 margin
- Strong D (+23.0) · D 60.0% · R 37.1% · Other 2.9%
- 2008→2024 swing
- -5.6pp toward R · 2008: 28.6pp · 2024: 23.0pp
- All cycles
- 2024: D+23.0 2020: D+30.3 2016: D+30.5 2012: D+28.1 2008: D+28.6
Not yet ingested
- Civics
- —
Market trends
- HPI YoY
- ▼ -258.88%
- Current HPI
- 285.4365
- Rent YoY
- ▲ 0.15%
- Metro
- Vallejo, CA
- State GDP YoY
- ▲ 3.21%
- F500 in state
- 116
Industry mix (Fortune 500 HQ in CA)
| Industry | F500 HQs | Revenue |
|---|---|---|
| Technology | 27 | $1,492B |
|
||
| Financial Services | 3 | $174B |
|
||
| Retail | 3 | $44B |
|
||
| Insurance | 3 | $26B |
|
||
| Media / Entertainment | 2 | $115B |
|
||
| Pharmaceuticals / Biotech | 2 | $62B |
|
||
Price history
+121.4% since first listed5 events — show timeline
- 2026-05-28 Sold (Public Records) $310,000 Public Records
- 2026-04-09 Sold (Public Records) $235,000 Public Records
- 2005-05-26 Sold (Public Records) $425,000 Public Records
- 1993-10-29 Sold (Public Records) $130,830 Public Records
- 1992-04-22 Sold (Public Records) $140,000 Public Records
Property tax history
-2.3%/yrLatest (2025): $2,329 · -0.0% YoY. Source: county tax records.
Cash-flow waterfall
monthlySold comps — $/sqft
last 12 mo · ≤1 miLoading sold comps…