721 Quebec Dr · McDonald Chapel, AL
Flood risk 1/10 · Minimal
- FEMA flood zone
- X (unshaded)
- Chance of flooding over 30 yrs
- 0.0%
- Est. flood insurance / yr
- $507 – $1,088
Fire risk 3/10 · Minor
- Est. fire insurance / yr
- $916 – $1,700
Heat risk 6/10 · Moderate
- Hot days now (above 107°F)
- 7 days/yr
- Hot days in 30 yrs
- 20 days/yr
Wind risk 6/10 · Moderate
- Chance of severe wind over 30 yrs
- 27.0%
Air-quality risk 4/10 · Minor
- Unhealthy air days now
- 5 days/yr
- Unhealthy air days in 30 yrs
- 5 days/yr
Risk factors via First Street. Map © Google.
Why this score? — see what drove the B- grade
The composite is a weighted blend of 9 inputs, each scored 0–100. Each bar is that input's sub-score; the figure is the points it added to the 100-point composite (weight × sub-score).
- Cash flow +30.0/30.0
- 1% rule +10.0/10.0
- DSCR +10.0/10.0
- ARV discount +7.5/15.0
- Livability +2.9/5.0
- Rent growth +2.5/5.0
- Condition / age +2.5/5.0
- Schools +1.8/10.0
- Appreciation +0.0/10.0
$59,000
🖨 Deal sheet (PDF) 📄 Offer letter ✓ Due diligence
Listing remarks
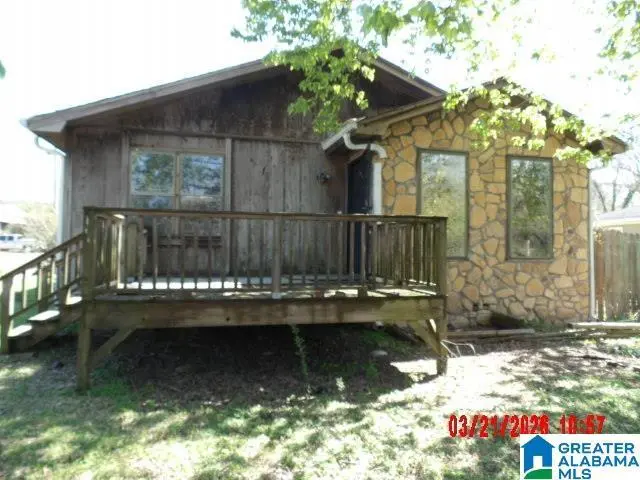
This is a must see, has 3 bedrooms, 2 full baths, living room, dining room, kitchen, laundry, corner lot.
Key facts
- 6,969 sq ft lot
- Parking
- Built 1948
Neighborhood map
What this means for you Summary
Snapshot
- This is a 3-bed/1.0-bath single-family listed at $59k.
Deal economics
- At list price, monthly cash flow is $513 ($6k/yr) — positive.
- The deal already cash-flows at list — no discount required.
- Meets the 1% rule at list price ($1k rent vs $59k).
- Recommended offer: $58k (1.5% below list) — sets the bar for market timing.
Location & tenants
- Location reads 58/100 on livability (#365 in AL) — a working-class tenant base; expect higher turnover. Strengths: cost of living A+, housing A+; Watch: commute D, crime D-, amenities F.
- Jefferson County (suburban): math 9% / reading 32% proficiency, ranked #104 of 129 in AL (top 81%) — low school quality limits family demand, transient renter base, plan for 1-2y turnover.
- Zoned schools: Minor Community School (math 2% / reading 17%, grade F, #568 of 627 statewide, top 94%, 409 students, 84% FRL); Minor Middle School (math 0% / reading 18%, grade F, #235 of 257 statewide, top 93%, 728 students, 88% FRL); Minor High School (math 4% / reading 8%, grade F, #275 of 305 statewide, top 90%, 915 students, 84% FRL) — zoned schools average 85% FRL vs 49% district-wide (37 pts higher); higher-poverty schools than district average — tighter screening recommended.
- Zoned-school proficiency averages 8% at this address vs 20% district-wide (-12 pts) — the specific schools serving this property underperform the Jefferson County average; the district grade overstates school quality for this exact location.
- Market conditions: 43 active listings in the ZIP; 15 comparable units currently listed for rent nearby; rentals at typical pace (median 25d on market — plan ~3-4 weeks tenant-placement turnaround); 40% of comp listings sitting > 30 days — soft ceiling on asking rent; 2,114 units permitted in Jefferson County in 2024 (556 in 5+ unit buildings).
Forward outlook
- Local home prices are declining (-3.0%/yr); year-one equity from $408 of loan paydown is wiped out by about $2k of value loss. Plan a longer hold.
- Jefferson County population projected to shrink 4% by 2050 — rents likely to lag national; underwrite the cash flow, not the appreciation.
- At projected returns (-3.0% appreciation + 3.0% rent growth), your $17k cash investment doubles in ~4 years — after that, you're playing with house money.
Negotiation context
- It's been on market 17 days — a 2% lower offer ($58k) is reasonable based on typical stale-listing flexibility.
- Current owner paid $36k; list at $59k implies a 62% gain — meaningful room to come down on a strong offer.
Risks & watch-outs
- Watch-outs: built in 1948 — expect roof / HVAC / electrical / plumbing capex.
- Climate carrying-cost: major wind risk, 27% chance of damaging wind over 30y; extreme-heat days projected 7→20/yr by 2055 (HVAC capex compounding) — expect insurance premiums to compound above CPI over the hold.
Questions for the listing agent
- Built in 1948 — when were the roof, HVAC, electrical panel, plumbing, and water heater last replaced?
- Is there a deadline driving the sale (1031 exchange, divorce, estate, relocation)? That informs how much negotiation room exists.
- Schools are F-rated, which usually means shorter tenancies and higher turnover. Who's the typical renter profile here, and what's been the actual vacancy rate?
- Crime grade is D in this area — have there been break-ins, vandalism, or insurance claims at this property in the last 3 years? What carrier currently insures it and at what premium?
- What's the average days-on-market for RENTAL listings here right now (not sales)? A rising rental-DOM trend means longer vacancies and softer asking-rent achievability than the comps imply.
- What's the recent tenant-quality profile in this submarket — average credit score on applications, eviction rate, late-payment / NSF rate, and stable-employment percentage? A property-management company in the area should have these aggregated.
- How much new for-sale + rental construction is in the pipeline within 1–3 miles? Heavy new supply typically softens prices + rents 12–24 months out; constrained supply supports both.
Investment metrics
- 1% rule
- 1.98% ✓
- Cap rate
- 16.73%
- Cash-on-cash
- 37.27%
- DSCR
- 2.66
- GRM
- 4.2
CMA / ARV
- ARV (on-the-fly)
- $125,832
- Comps found
- 9
Show comp detail 9 sales within ~0.75 mi
| Address | Dist | Beds/Ba | Sqft | Sold | Price | $/sf | Match |
|---|---|---|---|---|---|---|---|
| 5113 Iceland Ct | 0.21mi | 3/2.0 | 1,560 (+4%) | 13mo | $177,400 | $114 | 69 |
| 5232 Iceland Ave | 0.10mi | 3/1.0 | 1,310 (-13%) | 22mo | $85,900 | $66 | 56 |
| 1113 Xavier St | 0.55mi | 3/2.0 | 1,460 (-2%) | 14mo | $195,000 | $134 | 55 |
| 1217 Xavier St | 0.57mi | 3/3.0 | 1,507 (+1%) | 12mo | $220,000 | $146 | 54 |
| 5712 Mexico Ave | 0.47mi | 3/1.0 | 1,372 (-8%) | 14mo | $95,000 | $69 | 52 |
| 1119 N Indiana St | 0.66mi | 3/1.5 | 1,485 (-1%) | 21mo | $25,000 | $17 | 48 |
| 1008 Utica Pl | 0.42mi | 3/3.0 | 1,607 (+7%) | 20mo | $50,000 | $31 | 44 |
| 1024 Xavier St | 0.57mi | 3/2.0 | 1,666 (+11%) | 12mo | $140,000 | $84 | 41 |
| 1221 Xavier St | 0.58mi | 4/3.0 (+1) | 1,693 (+13%) | 9mo | $227,000 | $134 | 30 |
Match score weights: distance 35% · size 25% · config 20% · recency 20%. Top-matched comps best support the ARV.
Projected returns pro-forma
-3.0% appreciation · 3.0% rent growth · sell at horizon
- IRR
- 33.2%
- Equity multiple
- 2.40×
- Total profit
- $23,135
- Equity at exit
- $8,797
- IRR
- 40.2%
- Equity multiple
- 4.77×
- Total profit
- $62,295
- Equity at exit
- $5,101
Cash invested: $16,520 (down + closing). Projections, not guarantees.
Landlord ↔ Tenant lean methodology
- Overall (STATE)
- 90 Strongly Landlord-Friendly
- State Alabama
- 90 Strongly Landlord-Friendly · R+15
- County
- — inherits STATE
- City
- — inherits STATE
ZIP-level market 35224
- Home prices YoY
- -16.2%
- Active inventory
- 43
- Price-to-rent
- 4.2×
Monthly cashflow live
- Estimated rent
- $1,166 high interval (Pro) →
- Mortgage (P&I)
- −$309
- Tax est. 1.5%
- −$74 /mo · $885/yr
- Insurance
- −$25
- HOA
- −$0
- Vacancy / Maint / Mgmt
- −$245
- Net cashflow
- $513
Break-even live
Sensitivity live
| Price | -10% $554 | -5% $533 | +0% $513 | +5% $493 | +10% $472 |
|---|---|---|---|---|---|
| Rent | -10% $421 | -5% $467 | +0% $513 | +5% $559 | +10% $605 |
| Rate | -1.0pp $543 | -0.5pp $528 | base $513 | +0.5pp $498 | +1.0pp $482 |
UW: 25.0% down · 7.5% · 30yr · 1.5% tax · 5.0% vac · 8.0% maint · 8.0% mgmt
Financing live
Cash to close
- Down payment
- $14,750
- Closing costs
- $1,770
- Reserves months
- —
- Total cash needed
- —
Loan-product check · same deal, 3 products live
Conventional
25% down · 7.5% · 30yr
- Down + closing
- —
- Monthly P&I
- —
- Monthly cashflow
- —
- DSCR
- —
- Eligible?
- —
Personal DTI + credit; lowest rate.
DSCR
20% down · 8.5% · 30yr
- Down + closing
- —
- Monthly P&I
- —
- Monthly cashflow
- —
- DSCR
- —
- Eligible?
- —
No personal income docs; deal must DSCR.
Hard money
10% down · 12.0% · 12mo
- Down + closing
- —
- Monthly P&I
- —
- Monthly cashflow
- —
- DSCR
- —
- Eligible?
- —
Short-term bridge; refi at stabilization.
Rent comps 15 comps
| Address | Beds | Baths | Sqft | Rent | $/sqft | DOM | Units | Dist |
|---|---|---|---|---|---|---|---|---|
| 5804 Norway Ave Birmingham, AL | 2.0 | 2.0 | 1564 | $1,200 | $0.77 | 25d | 1 | 0.57mi |
| 4800 Norway Ave Birmingham, AL | 3.0 | 1.0 | 1080 | $1,200 | $1.11 | 3d | 1 | 0.65mi |
| 1300 Yukon St Birmingham, AL | 3.0 | 2.0 | 1038 | $1,125 | $1.08 | 45d | 1 | 0.69mi |
| 229 Oregon St Birmingham, AL | 3.0 | 1.0 | 1044 | $1,200 | $1.15 | 17d | 1 | 0.70mi |
| 229 Oregon St Birmingham, AL | 3.0 | 1.0 | 1044 | $1,200 | $1.15 | 16d | 1 | 0.70mi |
| 304 Nevada St Birmingham, AL | 3.0 | 1.0 | 1160 | $1,200 | $1.03 | 45d | 1 | 0.75mi |
| 5223 Loop Rd Birmingham, AL | 3.0 | 1.0 | 1392 | $1,100 | $0.79 | 45d | 1 | 0.88mi |
| 528 Oregon St Birmingham, AL | 3.0 | 1.0 | 1165 | $1,200 | $1.03 | 45d | 1 | 0.92mi |
| 604 Lexington St Birmingham, AL | 3.0 | 1.5 | 993 | $1,200 | $1.21 | 45d | 1 | 1.04mi |
| 960 Minor Dr Birmingham, AL | 3.0 | 1.5 | 1299 | $1,295 | $1.00 | 25d | 1 | 1.06mi |
| 761 Crowne Rd Birmingham, AL | 3.0 | 2.0 | 1068 | $1,200 | $1.12 | 3d | 1 | 1.06mi |
| 4623 6th Ave Birmingham, AL | 3.0 | 1.0 | 1421 | $1,175 | $0.83 | 13d | 1 | 1.08mi |
| 538 Gulfport St Birmingham, AL | 3.0 | 1.0 | 1036 | $850 | $0.82 | 45d | 1 | 1.22mi |
| 504 Templeton Rd Birmingham, AL | 3.0 | 2.0 | 1508 | $950 | $0.63 | 5d | 1 | 1.36mi |
| 1050 McDonald Chapel Rd Birmingham, AL | 3.0 | 1.5 | 1454 | $1,250 | $0.86 | 25d | 1 | 1.40mi |
Listing history 3 events
-
2026-04-09status Pending
-
2026-03-23$59,000 Active
-
1986-07-01soldstatus $36,500
ⓘ Source: listings_history table (triggers on properties + properties_extension) + one-shot
backfill from property_details.listing_events for pre-trigger history.
Climate risk First Street
- Flood 1/10 Low FEMA zone X (unshaded) · 0% chance over 30 yrs
- Wildfire 3/10 Moderate
- Heat 6/10 Major 7 d/yr ≥107°F today · 20 d/yr by 30 yrs out
- Wind 6/10 Major 27% chance of damaging wind over 30 yrs
- Air quality 4/10 Moderate 5 unhealthy d/yr today · 5 by 30 yrs out
Nearby sold comps map
Loading sold comps map…
Walkable amenities ~0.75 mi
Loading nearby amenities…
Taxation est. · year 1
- Rental income
- $13,987
- − Mortgage interest
- −$3,305
- − Property taxes
- −$885
- − Insurance
- −$295
- − Repairs & maintenance
- −$1,119
- − Management
- −$1,119
- − Depreciation
- −$1,716
- Taxable income
- $5,548
- Est. tax owed @ 24.0%
- −$1,331
- After-tax cash flow
- $4,825/yr
For passive investors: Depreciation is non-cash, so a rental often shows a tax loss while cash-flowing — sheltering income. Rental losses are passive: they offset passive income freely, and up to $25,000/yr can offset ordinary (W-2) income if you actively participate and your MAGI is under $100k (phasing out to $0 by $150k); unused losses carry forward. On sale, claimed depreciation is recaptured at up to 25%, and gains may owe capital-gains tax (a 1031 exchange can defer both). Figures are a year-1 estimate at your 24.0% rate — not tax advice; consult a CPA.
Schools (NCES district)
- District
- Jefferson County
- NCES district ID
- 0101920
- Math proficiency
- 9% ▼ -24.00%
- Reading proficiency
- 32% ▼ -5.00%
- Median HH income
- $51,712
- Composite
- 18.4/100
- National rank
- #8937
- State rank
- #104 of 129 in AL
Livability — McDonald Chapel
- Score
- 58/100
- State rank
- #365
- US rank
- #21203
Category grades
Schools grade is shown separately in the Schools card above.
Census & demographics
- Census place
- McDonald Chapel, AL
- Population (ZIP)
- 5,409
Population outlook (Jefferson County) Hauer SSP2
- Today (2025)
- 669,185 people
- By 2030
- 669,694 · +0.1%
- By 2040
- 661,388 · -1.2%
- By 2050
- 643,086 · -3.9%
- By 2075
- 577,267 · -13.7%
- By 2100
- 474,758 · -29.1%
Race, ethnicity, and origin ACS 2023
- Neighborhood character
- Predominantly Black (69%)
- Race & ethnicity
- Black 69% White 22% Two or more races 5% Hispanic / Latino 3% Native American 1%
- Common ancestry
- Slovak 0%
- Foreign-born
- 2% · Canada
- Languages at home
- 97% English-only · Spanish 3%
Political lean MEDSL · Jefferson
- 2024 margin
- D (+10.4) · D 54.6% · R 44.2% · Other 1.2%
- 2008→2024 swing
- +5.4pp toward D · 2008: 5.1pp · 2024: 10.4pp
- All cycles
- 2024: D+10.4 2020: D+13.2 2016: D+7.2 2012: D+6.0 2008: D+5.1
Not yet ingested
- Civics
- —
Market trends
- HPI YoY
- ▼ -24.47%
- Current HPI
- 126.3423
- Rent YoY
- —
- Metro
- —
- State GDP YoY
- ▲ 2.94%
- F500 in state
- 4
Industry mix (Fortune 500 HQ in AL)
| Industry | F500 HQs | Revenue |
|---|---|---|
| Financial Services | 1 | $8B |
|
||
| Healthcare | 1 | $5B |
|
||
Price history
+61.6% since first listed3 events — show timeline
- 2026-04-09 Pending — Greater Alabama MLS
- 2026-03-23 Listed $59,000 Greater Alabama MLS
- 1986-07-01 Sold (Public Records) $36,500 Public Records
Cash-flow waterfall
monthlySold comps — $/sqft
last 12 mo · ≤1 miLoading sold comps…