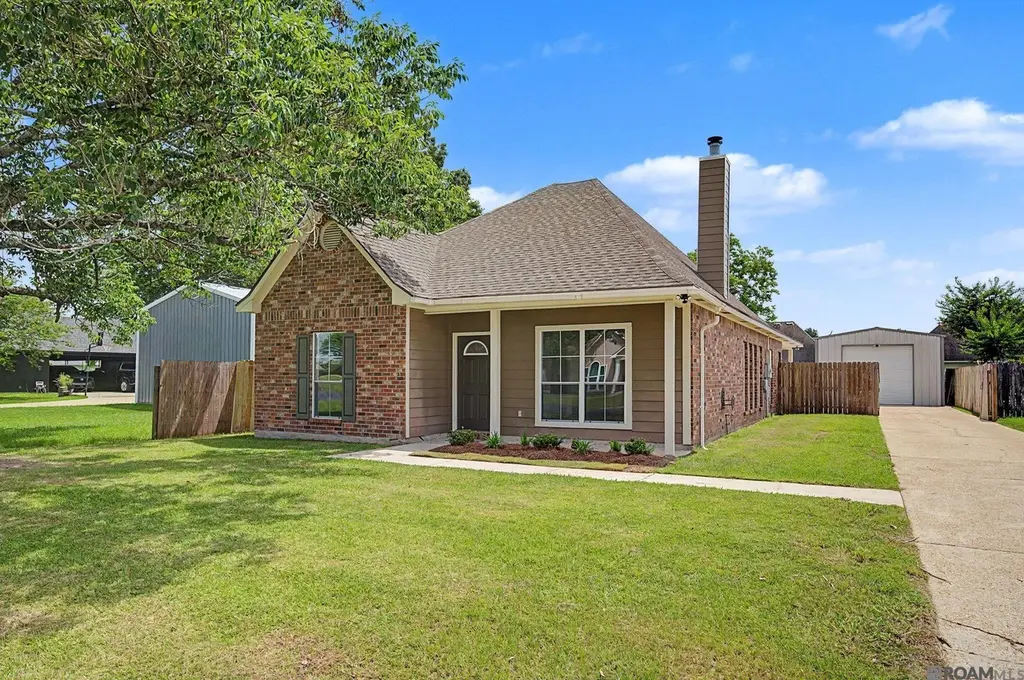
14494 Whispering Oaks Dr · Prairieville, LA
Flood risk 1/10 · Minimal
- FEMA flood zone
- X
- Chance of flooding over 30 yrs
- 0.0%
- Est. flood insurance / yr
- $507 – $1,088
Fire risk 1/10 · Minimal
- Est. fire insurance / yr
- $1,269 – $2,357
Heat risk 8/10 · Major
- Hot days now (above 108°F)
- 7 days/yr
- Hot days in 30 yrs
- 21 days/yr
Wind risk 9/10 · Severe
- Chance of severe wind over 30 yrs
- 99.0%
Air-quality risk 2/10 · Minimal
- Unhealthy air days now
- 2 days/yr
- Unhealthy air days in 30 yrs
- 2 days/yr
Risk factors via First Street. Map © Google.
Why this score? — see what drove the D grade
The composite is a weighted blend of 9 inputs, each scored 0–100. Each bar is that input's sub-score; the figure is the points it added to the 100-point composite (weight × sub-score).
- Cash flow +13.0/30.0
- ARV discount +6.4/15.0
- Schools +4.7/10.0
- DSCR +3.9/10.0
- Livability +3.5/5.0
- Rent growth +3.3/5.0
- 1% rule +2.8/10.0
- Condition / age +2.5/5.0
- Appreciation +0.0/10.0
$276,900
🖨 Deal sheet (PDF) 📄 Offer letter ✓ Due diligence
Listing remarks MLS
Investor's Special with great potential! This 3-bedroom, 2-bath home in Whispering Oaks offers an excellent opportunity to renovate and create something truly special. Ceramic tile flooring is already in place in the laundry closet and two bathrooms, but the remainder of the home will need new flooring throughout along with baseboards, trim, paint, window sills, and some interior and all closet doors. The kitchen is currently missing the dishwasher, but the owner has one. Outside, you'll find a patio area off the carport, additional concrete for extra parking, and a spacious 24x24 workshop. Located in Flood Zone X with no HOA and convenient access to both Gonzales and Prairieville, this property is full of potential for investors or buyers looking to add their personal touch.
Key facts
- Stylish countertops
- Brand new roof
- Spacious workshop
Tags
Property features AI
Finance
- Other: Located in Whispering Oaks subdivision
Exterior
- Parking: 2 parking spaces
- Security: Smoke detector(s)
- Utilities: Public water; Public sewer; Cable connected
- Home design: Detached single-family residence; Updated/remodeled; Level topography
- Construction: Vinyl siding, frame and brick construction; Shingle roof; Slab foundation; Built area approximately 2000
- Exterior features: Covered patio; Fenced yard (full, wood); Workshop
Interior
- Kitchen: Range; Oven; Electric cooktop; Dishwasher; Range hood
- Flooring: Laminate
- Bathrooms: 2 full bathrooms
- Heating & cooling: Central heating; Central air; Ceiling fans
- Interior features: Fireplace (1); Lighting
- Laundry & utility: Washer hookup (inside); Electric dryer hookup
Neighborhood map
What this means for you Summary
Snapshot
- This is a 3-bed/2.0-bath single-family listed at $277k.
Deal economics
- At list price, monthly cash flow is $-16 ($-192/yr) — negative.
- To cash-flow at today's rent, offer at most $274k (1.0% below list).
- To meet the 1% rule (rent ≥ 1% of price), the offer needs to be $215k (22.4% below list).
- Recommended offer: $215k (22.4% below list) — sets the bar for 1% rule.
- Cap rate 6.2% vs local median 4.4% in Prairieville — top-decile yield for the area; either an underpriced asset or a hidden risk that comps aren't pricing in. Stress-test before assuming the spread holds.
Location & tenants
- Location reads 69/100 on livability (#70 in LA) — a middle-class / working-renter tenant base. Strengths: employment A+, housing A+, crime B+; Watch: amenities F, commute F, health & safety F.
- Ascension Parish (suburban): math 48% / reading 58% proficiency, ranked #7 of 98 in LA (top 7%) — acceptable for families but not a draw, mixed tenant base, ~2y average lease.
- Zoned schools: Central Primary School (math 48% / reading 52%, grade D+, #125 of 646 statewide, top 20%, 474 students, 55% FRL); Central Middle School (math 40% / reading 54%, grade D+, #37 of 218 statewide, top 18%, 747 students, 50% FRL); East Ascension High School (math 47% / reading 49%, grade D, #43 of 265 statewide, top 16%, 2,098 students, 55% FRL).
- Market conditions: Rents rising (+3.3%/yr); 571 active listings in the ZIP; 2 comparable units currently listed for rent nearby; solid renter incomes; 579 units permitted in Ascension Parish in 2024 (0 in 5+ unit buildings).
- This rent runs 31% of the median local income ($83k/yr) — at the standard rent-burdened threshold; future hikes will face affordability resistance.
Forward outlook
- Local home prices are declining (-3.0%/yr); year-one equity from $2k of loan paydown is wiped out by about $8k of value loss. Plan a longer hold.
- Ascension County population projected at +43% by 2050 — long-run rental-demand tailwind backs the buy-and-hold thesis.
Negotiation context
- Only 7 days on market — expect competitive offers; lowballing is unlikely to land.
- 7 sale attempts since 24y ago with the ask held roughly flat each time — persistent listings suggest the price (not the market) is what's stuck; bring a comps-based counter.
- Current owner paid $190k; 46% above their basis — modest negotiation headroom, anchor on the comps not their cost.
Risks & watch-outs
- Climate carrying-cost: severe wind risk, 99% chance of damaging wind over 30y; extreme-heat days projected 7→21/yr by 2055 (HVAC capex compounding) — expect insurance premiums to compound above CPI over the hold.
Questions for the listing agent
- What do current leases actually rent for vs. the listed asking? Can we see a recent rent roll and the last 12 months of T-12 income?
- Is there a deadline driving the sale (1031 exchange, divorce, estate, relocation)? That informs how much negotiation room exists.
- Schools are A-rated — typically a magnet for longer-tenancy family renters. What's the average tenant stay here, and is there a school-zone premium baked into asking?
- The area grade is low — what's the realistic commute time and amenity access for the typical tenant pool here? Any planned neighborhood developments (good or bad) we should know about?
- What's the average days-on-market for RENTAL listings here right now (not sales)? A rising rental-DOM trend means longer vacancies and softer asking-rent achievability than the comps imply.
- What's the recent tenant-quality profile in this submarket — average credit score on applications, eviction rate, late-payment / NSF rate, and stable-employment percentage? A property-management company in the area should have these aggregated.
- How much new for-sale + rental construction is in the pipeline within 1–3 miles? Heavy new supply typically softens prices + rents 12–24 months out; constrained supply supports both.
Investment metrics
- 1% rule
- 0.78% ✗
- Cap rate
- 6.22%
- Cash-on-cash
- -0.25%
- DSCR
- 0.99
- GRM
- 10.7
CMA / ARV
- ARV (on-the-fly)
- $270,456
- Comps found
- 12
Show comp detail 12 sales within ~0.75 mi
| Address | Dist | Beds/Ba | Sqft | Sold | Price | $/sf | Match |
|---|---|---|---|---|---|---|---|
| 14494 Whispering Oaks Dr | 0.00mi | 3/2.0 | 1,528 (0%) | 3mo | $185,000 | $121 | 98 |
| 14439 Stonegate Manor Dr | 0.10mi | 3/2.0 | 1,718 (+12%) | 9mo | $310,000 | $180 | 67 |
| 14310 Whispering Oaks Dr | 0.35mi | 3/2.0 | 1,365 (-11%) | 5mo | $242,500 | $178 | 62 |
| 14364 Stonegate Manor Dr | 0.25mi | 3/2.0 | 1,718 (+12%) | 8mo | $290,000 | $169 | 61 |
| 14452 Tanya Dr | 0.73mi | 3/2.0 | 1,565 (+2%) | 3mo | $265,000 | $169 | 60 |
| 14292 Whispering Oaks Dr | 0.38mi | 3/2.0 | 1,340 (-12%) | 9mo | $240,000 | $179 | 54 |
| 40506 Fox Run Dr | 0.72mi | 3/2.0 | 1,453 (-5%) | 9mo | $250,000 | $172 | 51 |
| 42055 Shadow Creek Ave | 0.59mi | 3/2.0 | 1,704 (+12%) | 8mo | $285,000 | $167 | 47 |
| 40523 Cross Ridge Ave | 0.73mi | 3/2.0 | 1,403 (-8%) | 8mo | $249,900 | $178 | 46 |
| 14533 Tanya Dr | 0.74mi | 3/2.0 | 1,428 (-6%) | 11mo | $260,000 | $182 | 45 |
| 40505 Cross Creek Ave | 0.74mi | 3/2.0 | 1,410 (-8%) | 11mo | $249,900 | $177 | 44 |
| 14180 Martin Moran Rd | 0.63mi | 3/2.0 | 1,315 (-14%) | 10mo | $226,000 | $172 | 39 |
Match score weights: distance 35% · size 25% · config 20% · recency 20%. Top-matched comps best support the ARV.
Projected returns pro-forma
-3.0% appreciation · 3.26% rent growth · sell at horizon
- IRR
- -16.5%
- Equity multiple
- 0.41×
- Total profit
- $-45,415
- Equity at exit
- $41,287
- IRR
- -7.9%
- Equity multiple
- 0.50×
- Total profit
- $-38,902
- Equity at exit
- $23,941
Cash invested: $77,532 (down + closing). Projections, not guarantees.
Landlord ↔ Tenant lean methodology
- Overall (STATE)
- 90 Strongly Landlord-Friendly
- State Louisiana
- 90 Strongly Landlord-Friendly · R+12
- County
- — inherits STATE
- City
- — inherits STATE
ZIP-level market 70737
- Rents YoY
- 3.3%
- Active inventory
- 571
- Price-to-rent
- 10.7×
Monthly cashflow live
- Estimated rent
- $2,148 medium interval (Pro) →
- Mortgage (P&I)
- −$1,452
- Tax from tax record
- −$145 /mo · $1,745/yr
- Insurance
- −$115
- HOA
- −$0
- Vacancy / Maint / Mgmt
- −$451
- Net cashflow
- $-16
Break-even live
Sensitivity live
| Price | -10% $141 | -5% $62 | +0% $-16 | +5% $-94 | +10% $-173 |
|---|---|---|---|---|---|
| Rent | -10% $-186 | -5% $-101 | +0% $-16 | +5% $69 | +10% $154 |
| Rate | -1.0pp $123 | -0.5pp $54 | base $-16 | +0.5pp $-88 | +1.0pp $-161 |
UW: 25.0% down · 7.5% · 30yr · 1.5% tax · 5.0% vac · 8.0% maint · 8.0% mgmt
Financing live
Cash to close
- Down payment
- $69,225
- Closing costs
- $8,307
- Reserves months
- —
- Total cash needed
- —
Loan-product check · same deal, 3 products live
Conventional
25% down · 7.5% · 30yr
- Down + closing
- —
- Monthly P&I
- —
- Monthly cashflow
- —
- DSCR
- —
- Eligible?
- —
Personal DTI + credit; lowest rate.
DSCR
20% down · 8.5% · 30yr
- Down + closing
- —
- Monthly P&I
- —
- Monthly cashflow
- —
- DSCR
- —
- Eligible?
- —
No personal income docs; deal must DSCR.
Hard money
10% down · 12.0% · 12mo
- Down + closing
- —
- Monthly P&I
- —
- Monthly cashflow
- —
- DSCR
- —
- Eligible?
- —
Short-term bridge; refi at stabilization.
Rent comps 2 comps
| Address | Beds | Baths | Sqft | Rent | $/sqft | DOM | Units | Dist |
|---|---|---|---|---|---|---|---|---|
| 41437 Cozy Way Gonzales, LA | 3.0 | 2.0 | 1825 | $2,300 | $1.26 | 25d | 1 | 0.95mi |
| 40300 Creek Bend Dr Gonzales, LA | 3.0 | 2.0 | 1381 | $2,000 | $1.45 | 16d | 1 | 1.14mi |
Listing history 7 events
-
2026-06-14status $276,900 Pending 7 DOM
-
2026-06-10days on market $276,900 Active 7 DOM
-
2026-06-09days on market $276,900 Active 6 DOM
-
2026-06-08days on market $276,900 Active 5 DOM
-
2026-06-07days on market $276,900 Active 4 DOM
-
2026-06-03remarks 687-char remark
-
2026-06-03$276,900 Active 1 DOM
ⓘ Source: listings_history table (triggers on properties + properties_extension) + one-shot
backfill from property_details.listing_events for pre-trigger history.
Tax reassessment forecast LA · Resets to sale price
- Current annual tax
- $1,745 · $145/mo
- Projected year-2 tax
- $1,745 · $145/mo
- Expected delta
- $0/yr ($0/mo · 0.0%)
ⓘ Screening estimate from a state-policy table — verify with the county assessor before closing.
Climate risk First Street
- Flood 1/10 Low FEMA zone X · 0% chance over 30 yrs
- Wildfire 1/10 Low
- Heat 8/10 Severe 7 d/yr ≥108°F today · 21 d/yr by 30 yrs out
- Wind 9/10 Extreme 99% chance of damaging wind over 30 yrs
- Air quality 2/10 Low 2 unhealthy d/yr today · 2 by 30 yrs out
Nearby sold comps map
Loading sold comps map…
Walkable amenities ~0.75 mi
Loading nearby amenities…
Taxation est. · year 1
- Rental income
- $25,775
- − Mortgage interest
- −$15,511
- − Property taxes
- −$1,745
- − Insurance
- −$1,384
- − Repairs & maintenance
- −$2,062
- − Management
- −$2,062
- − Depreciation
- −$8,055
- Taxable loss
- −$5,044
- Est. tax savings @ 24.0%
- +$1,211
- After-tax cash flow
- $1,019/yr
For passive investors: Depreciation is non-cash, so a rental often shows a tax loss while cash-flowing — sheltering income. Rental losses are passive: they offset passive income freely, and up to $25,000/yr can offset ordinary (W-2) income if you actively participate and your MAGI is under $100k (phasing out to $0 by $150k); unused losses carry forward. On sale, claimed depreciation is recaptured at up to 25%, and gains may owe capital-gains tax (a 1031 exchange can defer both). Figures are a year-1 estimate at your 24.0% rate — not tax advice; consult a CPA.
Schools (NCES district)
- District
- Ascension Parish
- NCES district ID
- 2200090
- Math proficiency
- 48% ▼ -31.00%
- Reading proficiency
- 58% ▼ -25.00%
- Median HH income
- $68,423
- Composite
- 47.0/100
- National rank
- #2347
- State rank
- #7 of 98 in LA
Livability — Prairieville
- Score
- 69/100
- State rank
- #70
- US rank
- #8507
Category grades
Schools grade is shown separately in the Schools card above.
Census & demographics
- County
- Ascension Parish · 98,362 people
- City population
- 49,278
- Metro
- Baton Rouge, LA
- Population (ZIP)
- 49,084
- Household income
- $82,521
- Rent vs Own
- Severe rent burden
- 863.0
Population outlook (Ascension County) Hauer SSP2
- Today (2025)
- 145,480 people
- By 2030
- 158,329 · +8.8%
- By 2040
- 183,741 · +26.3%
- By 2050
- 207,615 · +42.7%
- By 2075
- 260,244 · +78.9%
- By 2100
- 289,576 · +99.0%
Race, ethnicity, and origin ACS 2023
- Neighborhood character
- Diverse neighborhood (Simpson 0.57)
- Race & ethnicity
- White 59% Black 26% Hispanic / Latino 10% Two or more races 7%
- Hispanic origin (detail)
- Mexican 6%
- Common ancestry
- Lithuanian 15% Serbian 1% Slovak 1%
- Foreign-born
- 7% · Canada
- Languages at home
- 89% English-only · Spanish 9% French/Haitian/Cajun 1% Other Indo-European 1%
Political lean MEDSL · Ascension
- 2024 margin
- Solid R (+34.0) · D 32.2% · R 66.1% · Other 1.7%
- 2008→2024 swing
- +1.7pp toward D · 2008: -35.7pp · 2024: -34.0pp
- All cycles
- 2024: R+34.0 2020: R+32.5 2016: R+36.0 2012: R+34.3 2008: R+35.7
Not yet ingested
- Civics
- —
Market trends
- HPI YoY
- ▼ -89.49%
- Current HPI
- 145.3384
- Rent YoY
- ▲ 3.26%
- Metro
- Baton Rouge, LA
- State GDP YoY
- ▲ 3.29%
- F500 in state
- 10
Industry mix (Fortune 500 HQ in LA)
| Industry | F500 HQs | Revenue |
|---|---|---|
| Telecommunications | 2 | $23B |
|
||
| Utilities | 1 | $12B |
|
||
| Wholesale / Distribution | 1 | $5B |
|
||
| Advertising | 1 | $2B |
|
||
Price history
+174.2% since first listed17 events — show timeline
- 2026-05-28 Listed $276,900 GBRMLS
- 2026-03-27 Sold (Public Records) $190,000 Public Records
- 2026-03-26 Sold (MLS) — GBRMLS
- 2026-03-26 Sold (MLS) — AcadianaMLS
- 2026-03-17 Pending — AcadianaMLS
- 2026-03-17 Pending — GBRMLS
- 2026-03-16 Listed $185,000 GBRMLS
- 2026-03-16 Listed $185,000 AcadianaMLS
- 2009-10-06 Sold (Public Records) — Public Records
- 2009-08-10 Sold (MLS) — GBRMLS
- 2009-03-10 Listed $168,000 GBRMLS
- 2009-03-10 Listed $168,000 AcadianaMLS
- 2003-04-16 Sold (Public Records) $102,000 Public Records
- 2003-04-16 Sold (Public Records) $107,068 Public Records
- 2002-11-12 Sold (MLS) — GBRMLS
- 2002-09-26 Listed $101,000 GBRMLS
- 2002-09-26 Listed $101,000 AcadianaMLS
Property tax history
+0.7%/yrLatest (2025): $1,745 · -1.8% YoY. Source: county tax records.
Cash-flow waterfall
monthlySold comps — $/sqft
last 12 mo · ≤1 miLoading sold comps…