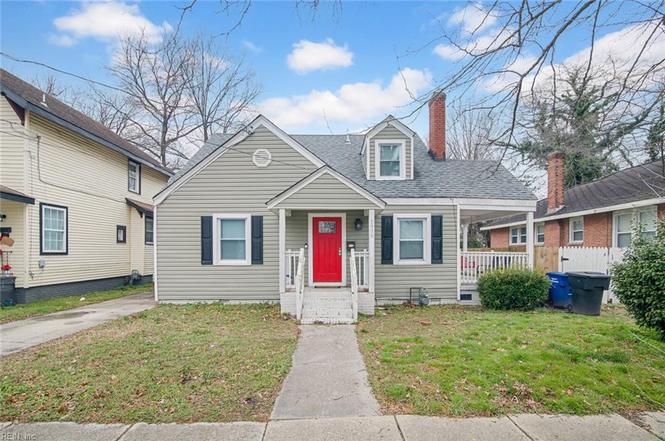
1914 Parker Ave · Portsmouth, VA
Flood risk 4/10 · Minor
- FEMA flood zone
- X (shaded)
- Chance of flooding over 30 yrs
- 0.13%
- Est. flood insurance / yr
- $507 – $1,088
Fire risk 1/10 · Minimal
- Est. fire insurance / yr
- $666 – $1,236
Heat risk 9/10 · Severe
- Hot days now (above 106°F)
- 7 days/yr
- Hot days in 30 yrs
- 16 days/yr
Wind risk 8/10 · Major
- Chance of severe wind over 30 yrs
- 80.0%
Air-quality risk 5/10 · Moderate
- Unhealthy air days now
- 6 days/yr
- Unhealthy air days in 30 yrs
- 7 days/yr
Risk factors via First Street. Map © Google.
Why this score? — see what drove the D+ grade
The composite is a weighted blend of 9 inputs, each scored 0–100. Each bar is that input's sub-score; the figure is the points it added to the 100-point composite (weight × sub-score).
- ARV discount +15.0/15.0
- Cash flow +13.7/30.0
- DSCR +4.1/10.0
- Schools +3.9/10.0
- Livability +3.7/5.0
- 1% rule +3.5/10.0
- Rent growth +3.3/5.0
- Condition / age +2.5/5.0
- Appreciation +0.0/10.0
$320,000
🖨 Deal sheet (PDF) 📄 Offer letter ✓ Due diligence
Listing remarks
This beautifully maintained 5-bedroom, 3-bath home offers the perfect blend of space, comfort, and convenience. Step inside to discover an updated kitchen designed to impress, featuring granite countertops, a gas cooktop, modern cabinetry, and ample prep s for everyday living and entertaining. The open layout flows seamlessly into the main living areas, creating a warm and inviting atmosphere filled with natural light. Generously sized bedrooms provide flexibility for guests, a home office, or multi-generational living, while the three full bathrooms offer both style and functionality. Located just minutes from major interstates, commuting is effortless, with quick access to the shipyard, s
Key facts
- Gas cooktop
- Modern cabinetry
- Natural light
Tags
Neighborhood map
What this means for you Summary
Snapshot
- This is a 5-bed/3.0-bath single-family listed at $320k.
Deal economics
- At list price, monthly cash flow is $22 ($265/yr) — positive.
- The deal already cash-flows at list — no discount required.
- To meet the 1% rule (rent ≥ 1% of price), the offer needs to be $273k (14.6% below list).
- Recommended offer: $273k (14.6% below list) — sets the bar for 1% rule.
- Cap rate 6.4% vs local median 4.6% in Portsmouth — top-decile yield for the area; either an underpriced asset or a hidden risk that comps aren't pricing in. Stress-test before assuming the spread holds.
Location & tenants
- Location reads 73/100 on livability (#172 in VA) — a middle-class / working-renter tenant base. Strengths: amenities A+, cost of living A+, housing A+; Watch: employment C-, crime F, commute F.
- Portsmouth City Public School District (urban): math 34% / reading 58% proficiency, ranked #107 of 131 in VA (top 82%) — families likely to look elsewhere, expect single-tenant / working-renter base with shorter leases.
- Zoned schools: Brighton Elementary (math 12% / reading 32%, grade F, #1,069 of 1,108 statewide, top 97%, 411 students, 97% FRL); I.C. Norcom High (math 39% / reading 58%, grade D, #301 of 319 statewide, top 95%, 1,043 students, 100% FRL) — zoned schools average 98% FRL vs 60% district-wide (38 pts higher); higher-poverty schools than district average — tighter screening recommended.
- Market conditions: Rents rising (+3.3%/yr); 131 active listings in the ZIP; 2 comparable units currently listed for rent nearby; 300 units permitted in Portsmouth city in 2024 (112 in 5+ unit buildings).
- At $2,733/mo this rent would consume 66% of the median local household income ($50k/yr) (locally 1727% of renters already pay >50% of income on rent) — very limited rent-growth headroom before tenants either downsize or default.
Forward outlook
- Local home prices are declining (-3.0%/yr); year-one equity from $2k of loan paydown is wiped out by about $10k of value loss. Plan a longer hold.
Negotiation context
- Only 9 days on market — expect competitive offers; lowballing is unlikely to land.
- 8 sale attempts since 7y ago with the ask held roughly flat each time — persistent listings suggest the price (not the market) is what's stuck; bring a comps-based counter.
Risks & watch-outs
- Watch-outs: built in 1938 — expect roof / HVAC / electrical / plumbing capex.
- Climate carrying-cost: severe wind risk, 80% chance of damaging wind over 30y; extreme-heat days projected 7→16/yr by 2055 (HVAC capex compounding) — expect insurance premiums to compound above CPI over the hold.
Questions for the listing agent
- Built in 1938 — when were the roof, HVAC, electrical panel, plumbing, and water heater last replaced?
- Is there a deadline driving the sale (1031 exchange, divorce, estate, relocation)? That informs how much negotiation room exists.
- Schools are B-rated — typically a magnet for longer-tenancy family renters. What's the average tenant stay here, and is there a school-zone premium baked into asking?
- Crime grade is F in this area — have there been break-ins, vandalism, or insurance claims at this property in the last 3 years? What carrier currently insures it and at what premium?
- The area grade is low — what's the realistic commute time and amenity access for the typical tenant pool here? Any planned neighborhood developments (good or bad) we should know about?
- What's the average days-on-market for RENTAL listings here right now (not sales)? A rising rental-DOM trend means longer vacancies and softer asking-rent achievability than the comps imply.
- What's the recent tenant-quality profile in this submarket — average credit score on applications, eviction rate, late-payment / NSF rate, and stable-employment percentage? A property-management company in the area should have these aggregated.
- How much new for-sale + rental construction is in the pipeline within 1–3 miles? Heavy new supply typically softens prices + rents 12–24 months out; constrained supply supports both.
Investment metrics
- 1% rule
- 0.85% ✗
- Cap rate
- 6.38%
- Cash-on-cash
- 0.30%
- DSCR
- 1.01
- GRM
- 9.8
CMA / ARV
- ARV (on-the-fly)
- $417,956
- Comps found
- 5
Show comp detail 5 sales within ~0.75 mi
| Address | Dist | Beds/Ba | Sqft | Sold | Price | $/sf | Match |
|---|---|---|---|---|---|---|---|
| 1710 Atlanta Ave | 0.13mi | 4/2.5 (-1) | 2,400 (-12%) | 3mo | $381,749 | $159 | 65 |
| 1020 Fayette St | 0.31mi | 5/3.5 | 2,332 (-14%) | 11mo | $370,000 | $159 | 50 |
| 2611 Nashville Ave | 0.53mi | 5/3.0 | 2,314 (-15%) | 13mo | $305,000 | $132 | 40 |
| 1300 Wirt Ave | 0.68mi | 4/2.5 (-1) | 2,430 (-10%) | 10mo | $375,000 | $154 | 36 |
| 1516 County St | 0.68mi | 4/2.0 (-1) | 2,364 (-13%) | 10mo | $201,400 | $85 | 29 |
Match score weights: distance 35% · size 25% · config 20% · recency 20%. Top-matched comps best support the ARV.
Projected returns pro-forma
-3.0% appreciation · 3.31% rent growth · sell at horizon
- IRR
- -15.5%
- Equity multiple
- 0.45×
- Total profit
- $-49,594
- Equity at exit
- $47,713
- IRR
- -6.5%
- Equity multiple
- 0.58×
- Total profit
- $-37,857
- Equity at exit
- $27,668
Cash invested: $89,600 (down + closing). Projections, not guarantees.
Landlord ↔ Tenant lean methodology
- Overall (STATE)
- 55 Moderately Landlord-Leaning
- State Virginia
- 55 Moderately Landlord-Leaning · D+2
- County
- — inherits STATE
- City
- — inherits STATE
ZIP-level market 23704
- Home prices YoY
- -4.6%
- Rents YoY
- 3.3%
- Active inventory
- 131
- Price-to-rent
- 9.8×
Monthly cashflow live
- Estimated rent
- $2,733 medium interval (Pro) →
- Mortgage (P&I)
- −$1,678
- Tax from tax record
- −$326 /mo · $3,910/yr
- Insurance
- −$133
- HOA
- −$0
- Vacancy / Maint / Mgmt
- −$574
- Net cashflow
- $22
Break-even live
Sensitivity live
| Price | -10% $203 | -5% $113 | +0% $22 | +5% $-68 | +10% $-159 |
|---|---|---|---|---|---|
| Rent | -10% $-194 | -5% $-86 | +0% $22 | +5% $130 | +10% $238 |
| Rate | -1.0pp $183 | -0.5pp $104 | base $22 | +0.5pp $-61 | +1.0pp $-145 |
UW: 25.0% down · 7.5% · 30yr · 1.5% tax · 5.0% vac · 8.0% maint · 8.0% mgmt
Financing live
Cash to close
- Down payment
- $80,000
- Closing costs
- $9,600
- Reserves months
- —
- Total cash needed
- —
Loan-product check · same deal, 3 products live
Conventional
25% down · 7.5% · 30yr
- Down + closing
- —
- Monthly P&I
- —
- Monthly cashflow
- —
- DSCR
- —
- Eligible?
- —
Personal DTI + credit; lowest rate.
DSCR
20% down · 8.5% · 30yr
- Down + closing
- —
- Monthly P&I
- —
- Monthly cashflow
- —
- DSCR
- —
- Eligible?
- —
No personal income docs; deal must DSCR.
Hard money
10% down · 12.0% · 12mo
- Down + closing
- —
- Monthly P&I
- —
- Monthly cashflow
- —
- DSCR
- —
- Eligible?
- —
Short-term bridge; refi at stabilization.
Rent comps 2 comps
| Address | Beds | Baths | Sqft | Rent | $/sqft | DOM | Units | Dist |
|---|---|---|---|---|---|---|---|---|
| 919 Jefferson St Portsmouth, VA | 4.0 | 2.5 | 2026 | $2,500 | $1.23 | 24d | 1 | 0.41mi |
| 511 Hampton Pl Unit B Portsmouth, VA | 4.0 | 2.0 | 3000 | $3,450 | $1.15 | 44d | 1 | 1.23mi |
Listing history 24 events
-
2026-04-08soldstatus $325,000
-
2026-03-11status Under Contract
-
2026-03-05historical Active Under Contract
-
2026-02-27$320,000 Active
-
2023-09-28soldstatus $285,000
-
2023-09-10status Under Contract
-
2023-09-05historical Active Under Contract
-
2023-08-31price $274,999
-
2023-08-31status Active
-
2023-08-13historical Active Under Contract
-
2023-08-10$275,000 Active
-
2020-10-27status Under Contract
-
2020-10-26soldstatus $236,000
-
2020-09-22historical Active Under Contract
-
2020-09-14price $224,000
-
2020-09-14status Active
-
2020-09-09historical Active Under Contract
-
2020-09-02$219,000 Active
-
2020-07-29historical
-
2020-06-26$219,900 Active
-
2020-04-13historical
-
2020-02-25$229,000 Active
-
2019-05-29historical
-
2019-04-07$239,900 Active
ⓘ Source: listings_history table (triggers on properties + properties_extension) + one-shot
backfill from property_details.listing_events for pre-trigger history.
Tax reassessment forecast VA · Resets to sale price
- Current annual tax
- $3,910 · $326/mo
- Projected year-2 tax
- $3,910 · $326/mo
- Expected delta
- $0/yr ($0/mo · 0.0%)
ⓘ Screening estimate from a state-policy table — verify with the county assessor before closing.
Climate risk First Street
- Flood 4/10 Moderate FEMA zone X (shaded) · 13% chance over 30 yrs
- Wildfire 1/10 Low
- Heat 9/10 Extreme 7 d/yr ≥106°F today · 16 d/yr by 30 yrs out
- Wind 8/10 Severe 80% chance of damaging wind over 30 yrs
- Air quality 5/10 Major 6 unhealthy d/yr today · 7 by 30 yrs out
Nearby sold comps map
Loading sold comps map…
Walkable amenities ~0.75 mi
Loading nearby amenities…
Taxation est. · year 1
- Rental income
- $32,801
- − Mortgage interest
- −$17,925
- − Property taxes
- −$3,910
- − Insurance
- −$1,600
- − Repairs & maintenance
- −$2,624
- − Management
- −$2,624
- − Depreciation
- −$9,309
- Taxable loss
- −$5,191
- Est. tax savings @ 24.0%
- +$1,246
- After-tax cash flow
- $1,511/yr
For passive investors: Depreciation is non-cash, so a rental often shows a tax loss while cash-flowing — sheltering income. Rental losses are passive: they offset passive income freely, and up to $25,000/yr can offset ordinary (W-2) income if you actively participate and your MAGI is under $100k (phasing out to $0 by $150k); unused losses carry forward. On sale, claimed depreciation is recaptured at up to 25%, and gains may owe capital-gains tax (a 1031 exchange can defer both). Figures are a year-1 estimate at your 24.0% rate — not tax advice; consult a CPA.
Schools (NCES district)
- District
- Portsmouth City Public School District
- NCES district ID
- 5103000
- Math proficiency
- 34% ▼ -40.00%
- Reading proficiency
- 58% ▼ -12.00%
- Median HH income
- $46,152
- Composite
- 39.01/100
- National rank
- #4071
- State rank
- #107 of 131 in VA
Livability — Portsmouth
- Score
- 73/100
- State rank
- #172
- US rank
- #5381
Category grades
Schools grade is shown separately in the Schools card above.
Census & demographics
- Census place
- Portsmouth, VA
- County
- Portsmouth City · 96,366 people
- City population
- 96,366
- Metro
- Virginia Beach-Norfolk-Newport News, VA-NC
- Population (ZIP)
- 19,207
- Household income
- $49,583
- Rent vs Own
- Severe rent burden
- 1727.0
Population outlook (Portsmouth County) Hauer SSP2
- Today (2025)
- 96,730 people
- By 2030
- 96,760 · +0.0%
- By 2040
- 96,573 · -0.2%
- By 2050
- 95,606 · -1.2%
- By 2075
- 93,579 · -3.3%
- By 2100
- 83,756 · -13.4%
Race, ethnicity, and origin ACS 2023
- Neighborhood character
- Predominantly Black (66%)
- Race & ethnicity
- Black 66% White 24% Two or more races 6% Hispanic / Latino 4% Asian 2%
- Common ancestry
- Slovak 1% Romanian 1% Lithuanian 1%
- Foreign-born
- 2% · Canada
- Languages at home
- 96% English-only · Spanish 2%
Political lean MEDSL · Portsmouth
- 2024 margin
- Solid D (+38.6) · D 68.6% · R 30.0% · Other 1.4%
- 2008→2024 swing
- -0.7pp no change · 2008: 39.3pp · 2024: 38.6pp
- All cycles
- 2024: D+38.6 2020: D+40.8 2016: D+36.5 2012: D+39.6 2008: D+39.3
Not yet ingested
- Civics
- —
Market trends
- HPI YoY
- ▼ -15.69%
- Current HPI
- 322.7335
- Rent YoY
- ▲ 3.31%
- Metro
- Virginia Beach-Norfolk-Newport News, VA-NC
- State GDP YoY
- ▲ 2.40%
- F500 in state
- 50
Industry mix (Fortune 500 HQ in VA)
| Industry | F500 HQs | Revenue |
|---|---|---|
| Aerospace / Defense | 4 | $236B |
|
||
| Technology / Defense | 3 | $32B |
|
||
| Financial Services | 2 | $176B |
|
||
| Utilities | 2 | $27B |
|
||
| Insurance | 2 | $25B |
|
||
| Technology | 2 | $15B |
|
||
Price history
+35.5% since first listed24 events — show timeline
- 2026-04-08 Sold (Public Records) $325,000 Public Records
- 2026-03-11 Pending — REINMLS
- 2026-03-05 Contingent — REINMLS
- 2026-02-27 Listed $320,000 REINMLS
- 2023-09-28 Sold (Public Records) $285,000 Public Records
- 2023-09-10 Pending — REINMLS
- 2023-09-05 Contingent — REINMLS
- 2023-08-31 Price Changed $274,999 REINMLS
- 2023-08-31 Relisted — REINMLS
- 2023-08-13 Contingent — REINMLS
- 2023-08-10 Listed $275,000 REINMLS
- 2020-10-27 Pending — REINMLS
- 2020-10-26 Sold (Public Records) $236,000 Public Records
- 2020-09-22 Contingent — REINMLS
- 2020-09-14 Price Changed $224,000 REINMLS
- 2020-09-14 Relisted — REINMLS
- 2020-09-09 Contingent — REINMLS
- 2020-09-02 Listed $219,000 REINMLS
- 2020-07-29 Listing Removed — REINMLS
- 2020-06-26 Listed $219,900 REINMLS
- 2020-04-13 Listing Removed — REINMLS
- 2020-02-25 Listed $229,000 REINMLS
- 2019-05-29 Listing Removed — REINMLS
- 2019-04-07 Listed $239,900 REINMLS
Property tax history
+6.5%/yrLatest (2025): $3,910 · +2.6% YoY. Source: county tax records.
Cash-flow waterfall
monthlySold comps — $/sqft
last 12 mo · ≤1 miLoading sold comps…