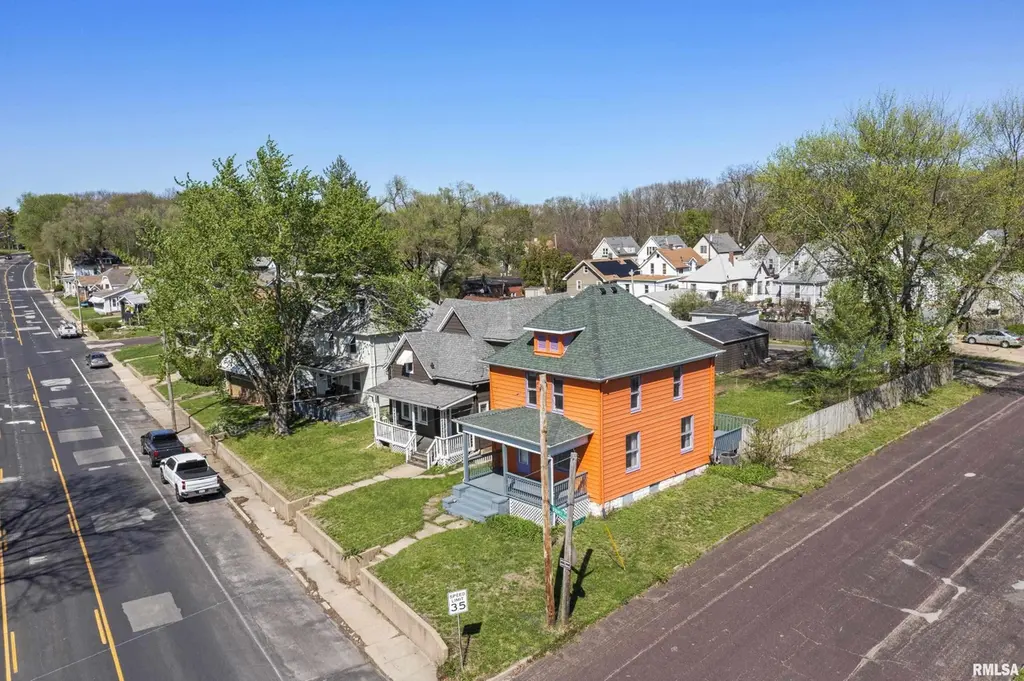
2624 N Prospect Rd · Peoria, IL
Flood risk 1/10 · Minimal
- FEMA flood zone
- X
- Chance of flooding over 30 yrs
- 0.0%
- Est. flood insurance / yr
- $473 – $860
Fire risk 1/10 · Minimal
- Est. fire insurance / yr
- $804 – $1,492
Heat risk 3/10 · Minor
- Hot days now (above 105°F)
- 7 days/yr
- Hot days in 30 yrs
- 18 days/yr
Wind risk 2/10 · Minimal
- Chance of severe wind over 30 yrs
- 1.0%
Air-quality risk 3/10 · Minor
- Unhealthy air days now
- 1 days/yr
- Unhealthy air days in 30 yrs
- 3 days/yr
Risk factors via First Street. Map © Google.
Why this score? — see what drove the B+ grade
The composite is a weighted blend of 9 inputs, each scored 0–100. Each bar is that input's sub-score; the figure is the points it added to the 100-point composite (weight × sub-score).
- Cash flow +30.0/30.0
- ARV discount +15.0/15.0
- 1% rule +10.0/10.0
- DSCR +10.0/10.0
- Livability +3.7/5.0
- Rent growth +3.4/5.0
- Condition / age +2.5/5.0
- Schools +1.1/10.0
- Appreciation +0.0/10.0
$59,900
🖨 Deal sheet 📄 Offer letter ✓ Due diligence
Listing remarks MLS
BEDROOM HOME. NEW FURNACE 4 YEARS OLD. THE WOOD FLOORS HAVE BEEN REFINISHED RECENTLY. 2 CAR DETACHED GARAGE. PRIVACY FENCED BACKYARD. FRONT PORCH. HUGE UPSTAIRS BATHROOM.
Key facts
- 6,534 sq ft lot
- 2 garage spots
- Built 1920
Neighborhood map
What this means for you Summary
Snapshot
- This is a 2-bed/1.0-bath single-family listed at $60k.
Deal economics
- At list price, monthly cash flow is $280 ($3k/yr) — positive.
- The deal already cash-flows at list — no discount required.
- Meets the 1% rule at list price ($943 rent vs $60k).
- Cap rate 11.9% vs local median 5.6% in Peoria — top-decile yield for the area; either an underpriced asset or a hidden risk that comps aren't pricing in. Stress-test before assuming the spread holds.
Location & tenants
- Location reads 73/100 on livability (#270 in IL) — a middle-class / working-renter tenant base. Strengths: commute A+, cost of living A+, housing A+; Watch: employment D+, crime F.
- Peoria SD 150 (urban): math 11% / reading 14% proficiency, ranked #554 of 620 in IL (top 89%) — low school quality limits family demand, transient renter base, plan for 1-2y turnover; 70% free/reduced lunch — lower-income household profile, screen leases tightly.
- Zoned schools: Peoria High School (math 4% / reading 7%, grade F, #609 of 693 statewide, top 88%, 1,447 students, 0% FRL) — zoned schools average 0% FRL vs 70% district-wide (70 pts lower); this property's tenant base skews higher-income than the district average.
- Market conditions: Rents rising (+3.5%/yr); 104 active listings in the ZIP; 8 comparable units currently listed for rent nearby; rentals leasing fast (median 14d on market — plan ~1-2 weeks tenant-placement turnaround); lower-income renter base — watch delinquency; 73 units permitted in Peoria County in 2024 (0 in 5+ unit buildings).
Forward outlook
- Local home prices are declining (-3.0%/yr); year-one equity from $414 of loan paydown is wiped out by about $2k of value loss. Plan a longer hold.
- Peoria County population projected at -11% by 2050 — secular population decline; favor cash flow + early exit over multi-decade hold.
- At projected returns (-3.0% appreciation + 3.5% rent growth), your $17k cash investment doubles in ~6 years — after that, you're playing with house money.
Negotiation context
- Only 10 days on market — expect competitive offers; lowballing is unlikely to land.
- 4 sale attempts since 22y ago with the ask held roughly flat each time — persistent listings suggest the price (not the market) is what's stuck; bring a comps-based counter.
- Current owner paid $30k; list at $60k implies a 100% gain — meaningful room to come down on a strong offer.
Risks & watch-outs
- Watch-outs: property tax is 2.5% of price; built in 1920 — expect roof / HVAC / electrical / plumbing capex.
Questions for the listing agent
- Built in 1920 — when were the roof, HVAC, electrical panel, plumbing, and water heater last replaced?
- Property tax is high relative to price — has the assessment been appealed recently, and will the sale trigger a re-assessment?
- Is there a deadline driving the sale (1031 exchange, divorce, estate, relocation)? That informs how much negotiation room exists.
- Schools are F-rated, which usually means shorter tenancies and higher turnover. Who's the typical renter profile here, and what's been the actual vacancy rate?
- Crime grade is F in this area — have there been break-ins, vandalism, or insurance claims at this property in the last 3 years? What carrier currently insures it and at what premium?
- What's the average days-on-market for RENTAL listings here right now (not sales)? A rising rental-DOM trend means longer vacancies and softer asking-rent achievability than the comps imply.
- What's the recent tenant-quality profile in this submarket — average credit score on applications, eviction rate, late-payment / NSF rate, and stable-employment percentage? A property-management company in the area should have these aggregated.
- How much new for-sale + rental construction is in the pipeline within 1–3 miles? Heavy new supply typically softens prices + rents 12–24 months out; constrained supply supports both.
Investment metrics
- 1% rule
- 1.57% ✓
- Cap rate
- 11.90%
- Cash-on-cash
- 20.01%
- DSCR
- 1.89
- GRM
- 5.3
CMA / ARV
- ARV (on-the-fly)
- $73,080
- Comps found
- 12
Show comp detail 12 sales within ~0.75 mi
| Address | Dist | Beds/Ba | Sqft | Sold | Price | $/sf | Match |
|---|---|---|---|---|---|---|---|
| 2405 N Atlantic Ave | 0.23mi | 3/1.0 (+1) | 1,388 (+10%) | 5mo | $50,000 | $36 | 63 |
| 829 E Mcclure Ave | 0.35mi | 2/1.0 | 1,412 (+12%) | 0mo | $35,000 | $25 | 63 |
| 2606 N Wisconsin Ave | 0.41mi | 2/1.0 | 1,372 (+9%) | 4mo | $90,000 | $66 | 62 |
| 2206 N Wisconsin Ave | 0.52mi | 3/2.0 (+1) | 1,217 (-3%) | 0mo | $30,000 | $25 | 61 |
| 1016 E Virginia Ave | 0.22mi | 3/2.5 (+1) | 1,427 (+13%) | 1mo | $83,000 | $58 | 56 |
| 805 Abington St | 0.61mi | 2/1.0 | 1,344 (+7%) | 6mo | $52,500 | $39 | 56 |
| 2709 N California Ave | 0.69mi | 3/1.0 (+1) | 1,232 (-2%) | 4mo | $78,400 | $64 | 56 |
| 3011 N Delaware Ave | 0.46mi | 3/2.0 (+1) | 1,355 (+8%) | 4mo | $90,000 | $66 | 54 |
| 1015 E Fairoaks Ave | 0.59mi | 3/2.0 (+1) | 1,200 (-5%) | 3mo | $148,000 | $123 | 53 |
| 2136 N Delaware St | 0.49mi | 3/1.0 (+1) | 1,130 (-10%) | 3mo | $47,500 | $42 | 52 |
| 1118 E London Ave | 0.72mi | 2/2.0 | 1,116 (-11%) | 2mo | $139,900 | $125 | 42 |
| 1619 NE Glendale Ave | 0.74mi | 2/1.0 | 1,098 (-13%) | 5mo | $45,000 | $41 | 40 |
Match score weights: distance 35% · size 25% · config 20% · recency 20%. Top-matched comps best support the ARV.
Projected returns pro-forma
-3.0% appreciation · 3.49% rent growth · sell at horizon
- IRR
- 12.8%
- Equity multiple
- 1.51×
- Total profit
- $8,618
- Equity at exit
- $8,931
- IRR
- 22.1%
- Equity multiple
- 2.94×
- Total profit
- $32,564
- Equity at exit
- $5,179
Cash invested: $16,772 (down + closing). Projections, not guarantees.
Landlord ↔ Tenant lean methodology
- Overall (STATE)
- 43 Moderately Tenant-Leaning
- State Illinois
- 43 Moderately Tenant-Leaning · D+7
- County
- — inherits STATE
- City
- — inherits STATE
ZIP-level market 61603
- Home prices YoY
- -31.8%
- Rents YoY
- 3.5%
- Active inventory
- 104
- Price-to-rent
- 5.3×
Monthly cashflow live
- Estimated rent
- $943 high interval (Pro) →
- Mortgage (P&I)
- −$314
- Tax from tax record
- −$127 /mo · $1,519/yr
- Insurance
- −$25
- HOA
- −$0
- Vacancy / Maint / Mgmt
- −$198
- Net cashflow
- $280
Break-even live
UW: 25.0% down · 7.5% · 30yr · 1.5% tax · 5.0% vac · 8.0% maint · 8.0% mgmt
Financing live
Cash to close
- Down payment
- $14,975
- Closing costs
- $1,797
- Reserves months
- —
- Total cash needed
- —
Loan-product check · same deal, 3 products live
Conventional
25% down · 7.5% · 30yr
- Down + closing
- —
- Monthly P&I
- —
- Monthly cashflow
- —
- DSCR
- —
- Eligible?
- —
Personal DTI + credit; lowest rate.
DSCR
20% down · 8.5% · 30yr
- Down + closing
- —
- Monthly P&I
- —
- Monthly cashflow
- —
- DSCR
- —
- Eligible?
- —
No personal income docs; deal must DSCR.
Hard money
10% down · 12.0% · 12mo
- Down + closing
- —
- Monthly P&I
- —
- Monthly cashflow
- —
- DSCR
- —
- Eligible?
- —
Short-term bridge; refi at stabilization.
Rent comps 8 comps
| Address | Beds | Baths | Sqft | Rent | $/sqft | DOM | Units | Dist |
|---|---|---|---|---|---|---|---|---|
| 2121 N Prospect Rd Peoria, IL | 3.0 | 1.0 | 946 | $802 | $0.85 | 13d | 1 | 0.40mi |
| 505 E Virginia Ave Peoria, IL | 2.0 | 2.0 | 1204 | $758 | $0.63 | 13d | 1 | 0.66mi |
| 526 Fairholm Ave Peoria, IL | 3.0 | 2.0 | 1174 | $925 | $0.79 | 44d | 1 | 0.74mi |
| 2302 NE Monroe St Peoria, IL | 3.0 | 1.0 | 1100 | $875 | $0.80 | 13d | 1 | 0.75mi |
| 308 E Archer Ave Peoria, IL | 3.0 | 1.0 | 1444 | $950 | $0.66 | 13d | 1 | 0.79mi |
| 2210 Knoxville Ave #2212 Peoria, IL | 2.0 | 1.0 | 1284 | $950 | $0.74 | 44d | 1 | 0.96mi |
| 506 Caroline St Unit B Peoria, IL | 2.0 | 1.0 | 1000 | $900 | $0.90 | 13d | 1 | 0.97mi |
| 901 NE Glen Oak Ave Unit 2 Peoria, IL | 3.0 | 1.0 | 1120 | $1,200 | $1.07 | 21d | 1 | 1.15mi |
Listing history 11 events
-
2026-04-27status Pending
-
2026-04-17$59,900 Active
-
2026-04-16historical $59,900
-
2024-11-07historical $950
-
2024-08-30$950
-
2022-02-03price $795
-
2021-08-06historical
-
2018-12-05soldstatus $29,900 170-char remark
Show marketing remark (170 chars)
BEDROOM HOME. NEW FURNACE 4 YEARS OLD. THE WOOD FLOORS HAVE BEEN REFINISHED RECENTLY. 2 CAR DETACHED GARAGE. PRIVACY FENCED BACKYARD. FRONT PORCH. HUGE UPSTAIRS BATHROOM.
-
2018-09-28$34,900 170-char remark
Show marketing remark (170 chars)
BEDROOM HOME. NEW FURNACE 4 YEARS OLD. THE WOOD FLOORS HAVE BEEN REFINISHED RECENTLY. 2 CAR DETACHED GARAGE. PRIVACY FENCED BACKYARD. FRONT PORCH. HUGE UPSTAIRS BATHROOM.
-
2004-12-06soldstatus $39,000
-
2004-10-29$39,900
ⓘ Source: listings_history table (triggers on properties + properties_extension) + one-shot
backfill from property_details.listing_events for pre-trigger history.
Tax reassessment forecast IL · Partial reset (capped growth)
- Current annual tax
- $1,519 · $127/mo
- Projected year-2 tax
- $1,519 · $127/mo
- Expected delta
- $0/yr ($0/mo · 0.0%)
ⓘ Screening estimate from a state-policy table — verify with the county assessor before closing.
Climate risk First Street
- Flood 1/10 Low FEMA zone X · 0% chance over 30 yrs
- Wildfire 1/10 Low
- Heat 3/10 Moderate 7 d/yr ≥105°F today · 18 d/yr by 30 yrs out
- Wind 2/10 Low 100% chance of damaging wind over 30 yrs
- Air quality 3/10 Moderate 1 unhealthy d/yr today · 3 by 30 yrs out
Nearby sold comps map
Loading sold comps map…
Walkable amenities ~0.75 mi
Loading nearby amenities…
Taxation est. · year 1
- Rental income
- $11,321
- − Mortgage interest
- −$3,355
- − Property taxes
- −$1,519
- − Insurance
- −$300
- − Repairs & maintenance
- −$906
- − Management
- −$906
- − Depreciation
- −$1,743
- Taxable income
- $2,593
- Est. tax owed @ 24.0%
- −$622
- After-tax cash flow
- $2,733/yr
For passive investors: Depreciation is non-cash, so a rental often shows a tax loss while cash-flowing — sheltering income. Rental losses are passive: they offset passive income freely, and up to $25,000/yr can offset ordinary (W-2) income if you actively participate and your MAGI is under $100k (phasing out to $0 by $150k); unused losses carry forward. On sale, claimed depreciation is recaptured at up to 25%, and gains may owe capital-gains tax (a 1031 exchange can defer both). Figures are a year-1 estimate at your 24.0% rate — not tax advice; consult a CPA.
Schools (NCES district)
- District
- Peoria SD 150
- NCES district ID
- 1731230
- Math proficiency
- 11% ▼ -5.00%
- Reading proficiency
- 14% ▼ -4.00%
- Median HH income
- $41,951
- Composite
- 10.92/100
- National rank
- #9751
- State rank
- #554 of 620 in IL
Livability — Peoria
- Score
- 73/100
- State rank
- #270
- US rank
- #5096
Category grades
Schools grade is shown separately in the Schools card above.
Census & demographics
- Census place
- Peoria, IL
- County
- Peoria County · 120,495 people
- City population
- 114,670
- Metro
- Peoria, IL
- Population (ZIP)
- 15,356
- Household income
- $41,618
- Rent vs Own
- Severe rent burden
- 849.0
Population outlook (Peoria County) Hauer SSP2
- Today (2025)
- 183,007 people
- By 2030
- 179,643 · -1.8%
- By 2040
- 171,782 · -6.1%
- By 2050
- 163,508 · -10.7%
- By 2075
- 140,178 · -23.4%
- By 2100
- 114,493 · -37.4%
Race, ethnicity, and origin ACS 2023
- Neighborhood character
- Diverse neighborhood (Simpson 0.68)
- Race & ethnicity
- Black 43% White 36% Two or more races 12% Hispanic / Latino 10% Asian 1%
- Hispanic origin (detail)
- Mexican 7%
- Common ancestry
- Italian 2% Slovak 1% Lithuanian 1%
- Foreign-born
- 7% · Canada
- Languages at home
- 91% English-only · Spanish 6% Tagalog/Filipino 1%
Political lean MEDSL · Peoria
- 2024 margin
- Toss-up / Even · D 51.5% · R 46.9% · Other 1.6%
- 2008→2024 swing
- -9.2pp toward R · 2008: 13.9pp · 2024: 4.7pp
- All cycles
- 2024: D+4.7 2020: D+6.3 2016: D+2.8 2012: D+4.4 2008: D+13.9
Not yet ingested
- Civics
- —
Market trends
- HPI YoY
- ▼ -65.98%
- Current HPI
- 141.5343
- Rent YoY
- ▲ 3.49%
- Metro
- Peoria, IL
- State GDP YoY
- ▲ 1.59%
- F500 in state
- 60
Industry mix (Fortune 500 HQ in IL)
| Industry | F500 HQs | Revenue |
|---|---|---|
| Insurance | 4 | $201B |
|
||
| Consumer Goods | 4 | $87B |
|
||
| Industrial Machinery | 3 | $64B |
|
||
| Healthcare | 2 | $55B |
|
||
| Retail / Pharmacy | 1 | $148B |
|
||
| Agriculture / Food | 1 | $86B |
|
||
Price history
+50.1% since first listed11 events — show timeline
- 2026-04-27 Pending — RMLSA as Distributed by MLS Grid
- 2026-04-17 Listed $59,900 RMLSA as Distributed by MLS Grid
- 2026-04-16 Coming Soon $59,900 RMLSA as Distributed by MLS Grid
- 2024-11-07 Rental Removed $950 APPFOLIO
- 2024-08-30 Listed for Rent $950 APPFOLIO
- 2022-02-03 Price Changed $795 RENT.
- 2021-08-06 Listing Removed — RMLSA as Distributed by MLS Grid
- 2018-12-05 Sold (MLS) $29,900 RMLSA as Distributed by MLS Grid
- 2018-09-28 Listed $34,900 RMLSA as Distributed by MLS Grid
- 2004-12-06 Sold (MLS) $39,000 RMLSA as Distributed by MLS Grid
- 2004-10-29 Listed $39,900 RMLSA as Distributed by MLS Grid
Property tax history
-0.7%/yrLatest (2024): $1,519 · +4.8% YoY. Source: county tax records.
Cash-flow waterfall
monthlySold comps — $/sqft
last 12 mo · ≤1 miLoading sold comps…