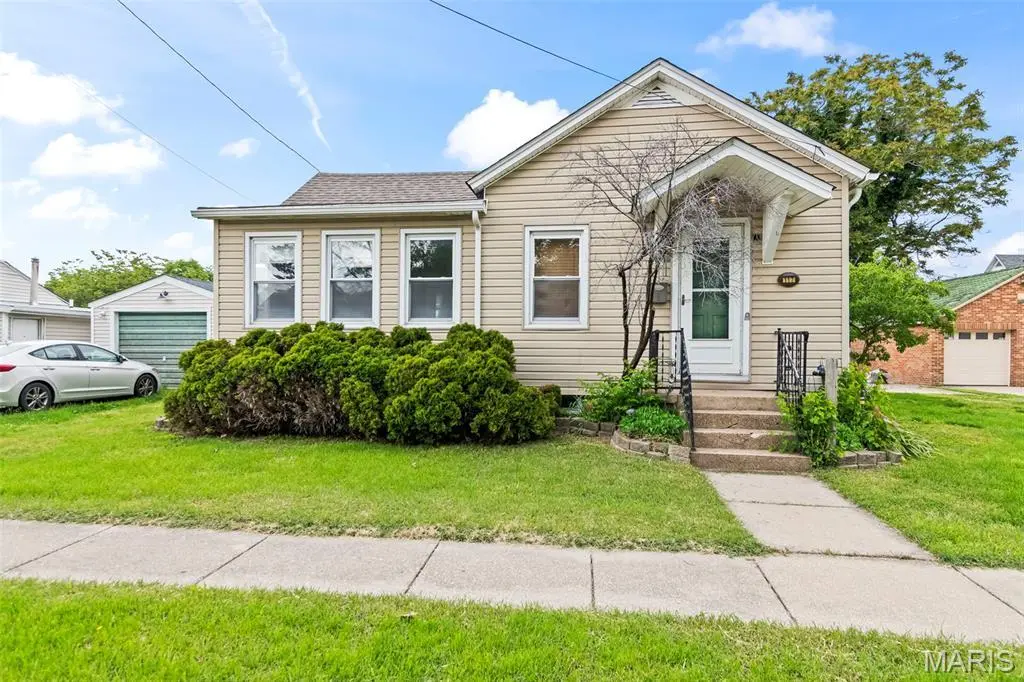
117 W Ferdon St · Litchfield, IL
Flood risk 1/10 · Minimal
- FEMA flood zone
- X
- Chance of flooding over 30 yrs
- 0.0%
- Est. flood insurance / yr
- $473 – $860
Fire risk 1/10 · Minimal
- Est. fire insurance / yr
- $804 – $1,492
Heat risk 4/10 · Minor
- Hot days now (above 106°F)
- 7 days/yr
- Hot days in 30 yrs
- 21 days/yr
Wind risk 2/10 · Minimal
- Chance of severe wind over 30 yrs
- 1.0%
Air-quality risk 2/10 · Minimal
- Unhealthy air days now
- 1 days/yr
- Unhealthy air days in 30 yrs
- 1 days/yr
Risk factors via First Street. Map © Google.
Why this score? — see what drove the C+ grade
The composite is a weighted blend of 9 inputs, each scored 0–100. Each bar is that input's sub-score; the figure is the points it added to the 100-point composite (weight × sub-score).
- Cash flow +23.7/30.0
- ARV discount +15.0/15.0
- DSCR +7.6/10.0
- 1% rule +5.7/10.0
- Livability +3.4/5.0
- Rent growth +2.5/5.0
- Condition / age +2.5/5.0
- Schools +2.1/10.0
- Appreciation +0.0/10.0
$100,000
🖨 Deal sheet (PDF) 📄 Offer letter ✓ Due diligence
Listing remarks
Charming, Cozy & Ready to Welcome You Home! With its adorable curb appeal and inviting feel, this 2 bedroom, 1 bath home is full of charm and comfort! Step inside to find a welcoming living room, dining area, and a cozy kitchen complete with a breakfast nook and convenient main level laundry. The primary bedroom features an attached sitting room that would make the perfect reading nook, home office, or relaxing retreat. Outside, you'll find a 1 car detached garage and a property that’s easy to maintain while still offering all the comforts of home. Whether you're searching for the perfect starter home or looking to downsize, this delightful home is one you won’t want to mi
Key facts
- 5,227 sq ft lot
- Garage
- Built 1915
Property features AI
Exterior
- Parking: 1-car garage
- Utilities: Public water; Public sewer; Electric service by Ameren
- Home design: Single-family residence; One level
- Construction: Vinyl siding
- Exterior features: City lot
Interior
- Bedrooms: 2 bedrooms, both on the main level
- Bathrooms: 1 full bathroom (main level)
- Heating & cooling: Forced air heating (natural gas); Central air conditioning
- Interior features: Unfinished basement
Neighborhood map
What this means for you Summary
Snapshot
- This is a 2-bed/1.0-bath single-family listed at $100k.
Deal economics
- At list price, monthly cash flow is $190 ($2k/yr) — positive.
- The deal already cash-flows at list — no discount required.
- Meets the 1% rule at list price ($1k rent vs $100k).
- Recommended offer: $97k (3.0% below list) — sets the bar for market timing.
- Cap rate 8.6% vs local median 4.5% in Litchfield — top-decile yield for the area; either an underpriced asset or a hidden risk that comps aren't pricing in. Stress-test before assuming the spread holds.
Location & tenants
- Location reads 68/100 on livability (#448 in IL) — a middle-class / working-renter tenant base. Strengths: cost of living A+, housing A+, health & safety A+; Watch: crime C-, employment D+, amenities F.
- Litchfield CUSD 12 (town): math 15% / reading 34% proficiency, ranked #359 of 620 in IL (top 58%) — low school quality limits family demand, transient renter base, plan for 1-2y turnover.
- Zoned schools: Madison Park Elem School (179 students, 0% FRL); Litchfield Middle School (math 12% / reading 43%, grade F, #295 of 665 statewide, top 45%, 246 students, 0% FRL); Litchfield Senior High School (math 22% / reading 27%, grade F, #256 of 693 statewide, top 44%, 411 students, 0% FRL) — zoned schools average 0% FRL vs 49% district-wide (49 pts lower); this property's tenant base skews higher-income than the district average.
- Market conditions: 59 active listings in the ZIP; 12 units permitted in Montgomery County in 2024 (0 in 5+ unit buildings).
Forward outlook
- Local home prices are declining (-3.0%/yr); year-one equity from $691 of loan paydown is wiped out by about $3k of value loss. Plan a longer hold.
- Montgomery County population projected at -20% by 2050 — secular population decline; favor cash flow + early exit over multi-decade hold.
Negotiation context
- It's been on market 32 days — a 3% lower offer ($97k) is reasonable based on typical stale-listing flexibility.
Risks & watch-outs
- Watch-outs: built in 1915 — expect roof / HVAC / electrical / plumbing capex.
Questions for the listing agent
- It's been on market 32 days. Have you received any prior offers? Is the seller open to a 3% concession, seller financing, or rate buy-down credit?
- Built in 1915 — when were the roof, HVAC, electrical panel, plumbing, and water heater last replaced?
- Is there a deadline driving the sale (1031 exchange, divorce, estate, relocation)? That informs how much negotiation room exists.
- Schools are F-rated, which usually means shorter tenancies and higher turnover. Who's the typical renter profile here, and what's been the actual vacancy rate?
- What's the average days-on-market for RENTAL listings here right now (not sales)? A rising rental-DOM trend means longer vacancies and softer asking-rent achievability than the comps imply.
- What's the recent tenant-quality profile in this submarket — average credit score on applications, eviction rate, late-payment / NSF rate, and stable-employment percentage? A property-management company in the area should have these aggregated.
- How much new for-sale + rental construction is in the pipeline within 1–3 miles? Heavy new supply typically softens prices + rents 12–24 months out; constrained supply supports both.
Investment metrics
- 1% rule
- 1.07% ✓
- Cap rate
- 8.58%
- Cash-on-cash
- 8.16%
- DSCR
- 1.36
- GRM
- 7.8
CMA / ARV
- ARV (on-the-fly)
- $158,232
- Comps found
- 12
Show comp detail 12 sales within ~0.75 mi
| Address | Dist | Beds/Ba | Sqft | Sold | Price | $/sf | Match |
|---|---|---|---|---|---|---|---|
| 211 E Beach St | 0.16mi | 3/1.0 (+1) | 1,400 (+1%) | 8mo | $49,900 | $36 | 80 |
| 711 N Franklin | 0.39mi | 2/1.0 | 1,491 (+7%) | 1mo | $15,000 | $10 | 68 |
| 34 Woodlawn Dr | 0.49mi | 2/1.5 | 1,401 (+1%) | 7mo | $165,000 | $118 | 67 |
| 1521 N Jackson St | 0.34mi | 3/1.0 (+1) | 1,321 (-5%) | 7mo | $124,900 | $95 | 65 |
| 721 N Franklin St | 0.38mi | 2/2.0 | 1,450 (+4%) | 9mo | $44,000 | $30 | 64 |
| 413 E Beach St | 0.28mi | 3/1.0 (+1) | 1,282 (-8%) | 7mo | $164,900 | $129 | 63 |
| 1226 N Van Buren St | 0.27mi | 3/1.5 (+1) | 1,584 (+14%) | 2mo | $180,000 | $114 | 56 |
| 1517 N State St | 0.29mi | 3/2.0 (+1) | 1,564 (+13%) | 2mo | $250,000 | $160 | 55 |
| 704 N Monroe St | 0.24mi | 3/2.0 (+1) | 1,192 (-14%) | 2mo | $167,000 | $140 | 55 |
| 1600 N Harrison St | 0.46mi | 3/1.5 (+1) | 1,232 (-11%) | 7mo | $149,900 | $122 | 47 |
| 912 N Illinois Ave | 0.66mi | 3/1.0 (+1) | 1,284 (-8%) | 8mo | $95,000 | $74 | 45 |
| 204 E Columbia St | 0.75mi | 2/1.0 | 1,223 (-12%) | 7mo | $42,000 | $34 | 40 |
Match score weights: distance 35% · size 25% · config 20% · recency 20%. Top-matched comps best support the ARV.
Projected returns pro-forma
-3.0% appreciation · 3.0% rent growth · sell at horizon
- IRR
- -3.9%
- Equity multiple
- 0.85×
- Total profit
- $-4,092
- Equity at exit
- $14,910
- IRR
- 5.8%
- Equity multiple
- 1.43×
- Total profit
- $12,012
- Equity at exit
- $8,646
Cash invested: $28,000 (down + closing). Projections, not guarantees.
Landlord ↔ Tenant lean methodology
- Overall (STATE)
- 43 Moderately Tenant-Leaning
- State Illinois
- 43 Moderately Tenant-Leaning · D+7
- County
- — inherits STATE
- City
- — inherits STATE
ZIP-level market 62056
- Home prices YoY
- -26.5%
- Active inventory
- 59
- Price-to-rent
- 7.8×
Monthly cashflow live
- Estimated rent
- $1,066 medium interval (Pro) →
- Mortgage (P&I)
- −$524
- Tax from tax record
- −$86 /mo · $1,028/yr
- Insurance
- −$42
- HOA
- −$0
- Vacancy / Maint / Mgmt
- −$224
- Net cashflow
- $190
Break-even live
Sensitivity live
| Price | -10% $247 | -5% $219 | +0% $190 | +5% $162 | +10% $134 |
|---|---|---|---|---|---|
| Rent | -10% $106 | -5% $148 | +0% $190 | +5% $232 | +10% $275 |
| Rate | -1.0pp $241 | -0.5pp $216 | base $190 | +0.5pp $164 | +1.0pp $138 |
UW: 25.0% down · 7.5% · 30yr · 1.5% tax · 5.0% vac · 8.0% maint · 8.0% mgmt
Financing live
Cash to close
- Down payment
- $25,000
- Closing costs
- $3,000
- Reserves months
- —
- Total cash needed
- —
Loan-product check · same deal, 3 products live
Conventional
25% down · 7.5% · 30yr
- Down + closing
- —
- Monthly P&I
- —
- Monthly cashflow
- —
- DSCR
- —
- Eligible?
- —
Personal DTI + credit; lowest rate.
DSCR
20% down · 8.5% · 30yr
- Down + closing
- —
- Monthly P&I
- —
- Monthly cashflow
- —
- DSCR
- —
- Eligible?
- —
No personal income docs; deal must DSCR.
Hard money
10% down · 12.0% · 12mo
- Down + closing
- —
- Monthly P&I
- —
- Monthly cashflow
- —
- DSCR
- —
- Eligible?
- —
Short-term bridge; refi at stabilization.
Listing history 18 events
-
2026-06-21days on market $100,000 Active 32 DOM
-
2026-06-21days on market $100,000 Active 31 DOM
-
2026-06-18days on market $100,000 Active 29 DOM
-
2026-06-17days on market $100,000 Active 28 DOM
-
2026-06-16days on market $100,000 Active 27 DOM
-
2026-06-15days on market $100,000 Active 26 DOM
-
2026-06-13days on market $100,000 Active 24 DOM
-
2026-06-12days on market $100,000 Active 23 DOM
-
2026-06-09days on market $100,000 Active 20 DOM
-
2026-06-08days on market $100,000 Active 19 DOM
-
2026-06-07days on market $100,000 Active 18 DOM
-
2026-06-07days on market $100,000 Active 17 DOM
-
2026-06-04days on market $100,000 Active 14 DOM
-
2026-06-02days on market $100,000 Active 13 DOM
-
2026-06-01days on market $100,000 Active 12 DOM
-
2026-05-31days on market $100,000 Active 11 DOM
-
2026-05-31days on market $100,000 Active 10 DOM
-
2026-05-20$100,000 Active
ⓘ Source: listings_history table (triggers on properties + properties_extension) + one-shot
backfill from property_details.listing_events for pre-trigger history.
Tax reassessment forecast IL · Partial reset (capped growth)
- Current annual tax
- $1,028 · $86/mo
- Projected year-2 tax
- $1,649 · $137/mo
- Expected delta
- +$621/yr (+$52/mo · 60.4%)
ⓘ Screening estimate from a state-policy table — verify with the county assessor before closing.
Climate risk First Street
- Flood 1/10 Low FEMA zone X · 0% chance over 30 yrs
- Wildfire 1/10 Low
- Heat 4/10 Moderate 7 d/yr ≥106°F today · 21 d/yr by 30 yrs out
- Wind 2/10 Low 100% chance of damaging wind over 30 yrs
- Air quality 2/10 Low 1 unhealthy d/yr today · 1 by 30 yrs out
Nearby sold comps map
Loading sold comps map…
Walkable amenities ~0.75 mi
Loading nearby amenities…
Taxation est. · year 1
- Rental income
- $12,791
- − Mortgage interest
- −$5,602
- − Property taxes
- −$1,028
- − Insurance
- −$500
- − Repairs & maintenance
- −$1,023
- − Management
- −$1,023
- − Depreciation
- −$2,909
- Taxable income
- $706
- Est. tax owed @ 24.0%
- −$169
- After-tax cash flow
- $2,114/yr
For passive investors: Depreciation is non-cash, so a rental often shows a tax loss while cash-flowing — sheltering income. Rental losses are passive: they offset passive income freely, and up to $25,000/yr can offset ordinary (W-2) income if you actively participate and your MAGI is under $100k (phasing out to $0 by $150k); unused losses carry forward. On sale, claimed depreciation is recaptured at up to 25%, and gains may owe capital-gains tax (a 1031 exchange can defer both). Figures are a year-1 estimate at your 24.0% rate — not tax advice; consult a CPA.
Schools (NCES district)
- District
- Litchfield CUSD 12
- NCES district ID
- 1723250
- Math proficiency
- 15% ▼ -5.00%
- Reading proficiency
- 34% ▼ -8.00%
- Median HH income
- $43,133
- Composite
- 20.91/100
- National rank
- #8485
- State rank
- #359 of 620 in IL
Livability — Litchfield
- Score
- 68/100
- State rank
- #448
- US rank
- #9263
Category grades
Schools grade is shown separately in the Schools card above.
Census & demographics
- Census place
- Litchfield, IL
- City population
- 8,591
- Population (ZIP)
- 8,591
Population outlook (Montgomery County) Hauer SSP2
- Today (2025)
- 27,471 people
- By 2030
- 26,410 · -3.9%
- By 2040
- 24,233 · -11.8%
- By 2050
- 21,948 · -20.1%
- By 2075
- 16,686 · -39.3%
- By 2100
- 11,369 · -58.6%
Race, ethnicity, and origin ACS 2023
- Neighborhood character
- Predominantly White (99%)
- Race & ethnicity
- White 99%
- Common ancestry
- Slovak 3% Lithuanian 2% Romanian 1%
- Foreign-born
- 1%
Political lean MEDSL · Montgomery
- 2024 margin
- Solid R (+44.0) · D 27.1% · R 71.1% · Other 1.8%
- 2008→2024 swing
- -46.7pp toward R · 2008: 2.6pp · 2024: -44.0pp
- All cycles
- 2024: R+44.0 2020: R+41.0 2016: R+40.0 2012: R+14.2 2008: D+2.6
Not yet ingested
- Civics
- —
Market trends
- HPI YoY
- ▼ -53.86%
- Current HPI
- 149.5766
- Rent YoY
- —
- Metro
- —
- State GDP YoY
- ▲ 1.59%
- F500 in state
- 60
Industry mix (Fortune 500 HQ in IL)
| Industry | F500 HQs | Revenue |
|---|---|---|
| Insurance | 4 | $201B |
|
||
| Consumer Goods | 4 | $87B |
|
||
| Industrial Machinery | 3 | $64B |
|
||
| Healthcare | 2 | $55B |
|
||
| Retail / Pharmacy | 1 | $148B |
|
||
| Agriculture / Food | 1 | $86B |
|
||
Price history
1 event — show timeline
- 2026-05-20 Listed $100,000 MARIS as Distributed by MLS Grid
Property tax history
+3.9%/yrLatest (2024): $1,028 · +7.0% YoY. Source: county tax records.
Cash-flow waterfall
monthlySold comps — $/sqft
last 12 mo · ≤1 miLoading sold comps…