 🌊 Lakefront
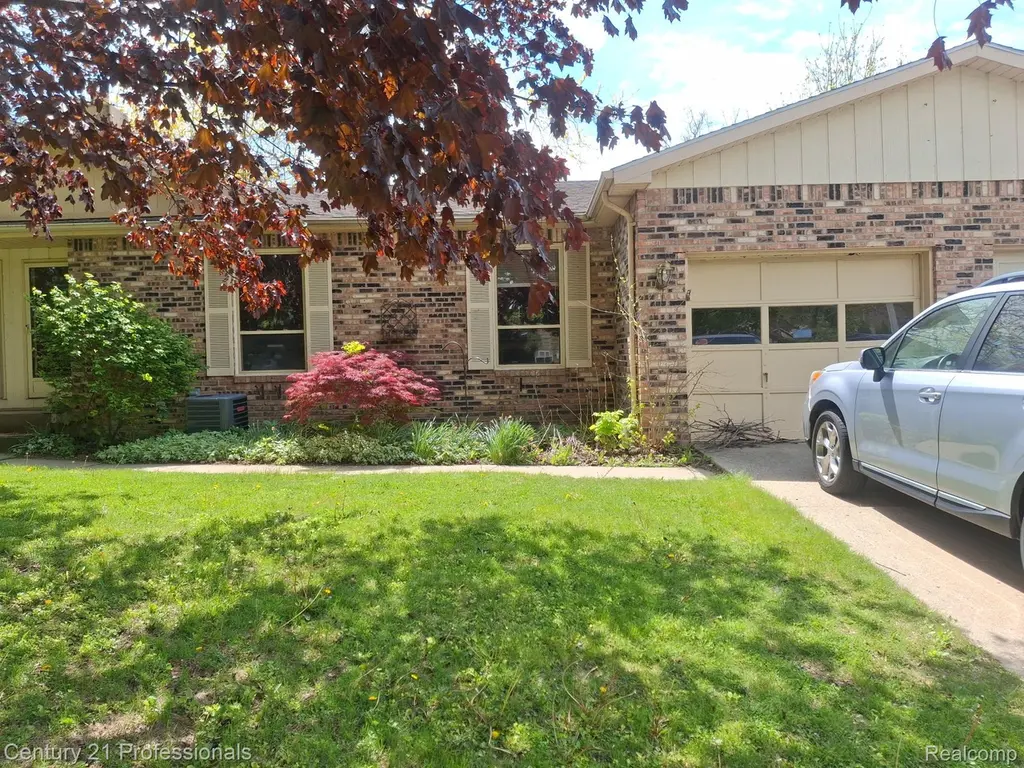
2513 Golden Shores Dr · Fenton, MI
Flood risk 1/10 · Minimal
- FEMA flood zone
- X (unshaded)
- Chance of flooding over 30 yrs
- 0.0%
- Est. flood insurance / yr
- $473 – $860
Fire risk 3/10 · Minor
- Est. fire insurance / yr
- $784 – $1,456
Heat risk 2/10 · Minimal
- Hot days now (above 96°F)
- 7 days/yr
- Hot days in 30 yrs
- 15 days/yr
Wind risk 2/10 · Minimal
- Chance of severe wind over 30 yrs
- —
Air-quality risk 2/10 · Minimal
- Unhealthy air days now
- 1 days/yr
- Unhealthy air days in 30 yrs
- 3 days/yr
Risk factors via First Street. Map © Google.
Why this score? — see what drove the C- grade
The composite is a weighted blend of 9 inputs, each scored 0–100. Each bar is that input's sub-score; the figure is the points it added to the 100-point composite (weight × sub-score).
- Cash flow +15.3/30.0
- ARV discount +15.0/15.0
- DSCR +4.7/10.0
- 1% rule +4.5/10.0
- Schools +4.1/10.0
- Livability +3.9/5.0
- Rent growth +3.1/5.0
- Condition / age +2.5/5.0
- Appreciation +0.0/10.0
$245,000
🖨 Deal sheet 📄 Offer letter ✓ Due diligence
Listing remarks MLS
Great opportunity for waterfront living. Fishing, canoeing, and kayaking on Golden Pond. Townhouse has 3 bedrooms, 2 full baths. L shaped living room, dining room. Kitchen has newer appliances and eat in space. Walk out lower level leads out to deck and water. Laundry area in lower level includes washer and dryer. Nice size rooms throughout. One car attached garage. Lots of living space inside and out. Occupancy at closing. Don't wait to make it yours! Summer is coming!!!
Key facts
- Deck and water
- Laundry area
- Newer appliances
Tags
Neighborhood map
What this means for you Summary
Snapshot
- This is a 3-bed/2.0-bath single-family listed at $245k.
Deal economics
- At list price, monthly cash flow is $91 ($1k/yr) — positive.
- The deal already cash-flows at list — no discount required.
- To meet the 1% rule (rent ≥ 1% of price), the offer needs to be $234k (4.6% below list).
- Recommended offer: $223k (9.0% below list) — sets the bar for market timing.
- Cap rate 6.7% vs local median 3.0% in Fenton — top-decile yield for the area; either an underpriced asset or a hidden risk that comps aren't pricing in. Stress-test before assuming the spread holds.
Location & tenants
- Location reads 77/100 on livability (#130 in MI, #3,197 nationally) — a middle-class / working-renter tenant base. Strengths: cost of living A+, housing A+, health & safety A-; Watch: amenities F, commute F.
- Lake Fenton Community Schools (rural): math 40% / reading 52% proficiency, ranked #124 of 540 in MI (top 23%) — families likely to look elsewhere, expect single-tenant / working-renter base with shorter leases.
- Market conditions: Rents rising (+2.6%/yr); 311 active listings in the ZIP; 1 comparable units currently listed for rent nearby; solid renter incomes; 419 units permitted in Genesee County in 2024 (68 in 5+ unit buildings).
Forward outlook
- Local home prices are declining (-3.0%/yr); year-one equity from $2k of loan paydown is wiped out by about $7k of value loss. Plan a longer hold.
- Genesee County population projected at -27% by 2050 — secular population decline; favor cash flow + early exit over multi-decade hold.
Negotiation context
- It's been on market 101 days — a 9% lower offer ($223k) is reasonable based on typical stale-listing flexibility.
- 6 sale attempts since 13y ago; this cycle's ask has dropped $15k (6%) from the opening price — seller is motivated, your offer sets the floor, not the list.
- Current owner paid $155k; list at $245k implies a 58% gain — meaningful room to come down on a strong offer.
Questions for the listing agent
- It's been on market 101 days. Have you received any prior offers? Is the seller open to a 9% concession, seller financing, or rate buy-down credit?
- Why hasn't it sold? Are there any deal-killer items the seller is aware of (foundation, flood, title, zoning, code violations)?
- Is there a deadline driving the sale (1031 exchange, divorce, estate, relocation)? That informs how much negotiation room exists.
- Schools are B-rated — typically a magnet for longer-tenancy family renters. What's the average tenant stay here, and is there a school-zone premium baked into asking?
- This sits on a lake — are riparian / water-frontage rights deeded with the parcel? Any dock permits, shoreline easements, or HOA water-use restrictions?
- What's the documented flood / surge / shoreline-erosion history here (FEMA AND non-FEMA — e.g., storm surge, creek backup, septic-field saturation)?
- Any water-quality or seasonal algae-bloom issues that affect tenant satisfaction or short-term-rental demand?
- What's the average days-on-market for RENTAL listings here right now (not sales)? A rising rental-DOM trend means longer vacancies and softer asking-rent achievability than the comps imply.
- What's the recent tenant-quality profile in this submarket — average credit score on applications, eviction rate, late-payment / NSF rate, and stable-employment percentage? A property-management company in the area should have these aggregated.
- How much new for-sale + rental construction is in the pipeline within 1–3 miles? Heavy new supply typically softens prices + rents 12–24 months out; constrained supply supports both.
Investment metrics
- 1% rule
- 0.95% ✗
- Cap rate
- 6.74%
- Cash-on-cash
- 1.59%
- DSCR
- 1.07
- GRM
- 8.7
CMA / ARV
- ARV (median comp)
- $326,448
- List price
- $245,000
- Delta
- -24.95%
- Verdict
- UNDERPRICED
- Comps
- 20 within 1.0 mi
Show comp detail 12 sales within ~0.75 mi
| Address | Dist | Beds/Ba | Sqft | Sold | Price | $/sf | Match |
|---|---|---|---|---|---|---|---|
| 2509 Golden Shores Dr | 0.01mi | 3/2.0 | 1,828 (-2%) | 5mo | $255,000 | $139 | 92 |
| 2497 Golden Shores Dr | 0.03mi | 3/2.0 | 1,950 (+5%) | 7mo | $220,000 | $113 | 85 |
| 2369 Golden Shores Dr | 0.26mi | 3/2.0 | 1,880 (+1%) | 5mo | $205,000 | $109 | 82 |
| 3180 Rolston Rd | 0.36mi | 3/1.5 | 1,848 (-1%) | 9mo | $290,000 | $157 | 73 |
| 2490 Golden Shores Ct | 0.32mi | 2/2.0 (-1) | 1,908 (+2%) | 10mo | $550,000 | $288 | 68 |
| 14020 North Rd | 0.49mi | 3/2.5 | 1,758 (-6%) | 1mo | $425,000 | $242 | 65 |
| 2414 Cranewood Dr | 0.31mi | 4/1.0 (+1) | 1,970 (+6%) | 5mo | $525,000 | $266 | 62 |
| 2236 Grove Park Rd | 0.66mi | 3/2.0 | 1,746 (-6%) | 0mo | $779,900 | $447 | 58 |
| 2236 Grove Park Rd | 0.66mi | 3/2.0 | 1,746 (-6%) | 0mo | $779,900 | $447 | 58 |
| 14108 North Rd | 0.63mi | 4/2.0 (+1) | 1,819 (-2%) | 4mo | $395,000 | $217 | 58 |
| 13147 Lake Shore Dr | 0.48mi | 3/2.0 | 1,705 (-8%) | 10mo | $765,000 | $449 | 55 |
| 14152 North Rd | 0.72mi | 3/2.5 | 1,788 (-4%) | 9mo | $415,000 | $232 | 51 |
Match score weights: distance 35% · size 25% · config 20% · recency 20%. Top-matched comps best support the ARV.
Projected returns pro-forma
-3.0% appreciation · 2.59% rent growth · sell at horizon
- IRR
- -14.2%
- Equity multiple
- 0.49×
- Total profit
- $-34,806
- Equity at exit
- $36,530
- IRR
- -6.1%
- Equity multiple
- 0.61×
- Total profit
- $-26,473
- Equity at exit
- $21,183
Cash invested: $68,600 (down + closing). Projections, not guarantees.
Landlord ↔ Tenant lean methodology
- Overall (STATE)
- 62 Landlord-Friendly
- State Michigan
- 62 Landlord-Friendly · EVEN
- County
- — inherits STATE
- City
- — inherits STATE
ZIP-level market 48430
- Rents YoY
- 2.6%
- Active inventory
- 311
- Price-to-rent
- 8.7×
Monthly cashflow live
- Estimated rent
- $2,338 medium interval (Pro) →
- Mortgage (P&I)
- −$1,285
- Tax from tax record
- −$369 /mo · $4,430/yr
- Insurance
- −$102
- HOA
- −$0
- Vacancy / Maint / Mgmt
- −$491
- Net cashflow
- $91
Break-even live
UW: 25.0% down · 7.5% · 30yr · 1.5% tax · 5.0% vac · 8.0% maint · 8.0% mgmt
Financing live
Cash to close
- Down payment
- $61,250
- Closing costs
- $7,350
- Reserves months
- —
- Total cash needed
- —
Loan-product check · same deal, 3 products live
Conventional
25% down · 7.5% · 30yr
- Down + closing
- —
- Monthly P&I
- —
- Monthly cashflow
- —
- DSCR
- —
- Eligible?
- —
Personal DTI + credit; lowest rate.
DSCR
20% down · 8.5% · 30yr
- Down + closing
- —
- Monthly P&I
- —
- Monthly cashflow
- —
- DSCR
- —
- Eligible?
- —
No personal income docs; deal must DSCR.
Hard money
10% down · 12.0% · 12mo
- Down + closing
- —
- Monthly P&I
- —
- Monthly cashflow
- —
- DSCR
- —
- Eligible?
- —
Short-term bridge; refi at stabilization.
Rent comps 1 comps
| Address | Beds | Baths | Sqft | Rent | $/sqft | DOM | Units | Dist |
|---|---|---|---|---|---|---|---|---|
| 14292 Westman Dr Fenton, MI | 3.0 | 3.5 | 2485 | $4,200 | $1.69 | 20d | 1 | 1.35mi |
Listing history 32 events
-
2026-06-18days on market $245,000 Active 101 DOM
-
2026-06-17days on market $245,000 Active 100 DOM
-
2026-06-16days on market $245,000 Active 99 DOM
-
2026-06-15days on market $245,000 Active 98 DOM
-
2026-06-14days on market $245,000 Active 96 DOM
-
2026-06-13days on market $245,000 Active 95 DOM
-
2026-06-10days on market $245,000 Active 93 DOM
-
2026-06-09days on market $245,000 Active 92 DOM
-
2026-06-08days on market $245,000 Active 91 DOM
-
2026-06-07days on market $245,000 Active 90 DOM
-
2026-06-03days on market $245,000 Active 86 DOM
-
2026-06-02days on market $245,000 Active 85 DOM
-
2026-06-01days on market $245,000 Active 84 DOM
-
2026-05-31days on market $245,000 Active 83 DOM
-
2026-05-30days on market $245,000 Active 82 DOM
-
2026-05-04price $245,000 476-char remark
Show marketing remark (476 chars)
Great opportunity for waterfront living. Fishing, canoeing, and kayaking on Golden Pond. Townhouse has 3 bedrooms, 2 full baths. L shaped living room, dining room. Kitchen has newer appliances and eat in space. Walk out lower level leads out to deck and water. Laundry area in lower level includes washer and dryer. Nice size rooms throughout. One car attached garage. Lots of living space inside and out. Occupancy at closing. Don't wait to make it yours! Summer is coming!!!
-
2026-03-09$260,000 Active 476-char remark
Show marketing remark (476 chars)
Great opportunity for waterfront living. Fishing, canoeing, and kayaking on Golden Pond. Townhouse has 3 bedrooms, 2 full baths. L shaped living room, dining room. Kitchen has newer appliances and eat in space. Walk out lower level leads out to deck and water. Laundry area in lower level includes washer and dryer. Nice size rooms throughout. One car attached garage. Lots of living space inside and out. Occupancy at closing. Don't wait to make it yours! Summer is coming!!!
-
2020-11-06soldstatus $155,000
-
2020-11-03soldstatus $155,000 Sold
-
2020-11-03soldstatus $155,000 Closed
-
2020-09-08status Pending
-
2020-09-08status Pending
-
2019-12-09$149,900 Active
-
2019-12-09$149,900 Active
-
2014-06-05soldstatus $95,800
-
2014-05-20soldstatus $95,800
-
2014-05-20soldstatus $95,800
-
2014-03-08historical
-
2013-10-07$109,900
-
2013-10-07$109,900
ⓘ Source: listings_history table (triggers on properties + properties_extension) + one-shot
backfill from property_details.listing_events for pre-trigger history.
Tax reassessment forecast MI · Partial reset (capped growth)
- Current annual tax
- $4,430 · $369/mo
- Projected year-2 tax
- $4,430 · $369/mo
- Expected delta
- $0/yr ($0/mo · 0.0%)
ⓘ Screening estimate from a state-policy table — verify with the county assessor before closing.
Climate risk First Street
- Flood 1/10 Low FEMA zone X (unshaded) · 0% chance over 30 yrs
- Wildfire 3/10 Moderate
- Heat 2/10 Low 7 d/yr ≥96°F today · 15 d/yr by 30 yrs out
- Wind 2/10 Low
- Air quality 2/10 Low 1 unhealthy d/yr today · 3 by 30 yrs out
Nearby sold comps map
Loading sold comps map…
Walkable amenities ~0.75 mi
Loading nearby amenities…
Taxation est. · year 1
- Rental income
- $28,053
- − Mortgage interest
- −$13,724
- − Property taxes
- −$4,430
- − Insurance
- −$1,225
- − Repairs & maintenance
- −$2,244
- − Management
- −$2,244
- − Depreciation
- −$7,127
- Taxable loss
- −$2,941
- Est. tax savings @ 24.0%
- +$706
- After-tax cash flow
- $1,795/yr
For passive investors: Depreciation is non-cash, so a rental often shows a tax loss while cash-flowing — sheltering income. Rental losses are passive: they offset passive income freely, and up to $25,000/yr can offset ordinary (W-2) income if you actively participate and your MAGI is under $100k (phasing out to $0 by $150k); unused losses carry forward. On sale, claimed depreciation is recaptured at up to 25%, and gains may owe capital-gains tax (a 1031 exchange can defer both). Figures are a year-1 estimate at your 24.0% rate — not tax advice; consult a CPA.
Schools (NCES district)
- District
- Lake Fenton Community Schools
- NCES district ID
- 2620670
- Math proficiency
- 40% ▼ -8.00%
- Reading proficiency
- 52% ▼ -8.00%
- Median HH income
- $65,788
- Composite
- 40.93/100
- National rank
- #3609
- State rank
- #124 of 540 in MI
Livability — Fenton
- Score
- 77/100
- State rank
- #130
- US rank
- #3197
Category grades
Schools grade is shown separately in the Schools card above.
Census & demographics
- Census place
- Lake Fenton, MI
- County
- Livingston County · 121,626 people
- City population
- 39,309
- Metro
- Detroit-Warren-Dearborn, MI
- Population (ZIP)
- 39,309
- Household income
- $100,193
- Rent vs Own
- Severe rent burden
- 642.0
Population outlook (Genesee County) Hauer SSP2
- Today (2025)
- 381,312 people
- By 2030
- 362,731 · -4.9%
- By 2040
- 321,550 · -15.7%
- By 2050
- 279,212 · -26.8%
- By 2075
- 193,336 · -49.3%
- By 2100
- 128,118 · -66.4%
Race, ethnicity, and origin ACS 2023
- Neighborhood character
- Predominantly White (91%)
- Race & ethnicity
- White 91% Two or more races 4% Hispanic / Latino 3% Asian 1% Black 1%
- Common ancestry
- Romanian 10% Lithuanian 5% Slovak 3%
- Foreign-born
- 2% · Canada
- Languages at home
- 97% English-only · Spanish 1% Other Asian/Pacific 1% Other Indo-European 1%
Political lean MEDSL · Genesee
- 2024 margin
- Toss-up / Even · D 51.4% · R 47.2% · Other 1.4%
- 2008→2024 swing
- -28.3pp toward R · 2008: 32.5pp · 2024: 4.2pp
- All cycles
- 2024: D+4.2 2020: D+9.3 2016: D+9.5 2012: D+28.2 2008: D+32.5
Not yet ingested
- Civics
- —
Market trends
- HPI YoY
- ▼ -298.66%
- Current HPI
- 238.8371
- Rent YoY
- ▲ 2.59%
- Metro
- Detroit-Warren-Dearborn, MI
- State GDP YoY
- ▲ 1.37%
- F500 in state
- 28
Industry mix (Fortune 500 HQ in MI)
| Industry | F500 HQs | Revenue |
|---|---|---|
| Automotive Parts | 3 | $48B |
|
||
| Automotive | 2 | $372B |
|
||
| Chemicals | 1 | $45B |
|
||
| Automotive Retail | 1 | $29B |
|
||
| Healthcare / Medical Devices | 1 | $23B |
|
||
| Automotive Technology | 1 | $20B |
|
||
Price history
+122.9% since first listed17 events — show timeline
- 2026-05-04 Price Changed $245,000 MiRealSource-MiMLS
- 2026-05-04 Price Changed $245,000 REALCOMP
- 2026-03-09 Listed $260,000 REALCOMP
- 2026-03-09 Listed $260,000 MiRealSource-MiMLS
- 2020-11-06 Sold (Public Records) $155,000 Public Records
- 2020-11-03 Sold (MLS) $155,000 MiRealSource-MiMLS
- 2020-11-03 Sold (MLS) $155,000 REALCOMP
- 2020-09-08 Pending — REALCOMP
- 2020-09-08 Pending — MiRealSource-MiMLS
- 2019-12-09 Listed $149,900 MiRealSource-MiMLS
- 2019-12-09 Listed $149,900 REALCOMP
- 2014-06-05 Sold (Public Records) $95,800 Public Records
- 2014-05-20 Sold (MLS) $95,800 MiRealSource-MiMLS
- 2014-05-20 Sold (MLS) $95,800 REALCOMP
- 2014-03-08 Listing Removed — MiRealSource-MiMLS
- 2013-10-07 Listed $109,900 MiRealSource-MiMLS
- 2013-10-07 Listed $109,900 REALCOMP
Property tax history
+6.8%/yrLatest (2025): $4,430 · +8.6% YoY. Source: county tax records.
Cash-flow waterfall
monthlySold comps — $/sqft
last 12 mo · ≤1 miLoading sold comps…