209 Shorthorn Rd · Cheraw, SC
Flood risk No data
- FEMA flood zone
- —
- Chance of flooding over 30 yrs
- —
- Est. flood insurance / yr
- —
Fire risk No data
- Est. fire insurance / yr
- —
Heat risk No data
- Hot days now (above threshold)
- —
- Hot days in 30 yrs
- —
Wind risk No data
- Chance of severe wind over 30 yrs
- —
Air-quality risk No data
- Unhealthy air days now
- —
- Unhealthy air days in 30 yrs
- —
Risk factors via First Street. Map © Google.
Why this score? — see what drove the C+ grade
The composite is a weighted blend of 9 inputs, each scored 0–100. Each bar is that input's sub-score; the figure is the points it added to the 100-point composite (weight × sub-score).
- Cash flow +29.0/30.0
- DSCR +10.0/10.0
- 1% rule +8.1/10.0
- ARV discount +7.5/15.0
- Livability +2.6/5.0
- Rent growth +2.5/5.0
- Schools +2.5/10.0
- Condition / age +2.5/5.0
- Appreciation +0.0/10.0
$90,000
🖨 Deal sheet 📄 Offer letter ✓ Due diligence
Listing remarks
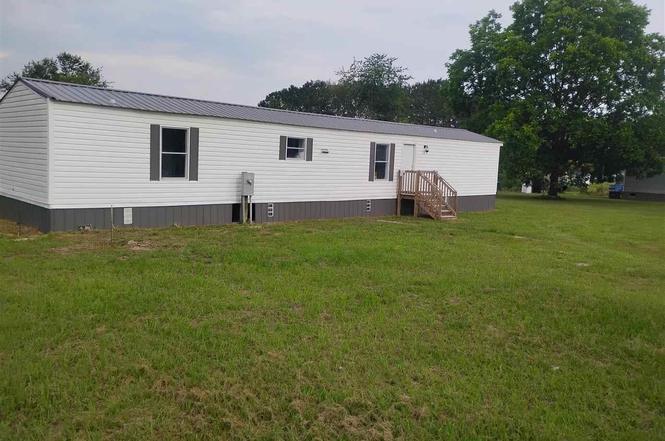
Don't miss this beautifully renovated 1996 Fleetwood manufactured home situated on a peaceful 1 -acre lot. Offering 2 bedrooms and 2 full bathrooms, this home combines comfort, affordability, and country charm. This home provides a fresh move in ready feel. The functional floor plan features a comfortable living area, a bright kitchen with ample cabinet space, and a private primary suite with its own full bath. The second bedroom and bath provides flexibility for guests, family, or a home office. Enjoy the tranquility of rural living with plenty of outdoor space for gardening, recreation, or future improvements. The possibilities are endless. This property is being sold AS-IS. Make your app
Key facts
- Bright kitchen
- Peaceful acre lot
- Ample cabinet space
Tags
Property features AI
Exterior
- Utilities: Public water; Septic tank
- Home design: Mobile home (manufactured); Residential property
- Construction: Vinyl siding
- Exterior features: Metal roof; Lot on 1 acre
Interior
- Flooring: Vinyl flooring
- Bathrooms: 2 full bathrooms
- Heating & cooling: Ceiling fan(s); Has cooling
- Interior features: Walk-in closet(s); Crawl space basement
Neighborhood map
What this means for you Summary
Snapshot
- This is a 2-bed/2.0-bath manufactured listed at $90k.
Deal economics
- At list price, monthly cash flow is $309 ($4k/yr) — positive.
- The deal already cash-flows at list — no discount required.
- Meets the 1% rule at list price ($1k rent vs $90k).
- Cap rate 10.4% vs local median 4.0% in Cheraw — top-decile yield for the area; either an underpriced asset or a hidden risk that comps aren't pricing in. Stress-test before assuming the spread holds.
Location & tenants
- Location reads 52/100 on livability (#354 in SC) — a working-class tenant base; expect higher turnover. Strengths: cost of living A+; Watch: crime F, amenities F, commute F.
- Chesterfield 01 (rural): math 25% / reading 36% proficiency, ranked #55 of 80 in SC (top 69%) — families likely to look elsewhere, expect single-tenant / working-renter base with shorter leases; 63% free/reduced lunch — lower-income household profile, screen leases tightly.
- Zoned schools: Cheraw Primary (468 students, 100% FRL); Long Middle (math 12% / reading 25%, grade F, #186 of 229 statewide, top 82%, 416 students, 100% FRL); Cheraw High (math 42% / reading 67%, grade C-, #130 of 196 statewide, top 69%, 654 students, 100% FRL) — zoned schools average 100% FRL vs 63% district-wide (37 pts higher); higher-poverty schools than district average — tighter screening recommended.
- Market conditions: 84 active listings in the ZIP; 145 units permitted in Chesterfield County in 2024 (10 in 5+ unit buildings).
Forward outlook
- Local home prices are declining (-3.0%/yr); year-one equity from $622 of loan paydown is wiped out by about $3k of value loss. Plan a longer hold.
- Chesterfield County population projected at -17% by 2050 — secular population decline; favor cash flow + early exit over multi-decade hold.
- At projected returns (-3.0% appreciation + 3.0% rent growth), your $25k cash investment doubles in ~8 years — after that, you're playing with house money.
Negotiation context
- Only 8 days on market — expect competitive offers; lowballing is unlikely to land.
Questions for the listing agent
- Is there a deadline driving the sale (1031 exchange, divorce, estate, relocation)? That informs how much negotiation room exists.
- Schools are D-rated, which usually means shorter tenancies and higher turnover. Who's the typical renter profile here, and what's been the actual vacancy rate?
- Crime grade is F in this area — have there been break-ins, vandalism, or insurance claims at this property in the last 3 years? What carrier currently insures it and at what premium?
- What's the average days-on-market for RENTAL listings here right now (not sales)? A rising rental-DOM trend means longer vacancies and softer asking-rent achievability than the comps imply.
- What's the recent tenant-quality profile in this submarket — average credit score on applications, eviction rate, late-payment / NSF rate, and stable-employment percentage? A property-management company in the area should have these aggregated.
- How much new for-sale + rental construction is in the pipeline within 1–3 miles? Heavy new supply typically softens prices + rents 12–24 months out; constrained supply supports both.
Investment metrics
- 1% rule
- 1.31% ✓
- Cap rate
- 10.41%
- Cash-on-cash
- 14.72%
- DSCR
- 1.65
- GRM
- 6.4
CMA / ARV
No comps found within radius.
Projected returns pro-forma
-3.0% appreciation · 3.0% rent growth · sell at horizon
- IRR
- 5.2%
- Equity multiple
- 1.20×
- Total profit
- $5,119
- Equity at exit
- $13,419
- IRR
- 14.7%
- Equity multiple
- 2.19×
- Total profit
- $29,878
- Equity at exit
- $7,782
Cash invested: $25,200 (down + closing). Projections, not guarantees.
Landlord ↔ Tenant lean methodology
- Overall (STATE)
- 90 Strongly Landlord-Friendly
- State South Carolina
- 90 Strongly Landlord-Friendly · R+6
- County
- — inherits STATE
- City
- — inherits STATE
ZIP-level market 29520
- Home prices YoY
- -17.3%
- Active inventory
- 84
- Price-to-rent
- 6.4×
Monthly cashflow live
- Estimated rent
- $1,179 medium interval (Pro) →
- Mortgage (P&I)
- −$472
- Tax est. 1.5%
- −$112 /mo · $1,350/yr
- Insurance
- −$38
- HOA
- −$0
- Vacancy / Maint / Mgmt
- −$247
- Net cashflow
- $309
Break-even live
UW: 25.0% down · 7.5% · 30yr · 1.5% tax · 5.0% vac · 8.0% maint · 8.0% mgmt
Financing live
Cash to close
- Down payment
- $22,500
- Closing costs
- $2,700
- Reserves months
- —
- Total cash needed
- —
Loan-product check · same deal, 3 products live
Conventional
25% down · 7.5% · 30yr
- Down + closing
- —
- Monthly P&I
- —
- Monthly cashflow
- —
- DSCR
- —
- Eligible?
- —
Personal DTI + credit; lowest rate.
DSCR
20% down · 8.5% · 30yr
- Down + closing
- —
- Monthly P&I
- —
- Monthly cashflow
- —
- DSCR
- —
- Eligible?
- —
No personal income docs; deal must DSCR.
Hard money
10% down · 12.0% · 12mo
- Down + closing
- —
- Monthly P&I
- —
- Monthly cashflow
- —
- DSCR
- —
- Eligible?
- —
Short-term bridge; refi at stabilization.
Listing history 6 events
-
2026-06-18days on market $90,000 Active 8 DOM
-
2026-06-17days on market $90,000 Active 7 DOM
-
2026-06-16days on market $90,000 Active 6 DOM
-
2026-06-15days on market $90,000 Active 5 DOM
-
2026-06-13remarks 699-char remark
-
2026-06-13$90,000 Active 3 DOM
ⓘ Source: listings_history table (triggers on properties + properties_extension) + one-shot
backfill from property_details.listing_events for pre-trigger history.
Nearby sold comps map
Loading sold comps map…
Walkable amenities ~0.75 mi
Loading nearby amenities…
Taxation est. · year 1
- Rental income
- $14,142
- − Mortgage interest
- −$5,041
- − Property taxes
- −$1,350
- − Insurance
- −$450
- − Repairs & maintenance
- −$1,131
- − Management
- −$1,131
- − Depreciation
- −$2,618
- Taxable income
- $2,420
- Est. tax owed @ 24.0%
- −$581
- After-tax cash flow
- $3,128/yr
For passive investors: Depreciation is non-cash, so a rental often shows a tax loss while cash-flowing — sheltering income. Rental losses are passive: they offset passive income freely, and up to $25,000/yr can offset ordinary (W-2) income if you actively participate and your MAGI is under $100k (phasing out to $0 by $150k); unused losses carry forward. On sale, claimed depreciation is recaptured at up to 25%, and gains may owe capital-gains tax (a 1031 exchange can defer both). Figures are a year-1 estimate at your 24.0% rate — not tax advice; consult a CPA.
Schools (NCES district)
- District
- Chesterfield 01
- NCES district ID
- 4501560
- Math proficiency
- 25% ▼ -11.00%
- Reading proficiency
- 36% ▬ 0.00%
- Median HH income
- $33,946
- Composite
- 25.04/100
- National rank
- #7547
- State rank
- #55 of 80 in SC
Livability — Cheraw
- Score
- 52/100
- State rank
- #354
- US rank
- #24998
Category grades
Schools grade is shown separately in the Schools card above.
Census & demographics
- Population (ZIP)
- 12,860
Population outlook (Chesterfield County) Hauer SSP2
- Today (2025)
- 44,632 people
- By 2030
- 43,331 · -2.9%
- By 2040
- 40,218 · -9.9%
- By 2050
- 36,847 · -17.4%
- By 2075
- 29,636 · -33.6%
- By 2100
- 23,536 · -47.3%
Race, ethnicity, and origin ACS 2023
- Neighborhood character
- Diverse neighborhood (Simpson 0.59)
- Race & ethnicity
- White 47% Black 43% Two or more races 6% Hispanic / Latino 4%
- Common ancestry
- Slovak 1% Lithuanian 1% Serbian 1%
- Foreign-born
- 3% · Canada, Guatemala
- Languages at home
- 94% English-only · Spanish 3% German/W. Germanic 1%
Political lean MEDSL · Chesterfield
- 2024 margin
- Strong R (+28.1) · D 35.5% · R 63.5% · Other 1.0%
- 2008→2024 swing
- -25.1pp toward R · 2008: -3.0pp · 2024: -28.1pp
- All cycles
- 2024: R+28.1 2020: R+20.5 2016: R+14.3 2012: R+3.3 2008: R+3.0
Not yet ingested
- Civics
- —
Market trends
- HPI YoY
- ▼ -43.46%
- Current HPI
- 207.8249
- Rent YoY
- —
- Metro
- —
- State GDP YoY
- ▲ 4.51%
- F500 in state
- 2
Industry mix (Fortune 500 HQ in SC)
| Industry | F500 HQs | Revenue |
|---|---|---|
| Packaging | 1 | $7B |
|
||
Price history
1 event — show timeline
- 2026-06-10 Listed $90,000 RAGPD
Property tax history
+0.0%/yrLatest (2017): $50 · +0.0% YoY. Source: county tax records.
Cash-flow waterfall
monthlySold comps — $/sqft
last 12 mo · ≤1 miLoading sold comps…