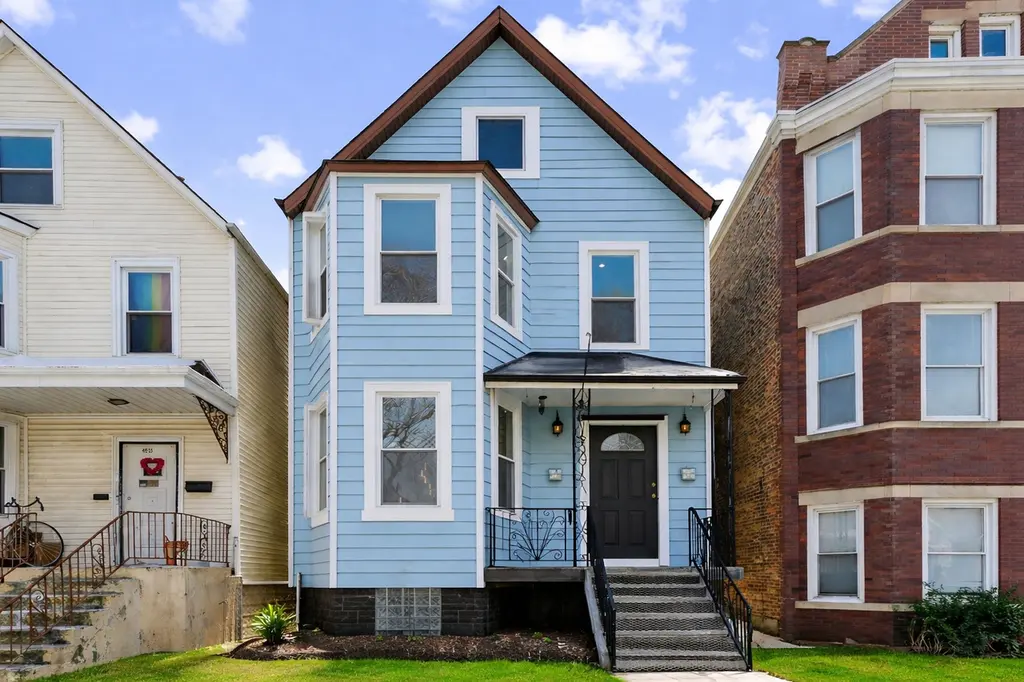
 Triplex
5003 W 31st St · Cicero, IL
Flood risk 4/10 · Minor
- FEMA flood zone
- X (unshaded)
- Chance of flooding over 30 yrs
- 0.24%
- Est. flood insurance / yr
- $473 – $860
Fire risk 1/10 · Minimal
- Est. fire insurance / yr
- $804 – $1,492
Heat risk 3/10 · Minor
- Hot days now (above 99°F)
- 7 days/yr
- Hot days in 30 yrs
- 15 days/yr
Wind risk 2/10 · Minimal
- Chance of severe wind over 30 yrs
- 1.0%
Air-quality risk 4/10 · Minor
- Unhealthy air days now
- 4 days/yr
- Unhealthy air days in 30 yrs
- 6 days/yr
Risk factors via First Street. Map © Google.
Why this score? — see what drove the F grade
The composite is a weighted blend of 9 inputs, each scored 0–100. Each bar is that input's sub-score; the figure is the points it added to the 100-point composite (weight × sub-score).
- Cash flow +9.9/30.0
- ARV discount +7.5/15.0
- Livability +4.1/5.0
- Rent growth +3.1/5.0
- DSCR +2.8/10.0
- 1% rule +2.6/10.0
- Condition / age +2.5/5.0
- Schools +1.1/10.0
- Appreciation +0.0/10.0
$629,000
🖨 Deal sheet 📄 Offer letter ✓ Due diligence
Multi-family units
County records classify this as Multi-Family (2-4 Unit). Listing-text estimate: 3 units. confirmed
Listing remarks MLS
Great investment opportunity in Cicero! This property offers solid potential for rental income or future value-add. Convenient location close to shops, schools, and transportation. *Seller is conveying this property subject to the inspection report located in the additional information section on this MLS listing. Property being sold as-is*
Key facts
- Rental income unit
- Full gut rehab
- Master bedroom bath
Tags
Property features AI
Finance
- Other: Property listed as income-producing with unit rents reported (first-floor unit rent $2,000; second-floor unit rent $2,900); Tenants pay utilities including electric, gas, and heat
- Financial info: Special service area: No
Exterior
- Parking: Detached garage with 2 garage spaces (2 total parking spaces)
- Utilities: Public water; Public sewer
- Home design: Two- to four-unit property (2 units total); Rehab completed/recorded in 2026; Fee simple ownership; Building over 100 years old; built before 1978
- Construction: Vinyl siding exterior; Asphalt roof; Structure rehabilitated in 2026
- Exterior features: Less than 0.25 acre lot; Lot dimensions listed as 3130; School bus service available
Interior
- Kitchen: Stove and refrigerator in both units
- Bedrooms: 10 total bedrooms across units; Three-bedroom unit on first floor; Five-bedroom unit on second floor
- Flooring: Hardwood floors in units
- Bathrooms: 4 full bathrooms total; First-floor unit: 1 full bath; Second-floor unit: 2 full baths
- Heating & cooling: Natural gas forced-air heating; Central air conditioning
- Interior features: 14 total rooms; Finished basement with 8+ ft poured ceiling, recreation/family area, sleeping area, full bath, and walk-up access; Community amenities nearby: park, pool, sidewalks, street lights, paved streets
- Laundry & utility: Washer and dryer included in second-floor unit; Laundry hook-up in second-floor unit
Neighborhood map
What this means for you Summary
Snapshot
- This is a 3 × 3-bed/1.3-bath units multifamily listed at $629k.
Deal economics
- At list price, monthly cash flow is $-390 ($-5k/yr) — negative. Per door: $-130/mo.
- To cash-flow at today's rent, offer at most $560k (11.0% below list).
- To meet the 1% rule (rent ≥ 1% of price), the offer needs to be $479k (23.9% below list).
- Recommended offer: $479k (23.9% below list) — sets the bar for 1% rule.
- Cap rate 5.5% vs local median 4.6% in Cicero — meaningfully above typical; check what's discounted (condition, days-on-market, listing class) to confirm the premium yield is real.
Location & tenants
- Location reads 82/100 on livability (#77 in IL, #1,276 nationally) — a professional / high-income tenant draw. Strengths: commute A+, cost of living A+, housing A+; Watch: schools F.
- J S Morton Hsd 201 (suburban): math 9% / reading 14% proficiency, ranked #557 of 620 in IL (top 90%) — low school quality limits family demand, transient renter base, plan for 1-2y turnover.
- Market conditions: Rents rising (+2.4%/yr); 103 active listings in the ZIP; 6,272 units permitted in Cook County in 2024 (4,658 in 5+ unit buildings).
- At $4,787/mo this rent would consume 81% of the median local household income ($71k/yr) (locally 2178% of renters already pay >50% of income on rent) — very limited rent-growth headroom before tenants either downsize or default.
Forward outlook
- Local home prices are declining (-3.0%/yr); year-one equity from $4k of loan paydown is wiped out by about $19k of value loss. Plan a longer hold.
Negotiation context
- It's been on market 35 days — a 3% lower offer ($610k) is reasonable based on typical stale-listing flexibility.
- 2 sale attempts with the ask held roughly flat each time — persistent listings suggest the price (not the market) is what's stuck; bring a comps-based counter.
- Current owner paid $195k; list at $629k implies a 223% gain — meaningful room to come down on a strong offer.
Risks & watch-outs
- Watch-outs: built in 1902 — expect roof / HVAC / electrical / plumbing capex.
Questions for the listing agent
- What do current leases actually rent for vs. the listed asking? Can we see a recent rent roll and the last 12 months of T-12 income?
- It's been on market 35 days. Have you received any prior offers? Is the seller open to a 24% concession, seller financing, or rate buy-down credit?
- Can we see the unit-by-unit rent roll, current vacancy, and any below-market leases? What's the average tenancy length?
- What capital expenditures (roof, boiler, parking lot, exteriors) have been made in the last 5 years, and what's planned in the next 2?
- Built in 1902 — when were the roof, HVAC, electrical panel, plumbing, and water heater last replaced?
- Is there a deadline driving the sale (1031 exchange, divorce, estate, relocation)? That informs how much negotiation room exists.
- Schools are F-rated, which usually means shorter tenancies and higher turnover. Who's the typical renter profile here, and what's been the actual vacancy rate?
- The area grade is low — what's the realistic commute time and amenity access for the typical tenant pool here? Any planned neighborhood developments (good or bad) we should know about?
- What's the average days-on-market for RENTAL listings here right now (not sales)? A rising rental-DOM trend means longer vacancies and softer asking-rent achievability than the comps imply.
- What's the recent tenant-quality profile in this submarket — average credit score on applications, eviction rate, late-payment / NSF rate, and stable-employment percentage? A property-management company in the area should have these aggregated.
- How much new apartment / multifamily construction is in the pipeline within 1–3 miles? Heavy new supply (>2% of stock underway) typically softens rents 12–24 months out; light construction supports rent growth.
Investment metrics
- 1% rule
- 0.76% ✗
- Cap rate
- 5.55%
- Cash-on-cash
- -2.66%
- DSCR
- 0.88
- GRM
- 10.9
CMA / ARV
No comps found within radius.
Projected returns pro-forma
-3.0% appreciation · 2.43% rent growth · sell at horizon
- IRR
- -21.3%
- Equity multiple
- 0.26×
- Total profit
- $-129,543
- Equity at exit
- $93,786
- IRR
- -16.3%
- Equity multiple
- 0.11×
- Total profit
- $-156,023
- Equity at exit
- $54,384
Cash invested: $176,120 (down + closing). Projections, not guarantees.
Landlord ↔ Tenant lean methodology
- Overall (STATE)
- 43 Moderately Tenant-Leaning
- State Illinois
- 43 Moderately Tenant-Leaning · D+7
- County
- — inherits STATE
- City
- — inherits STATE
ZIP-level market 60804
- Rents YoY
- 2.4%
- Active inventory
- 103
- Price-to-rent
- 32.8×
Monthly cashflow live
- Estimated rent
- $4,787 medium interval (Pro) →
- Mortgage (P&I)
- −$3,299
- Tax from tax record
- −$611 /mo · $7,336/yr
- Insurance
- −$262
- HOA
- −$0
- Vacancy / Maint / Mgmt
- −$1,005
- Net cashflow
- $-390
Break-even live
3-unit breakdown (identical units grouped — click to expand)
| Units | Beds | Baths | Est. rent |
|---|---|---|---|
| 3× units | 3 | 1.3 | $4,788 |
| #1 | 3 | 1.3 | $1,596 |
| #2 | 3 | 1.3 | $1,596 |
| #3 | 3 | 1.3 | $1,596 |
| Total (3 units) | $4,787 | ||
UW: 25.0% down · 7.5% · 30yr · 1.5% tax · 5.0% vac · 8.0% maint · 8.0% mgmt
Financing live
Cash to close
- Down payment
- $157,250
- Closing costs
- $18,870
- Reserves months
- —
- Total cash needed
- —
Loan-product check · same deal, 3 products live
Conventional
25% down · 7.5% · 30yr
- Down + closing
- —
- Monthly P&I
- —
- Monthly cashflow
- —
- DSCR
- —
- Eligible?
- —
Personal DTI + credit; lowest rate.
DSCR
20% down · 8.5% · 30yr
- Down + closing
- —
- Monthly P&I
- —
- Monthly cashflow
- —
- DSCR
- —
- Eligible?
- —
No personal income docs; deal must DSCR.
Hard money
10% down · 12.0% · 12mo
- Down + closing
- —
- Monthly P&I
- —
- Monthly cashflow
- —
- DSCR
- —
- Eligible?
- —
Short-term bridge; refi at stabilization.
Listing history 7 events
-
2026-04-28status Pending
-
2026-04-22historical Contingent - Continue to Show
-
2026-03-24$629,000 Active
-
2026-01-15soldstatus $195,000
-
2026-01-09soldstatus $194,900 Closed 342-char remark
Show marketing remark (342 chars)
Great investment opportunity in Cicero! This property offers solid potential for rental income or future value-add. Convenient location close to shops, schools, and transportation. *Seller is conveying this property subject to the inspection report located in the additional information section on this MLS listing. Property being sold as-is*
-
2025-12-18historical Contingent - No Showings 342-char remark
Show marketing remark (342 chars)
Great investment opportunity in Cicero! This property offers solid potential for rental income or future value-add. Convenient location close to shops, schools, and transportation. *Seller is conveying this property subject to the inspection report located in the additional information section on this MLS listing. Property being sold as-is*
-
2025-12-12$164,900 Active 342-char remark
Show marketing remark (342 chars)
Great investment opportunity in Cicero! This property offers solid potential for rental income or future value-add. Convenient location close to shops, schools, and transportation. *Seller is conveying this property subject to the inspection report located in the additional information section on this MLS listing. Property being sold as-is*
ⓘ Source: listings_history table (triggers on properties + properties_extension) + one-shot
backfill from property_details.listing_events for pre-trigger history.
Tax reassessment forecast IL · Partial reset (capped growth)
- Current annual tax
- $7,336 · $611/mo
- Projected year-2 tax
- $10,807 · $901/mo
- Expected delta
- +$3,471/yr (+$289/mo · 47.3%)
ⓘ Screening estimate from a state-policy table — verify with the county assessor before closing.
Climate risk First Street
- Flood 4/10 Moderate FEMA zone X (unshaded) · 24% chance over 30 yrs
- Wildfire 1/10 Low
- Heat 3/10 Moderate 7 d/yr ≥99°F today · 15 d/yr by 30 yrs out
- Wind 2/10 Low 100% chance of damaging wind over 30 yrs
- Air quality 4/10 Moderate 4 unhealthy d/yr today · 6 by 30 yrs out
Nearby sold comps map
Loading sold comps map…
Walkable amenities ~0.75 mi
Loading nearby amenities…
Taxation est. · year 1
- Rental income
- $57,444
- − Mortgage interest
- −$35,234
- − Property taxes
- −$7,336
- − Insurance
- −$3,145
- − Repairs & maintenance
- −$4,596
- − Management
- −$4,596
- − Depreciation
- −$18,298
- Taxable loss
- −$15,760
- Est. tax savings @ 24.0%
- +$3,782
- After-tax cash flow
- $-900/yr
For passive investors: Depreciation is non-cash, so a rental often shows a tax loss while cash-flowing — sheltering income. Rental losses are passive: they offset passive income freely, and up to $25,000/yr can offset ordinary (W-2) income if you actively participate and your MAGI is under $100k (phasing out to $0 by $150k); unused losses carry forward. On sale, claimed depreciation is recaptured at up to 25%, and gains may owe capital-gains tax (a 1031 exchange can defer both). Figures are a year-1 estimate at your 24.0% rate — not tax advice; consult a CPA.
Schools (NCES district)
- District
- J S Morton Hsd 201
- NCES district ID
- 1726880
- Math proficiency
- 9% ▲ 1.00%
- Reading proficiency
- 14% ▼ -1.00%
- Median HH income
- $48,698
- Composite
- 10.73/100
- National rank
- #9768
- State rank
- #557 of 620 in IL
Livability — Cicero
- Score
- 82/100
- State rank
- #77
- US rank
- #1276
Category grades
Schools grade is shown separately in the Schools card above.
Census & demographics
- Census place
- Cicero, IL
- County
- Cook County · 4,486,803 people
- City population
- 82,797
- Metro
- Chicago-Naperville-Elgin, IL-IN-WI
- Population (ZIP)
- 82,797
- Household income
- $70,842
- Rent vs Own
- Severe rent burden
- 2178.0
Population outlook (Cook County) Hauer SSP2
- Today (2025)
- 5,347,519 people
- By 2030
- 5,357,703 · +0.2%
- By 2040
- 5,324,924 · -0.4%
- By 2050
- 5,230,762 · -2.2%
- By 2075
- 4,785,735 · -10.5%
- By 2100
- 4,188,836 · -21.7%
Race, ethnicity, and origin ACS 2023
- Neighborhood character
- Predominantly Hispanic (89%)
- Race & ethnicity
- Hispanic / Latino 89% Two or more races 17% White 7% Black 3% Native American 2%
- Hispanic origin (detail)
- Mexican 80% Puerto Rican 3%
- Common ancestry
- Romanian 2%
- Foreign-born
- 40% · Canada, Jamaica
- Languages at home
- 18% English-only · Spanish 80%
Political lean MEDSL · Cook
- 2024 margin
- Solid D (+42.0) · D 70.4% · R 28.4% · Other 1.2%
- 2008→2024 swing
- -11.4pp toward R · 2008: 53.4pp · 2024: 42.0pp
- All cycles
- 2024: D+42.0 2020: D+50.3 2016: D+53.0 2012: D+49.4 2008: D+53.4
Not yet ingested
- Civics
- —
Market trends
- HPI YoY
- ▼ -165.38%
- Current HPI
- 262.83
- Rent YoY
- ▲ 2.43%
- Metro
- Chicago-Naperville-Elgin, IL-IN-WI
- State GDP YoY
- ▲ 1.59%
- F500 in state
- 60
Industry mix (Fortune 500 HQ in IL)
| Industry | F500 HQs | Revenue |
|---|---|---|
| Insurance | 4 | $201B |
|
||
| Consumer Goods | 4 | $87B |
|
||
| Industrial Machinery | 3 | $64B |
|
||
| Healthcare | 2 | $55B |
|
||
| Retail / Pharmacy | 1 | $148B |
|
||
| Agriculture / Food | 1 | $86B |
|
||
Price history
+281.4% since first listed7 events — show timeline
- 2026-04-28 Pending — MRED as Distributed by MLS Grid
- 2026-04-22 Contingent — MRED as Distributed by MLS Grid
- 2026-03-24 Listed $629,000 MRED as Distributed by MLS Grid
- 2026-01-15 Sold (Public Records) $195,000 Public Records
- 2026-01-09 Sold (MLS) $194,900 MRED as Distributed by MLS Grid
- 2025-12-18 Contingent — MRED as Distributed by MLS Grid
- 2025-12-12 Listed $164,900 MRED as Distributed by MLS Grid
Property tax history
+3.7%/yrLatest (2023): $7,336 · +12.9% YoY. Source: county tax records.
Cash-flow waterfall
monthlySold comps — $/sqft
last 12 mo · ≤1 miLoading sold comps…