 Duplex
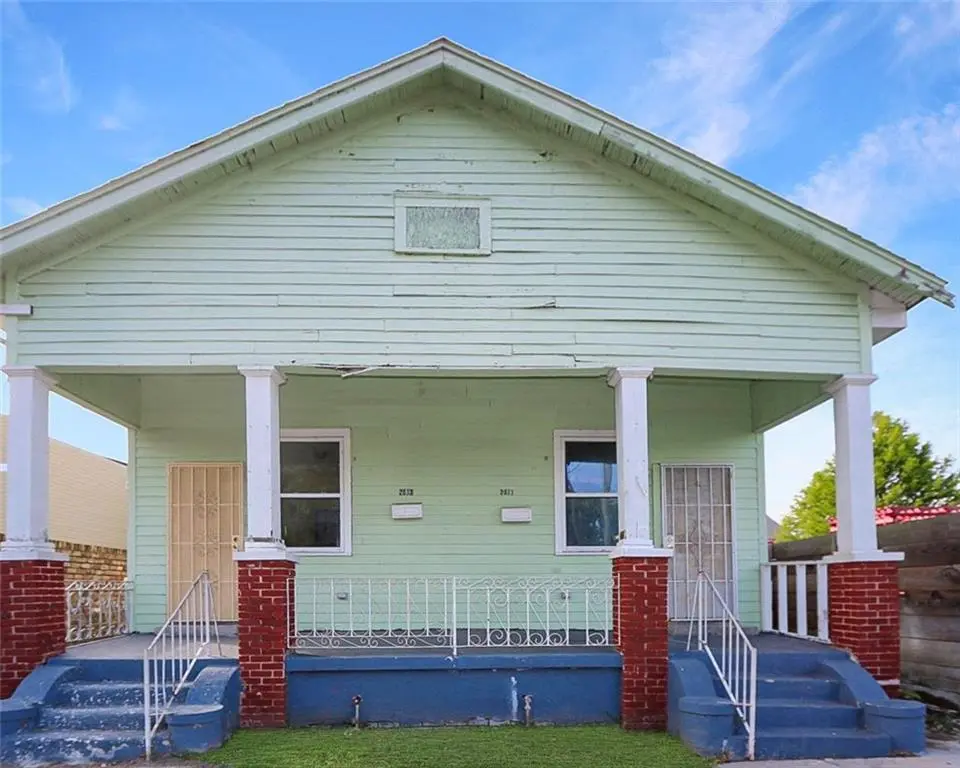
2511 13 La Salle St · New Orleans, LA
Flood risk No data
- FEMA flood zone
- —
- Chance of flooding over 30 yrs
- —
- Est. flood insurance / yr
- —
Fire risk No data
- Est. fire insurance / yr
- —
Heat risk No data
- Hot days now (above threshold)
- —
- Hot days in 30 yrs
- —
Wind risk No data
- Chance of severe wind over 30 yrs
- —
Air-quality risk No data
- Unhealthy air days now
- —
- Unhealthy air days in 30 yrs
- —
Risk factors via First Street. Map © Google.
Why this score? — see what drove the B+ grade
The composite is a weighted blend of 9 inputs, each scored 0–100. Each bar is that input's sub-score; the figure is the points it added to the 100-point composite (weight × sub-score).
- Cash flow +30.0/30.0
- 1% rule +10.0/10.0
- DSCR +10.0/10.0
- Appreciation +10.0/10.0
- ARV discount +7.5/15.0
- Rent growth +4.0/5.0
- Livability +4.0/5.0
- Condition / age +2.2/5.0
- Schools +1.6/10.0
$135,000
🖨 Deal sheet 📄 Offer letter ✓ Due diligence
Multi-family units
County records classify this as Multi-Family (2-4 Unit). Listing-text estimate: 2 units. confirmed
Listing remarks MLS
This is a great opportunity to revitalize this duplex back to its old charm. Home is located just minutes away from St. Charles and Downtown New Orleans.
Key facts
- 3,367 sq ft lot
- Built 1940
- Listed 55 days
Property features AI
Finance
- Financial info: Two-unit property; Tenants pay electricity and gas; owner pays water
Exterior
- Utilities: Public water; Public sewer
- Home design: Single-story building
- Construction: Shingle roof; Slab foundation; Built approximately (year not provided)
- Exterior features: City lot; Rectangular lot; Lot dimensions approximately 30 x 102
Interior
- Bedrooms: Unit 2513: 2 bedrooms; Unit 2511: 2 bedrooms
- Bathrooms: Two full bathrooms total (one full bathroom in each unit)
- Interior features: Average condition
- Laundry & utility: Washer hookup
Neighborhood map
What this means for you Summary
Snapshot
- This is a 2 × 2-bed/1.0-bath units multifamily listed at $135k. Condition is rated fair.
Deal economics
- At list price, monthly cash flow is $2k ($28k/yr) — positive. Per door: $1k/mo.
- The deal already cash-flows at list — no discount required.
- Meets the 1% rule at list price ($4k rent vs $135k).
- Recommended offer: $131k (3.0% below list) — sets the bar for market timing.
- Cap rate 27.2% vs local median 4.4% in New Orleans — top-decile yield for the area; either an underpriced asset or a hidden risk that comps aren't pricing in. Stress-test before assuming the spread holds.
Location & tenants
- Location reads 81/100 on livability (#3 in LA, #1,383 nationally) — a professional / high-income tenant draw. Strengths: amenities A+, commute A+, health & safety A+; Watch: crime C-, employment D.
- Orleans Parish (urban): math 11% / reading 27% proficiency, ranked #69 of 98 in LA (top 70%) — low school quality limits family demand, transient renter base, plan for 1-2y turnover; 68% free/reduced lunch — lower-income household profile, screen leases tightly.
- Market conditions: Rents rising fast (+6.0%/yr); 137 active listings in the ZIP; 40 comparable units currently listed for rent nearby; rentals at typical pace (median 17d on market — plan ~3-4 weeks tenant-placement turnaround); lower-income renter base — watch delinquency; 710 units permitted in Orleans Parish in 2024 (244 in 5+ unit buildings).
- At $4,161/mo this rent would consume 127% of the median local household income ($39k/yr) (locally 714% of renters already pay >50% of income on rent) — very limited rent-growth headroom before tenants either downsize or default.
Forward outlook
- In year one you build about $14k of equity ($933 loan paydown + $14k appreciation (10.0% local appreciation)).
- Orleans County population projected at +61% by 2050 — long-run rental-demand tailwind backs the buy-and-hold thesis.
- At projected returns (10.0% appreciation + 6.0% rent growth), your $38k cash investment doubles in ~1 year — after that, you're playing with house money.
- By year 3, paydown + projected appreciation supports a ~$37k cash-out refi (75% LTV) — recoverable capital for the next deal without selling this one.
Negotiation context
- It's been on market 55 days — a 3% lower offer ($131k) is reasonable based on typical stale-listing flexibility.
- 2 sale attempts since 11y ago with the ask held roughly flat each time — persistent listings suggest the price (not the market) is what's stuck; bring a comps-based counter.
- Current owner paid $40k; list at $135k implies a 238% gain — meaningful room to come down on a strong offer.
Risks & watch-outs
- Watch-outs: built in 1940 — expect roof / HVAC / electrical / plumbing capex.
Questions for the listing agent
- It's been on market 55 days. Have you received any prior offers? Is the seller open to a 3% concession, seller financing, or rate buy-down credit?
- Can we see the unit-by-unit rent roll, current vacancy, and any below-market leases? What's the average tenancy length?
- What capital expenditures (roof, boiler, parking lot, exteriors) have been made in the last 5 years, and what's planned in the next 2?
- Have any recent inspections been done? Can we get a copy of the seller's disclosures and any deferred-maintenance estimates?
- Built in 1940 — when were the roof, HVAC, electrical panel, plumbing, and water heater last replaced?
- Is there a deadline driving the sale (1031 exchange, divorce, estate, relocation)? That informs how much negotiation room exists.
- What's the average days-on-market for RENTAL listings here right now (not sales)? A rising rental-DOM trend means longer vacancies and softer asking-rent achievability than the comps imply.
- What's the recent tenant-quality profile in this submarket — average credit score on applications, eviction rate, late-payment / NSF rate, and stable-employment percentage? A property-management company in the area should have these aggregated.
- How much new apartment / multifamily construction is in the pipeline within 1–3 miles? Heavy new supply (>2% of stock underway) typically softens rents 12–24 months out; light construction supports rent growth.
Investment metrics
- 1% rule
- 3.08% ✓
- Cap rate
- 27.22%
- Cash-on-cash
- 74.74%
- DSCR
- 4.33
- GRM
- 2.7
CMA / ARV
- ARV (median comp)
- $286,940
- List price
- $135,000
- Delta
- -52.95%
- Verdict
- UNDERPRICED
- Comps
- 20 within 1.0 mi
Show comp detail 9 sales within ~0.75 mi
| Address | Dist | Beds/Ba | Sqft | Sold | Price | $/sf | Match |
|---|---|---|---|---|---|---|---|
| 2025 Conti St | 0.49mi | 4/2.0 | 1,680 (+0%) | 7mo | $285,000 | $170 | 70 |
| 2216-18 Saint Louis St | 0.63mi | 4/2.0 | 1,689 (+1%) | 1mo | $335,000 | $198 | 68 |
| 2013-15 Conti St | 0.48mi | 4/2.0 | 1,610 (-4%) | 5mo | $65,000 | $40 | 67 |
| 5428 30 Dauphine St | 0.34mi | 4/2.0 | 1,775 (+6%) | 10mo | $185,000 | $104 | 66 |
| 2424 26 S Derbigny St | 0.26mi | 4/2.0 | 1,558 (-7%) | 15mo | $236,160 | $152 | 64 |
| 917 N Prieur St | 0.72mi | 4/2.0 | 1,700 (+2%) | 4mo | $315,000 | $185 | 61 |
| 2700 02 S Galvez St | 0.52mi | 4/3.0 | 1,600 (-4%) | 20mo | $310,000 | $194 | 47 |
| 2704 06 S Galvez St | 0.52mi | 4/3.0 | 1,548 (-8%) | 16mo | $315,000 | $203 | 46 |
| 1432-1434 Ursulines Ave | 0.70mi | 4/1.0 | 1,888 (+13%) | 6mo | $228,000 | $121 | 37 |
Match score weights: distance 35% · size 25% · config 20% · recency 20%. Top-matched comps best support the ARV.
Projected returns pro-forma
10.0% appreciation · 5.98% rent growth · sell at horizon
- IRR
- 87.9%
- Equity multiple
- 7.25×
- Total profit
- $236,378
- Equity at exit
- $121,619
- IRR
- 83.4%
- Equity multiple
- 17.08×
- Total profit
- $607,708
- Equity at exit
- $262,275
Cash invested: $37,800 (down + closing). Projections, not guarantees.
Landlord ↔ Tenant lean methodology
- Overall (STATE)
- 90 Strongly Landlord-Friendly
- State Louisiana
- 90 Strongly Landlord-Friendly · R+12
- County
- — inherits STATE
- City
- — inherits STATE
ZIP-level market 70113
- Rents YoY
- 6.0%
- Active inventory
- 137
- Price-to-rent
- 5.4×
Monthly cashflow live
- Estimated rent
- $4,161 high interval (Pro) →
- Mortgage (P&I)
- −$708
- Tax est. 1.5%
- −$169 /mo · $2,025/yr
- Insurance
- −$56
- HOA
- −$0
- Vacancy / Maint / Mgmt
- −$874
- Net cashflow
- $2,354
Break-even live
2-unit breakdown (identical units grouped — click to expand)
| Units | Beds | Baths | Est. rent |
|---|---|---|---|
| 2× units | 2 | 1 | $4,160 |
| #1 | 2 | 1 | $2,080 |
| #2 | 2 | 1 | $2,080 |
| Total (2 units) | $4,161 | ||
UW: 25.0% down · 7.5% · 30yr · 1.5% tax · 5.0% vac · 8.0% maint · 8.0% mgmt
Financing live
Cash to close
- Down payment
- $33,750
- Closing costs
- $4,050
- Reserves months
- —
- Total cash needed
- —
Loan-product check · same deal, 3 products live
Conventional
25% down · 7.5% · 30yr
- Down + closing
- —
- Monthly P&I
- —
- Monthly cashflow
- —
- DSCR
- —
- Eligible?
- —
Personal DTI + credit; lowest rate.
DSCR
20% down · 8.5% · 30yr
- Down + closing
- —
- Monthly P&I
- —
- Monthly cashflow
- —
- DSCR
- —
- Eligible?
- —
No personal income docs; deal must DSCR.
Hard money
10% down · 12.0% · 12mo
- Down + closing
- —
- Monthly P&I
- —
- Monthly cashflow
- —
- DSCR
- —
- Eligible?
- —
Short-term bridge; refi at stabilization.
Rent comps 40 comps
| Address | Beds | Baths | Sqft | Rent | $/sqft | DOM | Units | Dist |
|---|---|---|---|---|---|---|---|---|
| 1011 Canal St Unit 1513939P New Orleans, LA | 4.0 | 4.0 | 1765 | $11,253 | $6.38 | 23d | 1 | 0.22mi |
| 1011 Canal St Unit 1513926P New Orleans, LA | 1.0–4.0 | 1.0–4.0 | 1016 | $12,077 | $11.88 | 1d | 2 | 0.22mi |
| 939 Iberville St New Orleans, LA | 1.0–3.0 | 1.0 | 1502 | $3,800 | $2.53 | 11d | 7 | 0.30mi |
| 810 Bienville St New Orleans, LA | 1.0–3.0 | 1.0–2.0 | 995 | $2,688 | $2.70 | 3d | 9 | 0.36mi |
| 324 N Roman St New Orleans, LA | 3.0 | 3.0 | 2100 | $2,500 | $1.19 | 43d | 1 | 0.40mi |
| 618 N Rampart St #204 New Orleans, LA | 3.0 | 2.5 | 1904 | $4,500 | $2.36 | 43d | 1 | 0.43mi |
| 822 Perdido St Unit 1272370P New Orleans, LA | 1.0–5.0 | 1.0–5.0 | 1447 | $5,974 | $4.13 | 3d | 4 | 0.47mi |
| 800 Gravier St Unit 1272312P New Orleans, LA | 2.0–4.0 | 2.0–4.0 | 1673 | $6,169 | $3.69 | 14d | 2 | 0.47mi |
| 1908 Saint Louis St New Orleans, LA | 3.0 | 3.0 | 1234 | $2,300 | $1.86 | 23d | 1 | 0.47mi |
| 518 S Rampart St New Orleans, LA | 3.0 | 2.0 | 1853 | $3,995 | $2.16 | 3d | 1 | 0.49mi |
| 2024 Bienville St New Orleans, LA | 3.0 | 2.0 | 1314 | $2,100 | $1.60 | 23d | 1 | 0.49mi |
| 2033 Conti St New Orleans, LA | 3.0 | 3.0 | 1249 | $2,250 | $1.80 | 14d | 1 | 0.52mi |
| 2105 Bienville St New Orleans, LA | 3.0 | 3.0 | 1231 | $2,350 | $1.91 | 17d | 1 | 0.54mi |
| 811 Burgundy St New Orleans, LA | 4.0 | 2.5 | 2059 | $5,000 | $2.43 | 43d | 1 | 0.57mi |
| 1000 Girod St Ph 2 New Orleans, LA | 3.0 | 3.5 | 2008 | $4,800 | $2.39 | 43d | 1 | 0.62mi |
| 431 Gravier St Ste 4 New Orleans, LA | 3.0 | 2.0 | 2100 | $3,700 | $1.76 | 43d | 1 | 0.65mi |
| 315 N Miro St New Orleans, LA | 3.0 | 3.0 | 1276 | $2,500 | $1.96 | 23d | 1 | 0.66mi |
| 315 N Miro St New Orleans, LA | 3.0 | 3.0 | 1276 | $2,300 | $1.80 | 20d | 1 | 0.66mi |
| 535 Decatur St Unit 3 New Orleans, LA | 3.0 | 2.0 | 1600 | $2,800 | $1.75 | 11d | 1 | 0.68mi |
| 1021 Henriette Delille St New Orleans, LA | 3.0 | 2.0 | 2012 | $2,250 | $1.12 | 17d | 1 | 0.69mi |
| 2320 Conti St New Orleans, LA | 3.0 | 2.0 | 1125 | $2,500 | $2.22 | 23d | 1 | 0.70mi |
| 751 Chartres St New Orleans, LA | 2.0–3.0 | 2.0 | 1461 | $3,450 | $2.36 | 43d | 1 | 0.70mi |
| 1929 Dumaine St New Orleans, LA | 3.0 | 1.0 | 1293 | $1,500 | $1.16 | 3d | 1 | 0.72mi |
| 803 Baronne St New Orleans, LA | 3.0 | 2.0 | 1791 | $3,525 | $1.97 | 3d | 1 | 0.73mi |
| 2304 Gravier St Unit 2304 New Orleans, LA | 3.0 | 2.0 | 1112 | $1,800 | $1.62 | 16d | 1 | 0.74mi |
| 527 Saint Ann St Unit 3 New Orleans, LA | 3.0 | 2.0 | 1687 | $3,500 | $2.07 | 43d | 1 | 0.75mi |
| 515 Saint Ann St Unit 3 New Orleans, LA | 3.0 | 2.0 | 1644 | $3,600 | $2.19 | 44d | 1 | 0.76mi |
| 875 O'Keefe Ave #301 New Orleans, LA | 3.0 | 2.5 | 2029 | $4,500 | $2.22 | 17d | 1 | 0.76mi |
| 1035 N Derbigny St New Orleans, LA | 3.0 | 1.0 | 1075 | $1,399 | $1.30 | 23d | 1 | 0.77mi |
| 2129 Dumaine St New Orleans, LA | 3.0 | 2.0 | 1226 | $1,850 | $1.51 | 3d | 1 | 0.80mi |
| 2517 Palmyra St New Orleans, LA | 3.0 | 2.0 | 1306 | $2,100 | $1.61 | 17d | 1 | 0.80mi |
| 734 Ursulines Ave New Orleans, LA | 3.0 | 2.0 | 1340 | $2,800 | $2.09 | 43d | 1 | 0.80mi |
| 326 S Dorgenois St Unit 326 New Orleans, LA | 4.0 | 3.0 | 1510 | $2,300 | $1.52 | 2d | 1 | 0.84mi |
| 822 Howard Ave Unit 1272354P New Orleans, LA | 1.0–5.0 | 1.0–4.0 | 1749 | $9,250 | $5.29 | 1d | 3 | 0.88mi |
| 2615 Banks St New Orleans, LA | 3.0 | 2.0 | 1200 | $1,900 | $1.58 | 3d | 1 | 0.89mi |
| 2539 Gravier St Unit 2541 New Orleans, LA | 3.0 | 1.0 | 1115 | $1,495 | $1.34 | 16d | 1 | 0.90mi |
| 2652 Banks St New Orleans, LA | 3.0 | 3.5 | 1204 | $2,100 | $1.74 | 23d | 1 | 0.95mi |
| 2645 Gravier St Unit 2645-A New Orleans, LA | 3.0 | 1.0 | 1290 | $1,595 | $1.24 | 23d | 1 | 0.99mi |
| 1217 Kerlerec St Unit B New Orleans, LA | 3.0 | 1.0 | 1300 | $2,100 | $1.62 | 3d | 1 | 0.99mi |
| 1201 Baronne St #1 New Orleans, LA | 3.0 | 2.5 | 1892 | $2,700 | $1.43 | 17d | 1 | 0.99mi |
Listing history 19 events
-
2026-06-18days on market $135,000 Active 55 DOM
-
2026-06-17days on market $135,000 Active 54 DOM
-
2026-06-16days on market $135,000 Active 53 DOM
-
2026-06-15days on market $135,000 Active 52 DOM
-
2026-06-13days on market $135,000 Active 50 DOM
-
2026-06-10days on market $135,000 Active 47 DOM
-
2026-06-09days on market $135,000 Active 46 DOM
-
2026-06-08days on market $135,000 Active 45 DOM
-
2026-06-07days on market $135,000 Active 44 DOM
-
2026-06-05days on market $135,000 Active 41 DOM
-
2026-06-03days on market $135,000 Active 40 DOM
-
2026-06-02days on market $135,000 Active 39 DOM
-
2026-06-01days on market $135,000 Active 38 DOM
-
2026-05-31days on market $135,000 Active 37 DOM
-
2026-04-23$135,000 Active 481-char remark
-
2016-03-02soldstatus $40,000 Sold 153-char remark
Show marketing remark (153 chars)
This is a great opportunity to revitalize this duplex back to its old charm. Home is located just minutes away from St. Charles and Downtown New Orleans.
-
2016-02-19status Under Contract 153-char remark
Show marketing remark (153 chars)
This is a great opportunity to revitalize this duplex back to its old charm. Home is located just minutes away from St. Charles and Downtown New Orleans.
-
2015-12-30price $54,000 153-char remark
Show marketing remark (153 chars)
This is a great opportunity to revitalize this duplex back to its old charm. Home is located just minutes away from St. Charles and Downtown New Orleans.
-
2015-12-11$64,500 Active 153-char remark
Show marketing remark (153 chars)
This is a great opportunity to revitalize this duplex back to its old charm. Home is located just minutes away from St. Charles and Downtown New Orleans.
ⓘ Source: listings_history table (triggers on properties + properties_extension) + one-shot
backfill from property_details.listing_events for pre-trigger history.
Nearby sold comps map
Loading sold comps map…
Walkable amenities ~0.75 mi
Loading nearby amenities…
Taxation est. · year 1
- Rental income
- $49,932
- − Mortgage interest
- −$7,562
- − Property taxes
- −$2,025
- − Insurance
- −$675
- − Repairs & maintenance
- −$3,995
- − Management
- −$3,995
- − Depreciation
- −$3,927
- Taxable income
- $27,754
- Est. tax owed @ 24.0%
- −$6,661
- After-tax cash flow
- $21,590/yr
For passive investors: Depreciation is non-cash, so a rental often shows a tax loss while cash-flowing — sheltering income. Rental losses are passive: they offset passive income freely, and up to $25,000/yr can offset ordinary (W-2) income if you actively participate and your MAGI is under $100k (phasing out to $0 by $150k); unused losses carry forward. On sale, claimed depreciation is recaptured at up to 25%, and gains may owe capital-gains tax (a 1031 exchange can defer both). Figures are a year-1 estimate at your 24.0% rate — not tax advice; consult a CPA.
Condition & rehab AI · 13 photos
This two-unit property requires moderate repairs and maintenance to improve its condition and increase its value. The exterior and interior paint need fresh coats, and the exterior siding and flooring should be replaced to enhance curb appeal and increase its value.
Repairs flagged
- Major Exterior siding — Peeling paint and exposed siding indicate significant damage
- Major Paint — Peeling paint on exterior and interior walls
- Minor Flooring — Some wear on laminate flooring, but not severe
- Minor Kitchen cabinets — Some wear on cabinets, but still functional
- Minor Bathroom fixtures — Some wear on tiles, but still functional
Value-add opportunities
- Both Paint exterior and interior — Fresh paint can significantly improve curb appeal and interior aesthetics
- Both Replace exterior siding — New siding will improve the home's appearance and increase its value
- Both Replace flooring — New flooring will improve the home's appearance and increase its value
- Both Replace kitchen cabinets — New cabinets will improve the home's appearance and increase its value
- Both Replace bathroom fixtures — New fixtures will improve the home's appearance and increase its value
Renovation cost estimate screening
| Repair item | Severity | Est. cost |
|---|---|---|
| Exterior siding · Peeling paint and exposed siding indicate significant damage | Major | $15,000–50,000 |
| Paint · Peeling paint on exterior and interior walls | Major | $15,000–50,000 |
| Flooring · Some wear on laminate flooring, but not severe | Minor | $500–3,000 |
| Kitchen cabinets · Some wear on cabinets, but still functional | Minor | $500–3,000 |
| Bathroom fixtures · Some wear on tiles, but still functional | Minor | $500–3,000 |
| Total estimated repair cost · 5 items | $31,500–109,000 |
Value-add ROI direction
- Both Paint exterior and interior — Fresh paint can significantly improve curb appeal and interior aesthetics ↑
- Both Replace exterior siding — New siding will improve the home's appearance and increase its value ↑
- Both Replace flooring — New flooring will improve the home's appearance and increase its value ↑
- Both Replace kitchen cabinets — New cabinets will improve the home's appearance and increase its value ↑
- Both Replace bathroom fixtures — New fixtures will improve the home's appearance and increase its value ↑
ⓘ Cost ranges are severity-bucket heuristics (US national rule-of-thumb). Get contractor quotes + a written scope before underwriting a rehab budget.
Schools (NCES district)
- District
- Orleans Parish
- NCES district ID
- 2201170
- Math proficiency
- 11% ▼ -52.00%
- Reading proficiency
- 27% ▼ -46.00%
- Median HH income
- $37,011
- Composite
- 15.78/100
- National rank
- #9271
- State rank
- #69 of 98 in LA
Livability — New Orleans
- Score
- 81/100
- State rank
- #3
- US rank
- #1383
Category grades
Schools grade is shown separately in the Schools card above.
Census & demographics
- Census place
- New Orleans, LA
- County
- Orleans Parish · 338,817 people
- City population
- 338,817
- Metro
- New Orleans-Metairie, LA
- Population (ZIP)
- 9,387
- Household income
- $39,333
- Rent vs Own
- Severe rent burden
- 714.0
Population outlook (Orleans County) Hauer SSP2
- Today (2025)
- 513,025 people
- By 2030
- 575,781 · +12.2%
- By 2040
- 700,174 · +36.5%
- By 2050
- 826,541 · +61.1%
- By 2075
- 1,123,374 · +119.0%
- By 2100
- 1,355,609 · +164.2%
Race, ethnicity, and origin ACS 2023
- Neighborhood character
- Diverse neighborhood (Simpson 0.57)
- Race & ethnicity
- Black 61% White 20% Hispanic / Latino 13% Two or more races 11% Asian 2%
- Hispanic origin (detail)
- Mexican 2%
- Common ancestry
- Lithuanian 2% Portuguese 1% Slovak 1%
- Foreign-born
- 13% · Canada, Vietnam, China
- Languages at home
- 86% English-only · Spanish 11% Other Indo-European 1% Vietnamese 1%
Political lean MEDSL · Orleans
- 2024 margin
- Solid D (+67.0) · D 82.2% · R 15.2% · Other 2.7%
- 2008→2024 swing
- +6.7pp toward D · 2008: 60.3pp · 2024: 67.0pp
- All cycles
- 2024: D+67.0 2020: D+68.2 2016: D+66.2 2012: D+62.5 2008: D+60.3
Not yet ingested
- Civics
- —
Market trends
- HPI YoY
- ▲ 65.92%
- Current HPI
- 229.3968
- Rent YoY
- ▲ 5.98%
- Metro
- New Orleans-Metairie, LA
- State GDP YoY
- ▲ 3.29%
- F500 in state
- 10
Industry mix (Fortune 500 HQ in LA)
| Industry | F500 HQs | Revenue |
|---|---|---|
| Telecommunications | 2 | $23B |
|
||
| Utilities | 1 | $12B |
|
||
| Wholesale / Distribution | 1 | $5B |
|
||
| Advertising | 1 | $2B |
|
||
Price history
+109.3% since first listed5 events — show timeline
- 2026-04-23 Listed $135,000 GSREIN
- 2016-03-02 Sold (MLS) $40,000 GSREIN
- 2016-02-19 Pending — GSREIN
- 2015-12-30 Price Changed $54,000 GSREIN
- 2015-12-11 Listed $64,500 GSREIN
Cash-flow waterfall
monthlySold comps — $/sqft
last 12 mo · ≤1 miLoading sold comps…