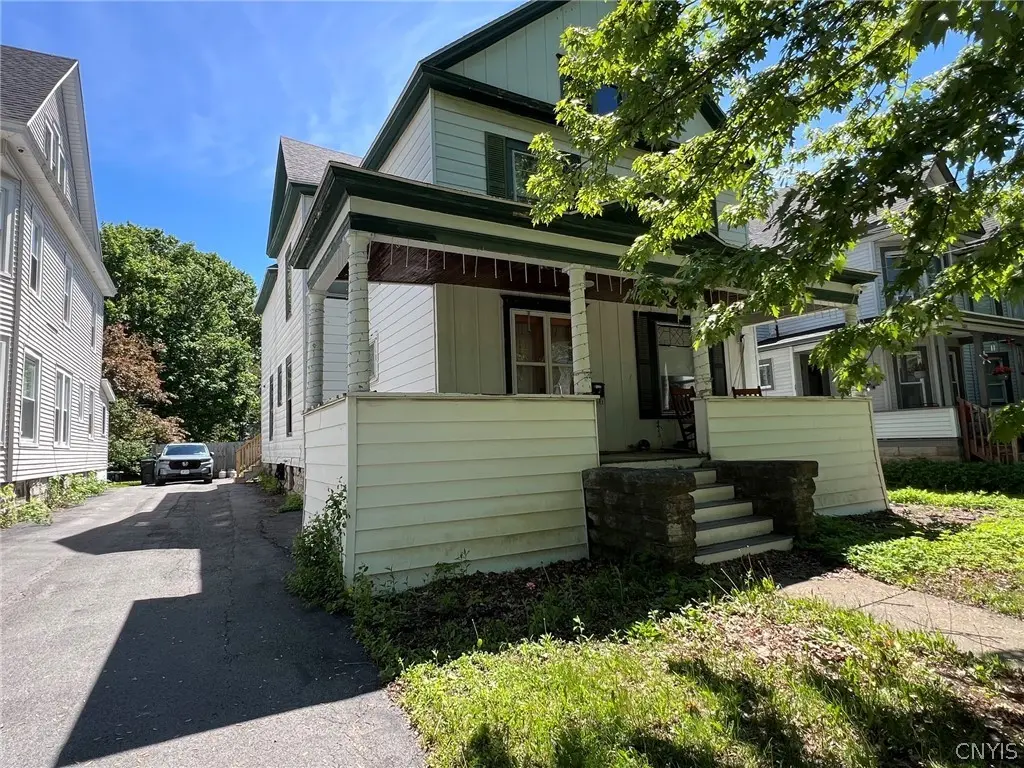
306 Winslow St · Watertown, NY
Flood risk 1/10 · Minimal
- FEMA flood zone
- X
- Chance of flooding over 30 yrs
- 0.0%
- Est. flood insurance / yr
- $473 – $860
Fire risk 1/10 · Minimal
- Est. fire insurance / yr
- $691 – $1,283
Heat risk 2/10 · Minimal
- Hot days now (above 91°F)
- 7 days/yr
- Hot days in 30 yrs
- 15 days/yr
Wind risk 1/10 · Minimal
- Chance of severe wind over 30 yrs
- 0.0%
Air-quality risk 2/10 · Minimal
- Unhealthy air days now
- 1 days/yr
- Unhealthy air days in 30 yrs
- 1 days/yr
Risk factors via First Street. Map © Google.
Why this score? — see what drove the B grade
The composite is a weighted blend of 9 inputs, each scored 0–100. Each bar is that input's sub-score; the figure is the points it added to the 100-point composite (weight × sub-score).
- Cash flow +25.9/30.0
- ARV discount +15.0/15.0
- DSCR +8.7/10.0
- 1% rule +6.8/10.0
- Rent growth +5.0/5.0
- Schools +3.7/10.0
- Livability +3.4/5.0
- Condition / age +2.5/5.0
- Appreciation +0.0/10.0
$149,900
🖨 Deal sheet (PDF) 📄 Offer letter ✓ Due diligence
Listing remarks
Spacious and full of potential, this 5-bedroom, 1.5-bath Colonial in Watertown offers over 2,300 square feet of living space on a fully fenced lot. Featuring a flexible layout with a first-floor bedroom and half bath, this home is ideal for larger households, multi-generational living, or anyone needing extra space. The eat-in kitchen, formal dining room, and generously sized living areas provide plenty of room for everyday living and entertaining. Upstairs, you’ll find four additional bedrooms and a full bath, plus a potential 6th bedroom or bonus space. Outside, enjoy the open front porch, fenced backyard, and convenient location near public transportation and neighborhood amenities
Key facts
- Open front porch
- Convenient location
- Fully fenced lot
Tags
Property features AI
Exterior
- Parking: No garage
- Utilities: Electricity connected (circuit breakers); Public water connected; Sewer connected
- Home design: Two stories; Existing construction; Vinyl siding
- Construction: Block foundation
- Exterior features: Blacktop driveway; Fully fenced yard; Open porch/patio; Porch
Interior
- Kitchen: Gas range; Gas oven; Dishwasher; Refrigerator
- Bedrooms: One main-level bedroom
- Flooring: Carpet; Laminate; Varies
- Bathrooms: One full bathroom; One half bathroom; One main-level bathroom
- Heating & cooling: Gas forced-air heating
- Interior features: Separate/formal dining room; Eat-in kitchen; Bedroom on main level; Full basement with sump pump; One fireplace
- Laundry & utility: Gas water heater
Neighborhood map
What this means for you Summary
Snapshot
- This is a 5-bed/1.5-bath single-family listed at $150k.
Deal economics
- At list price, monthly cash flow is $369 ($4k/yr) — positive.
- The deal already cash-flows at list — no discount required.
- Meets the 1% rule at list price ($2k rent vs $150k).
- Recommended offer: $148k (1.5% below list) — sets the bar for market timing.
- Cap rate 9.2% vs local median 6.3% in Watertown — top-decile yield for the area; either an underpriced asset or a hidden risk that comps aren't pricing in. Stress-test before assuming the spread holds.
Location & tenants
- Location reads 68/100 on livability (#540 in NY) — a middle-class / working-renter tenant base. Strengths: health & safety A+, cost of living A-, housing A-; Watch: amenities C-, crime F, commute F.
- Watertown City School District (urban): math 34% / reading 54% proficiency, ranked #481 of 590 in NY (top 82%) — families likely to look elsewhere, expect single-tenant / working-renter base with shorter leases.
- Zoned schools: Knickerbocker School (math 32% / reading 47%, grade F, #1,444 of 2,108 statewide, top 71%, 364 students, 71% FRL); Case Middle School (math 17% / reading 41%, grade F, #566 of 729 statewide, top 78%, 626 students, 70% FRL); Watertown Senior High School (math 89% / reading 92%, grade A+, #231 of 1,100 statewide, top 21%, 1,083 students, 65% FRL) — zoned schools average 69% FRL vs 49% district-wide (20 pts higher); higher-poverty schools than district average — tighter screening recommended.
- Market conditions: Rents rising fast (+10.0%/yr); 224 active listings in the ZIP; 3 comparable units currently listed for rent nearby; rentals lingering (median 45d on market — plan ~5-8 weeks vacancy on turnover, expect pricing pressure); 100% of comp listings sitting > 30 days — soft ceiling on asking rent; 196 units permitted in Jefferson County in 2024 (0 in 5+ unit buildings).
- This rent runs 36% of the median local income ($59k/yr) — at the standard rent-burdened threshold; future hikes will face affordability resistance.
Forward outlook
- Local home prices are declining (-3.0%/yr); year-one equity from $1k of loan paydown is wiped out by about $4k of value loss. Plan a longer hold.
- Jefferson County population projected at -12% by 2050 — secular population decline; favor cash flow + early exit over multi-decade hold.
- At projected returns (-3.0% appreciation + 8.0% rent growth), your $42k cash investment doubles in ~8 years — after that, you're playing with house money.
Negotiation context
- It's been on market 23 days — a 2% lower offer ($148k) is reasonable based on typical stale-listing flexibility.
- 4 sale attempts since 19y ago; this cycle's ask has dropped $30k (17%) from the opening price — seller is motivated, your offer sets the floor, not the list.
- Current owner paid $124k; 21% above their basis — modest negotiation headroom, anchor on the comps not their cost.
Risks & watch-outs
- Watch-outs: built in 1897 — expect roof / HVAC / electrical / plumbing capex.
Questions for the listing agent
- Built in 1897 — when were the roof, HVAC, electrical panel, plumbing, and water heater last replaced?
- Is there a deadline driving the sale (1031 exchange, divorce, estate, relocation)? That informs how much negotiation room exists.
- Schools are D-rated, which usually means shorter tenancies and higher turnover. Who's the typical renter profile here, and what's been the actual vacancy rate?
- Crime grade is F in this area — have there been break-ins, vandalism, or insurance claims at this property in the last 3 years? What carrier currently insures it and at what premium?
- What's the average days-on-market for RENTAL listings here right now (not sales)? A rising rental-DOM trend means longer vacancies and softer asking-rent achievability than the comps imply.
- What's the recent tenant-quality profile in this submarket — average credit score on applications, eviction rate, late-payment / NSF rate, and stable-employment percentage? A property-management company in the area should have these aggregated.
- How much new for-sale + rental construction is in the pipeline within 1–3 miles? Heavy new supply typically softens prices + rents 12–24 months out; constrained supply supports both.
Investment metrics
- 1% rule
- 1.18% ✓
- Cap rate
- 9.24%
- Cash-on-cash
- 10.54%
- DSCR
- 1.47
- GRM
- 7.1
CMA / ARV
- ARV (on-the-fly)
- $275,418
- Comps found
- 12
Show comp detail 12 sales within ~0.75 mi
| Address | Dist | Beds/Ba | Sqft | Sold | Price | $/sf | Match |
|---|---|---|---|---|---|---|---|
| 340 Winslow St | 0.08mi | 5/2.0 | 2,288 (-3%) | 2mo | $203,425 | $89 | 88 |
| 512 Academy St | 0.19mi | 5/2.0 | 2,124 (-10%) | 4mo | $215,000 | $101 | 69 |
| 418 Brainard St | 0.25mi | 4/2.0 (-1) | 2,152 (-9%) | 1mo | $274,000 | $127 | 66 |
| 946 Franklin St | 0.35mi | 4/1.5 (-1) | 2,110 (-10%) | 0mo | $256,000 | $121 | 61 |
| 1025 Boyd St | 0.55mi | 4/3.0 (-1) | 2,345 (-0%) | 2mo | $231,000 | $99 | 60 |
| 360 Brainard St | 0.22mi | 4/2.0 (-1) | 2,016 (-14%) | 2mo | $162,000 | $80 | 57 |
| 919 Academy St | 0.44mi | 4/2.0 (-1) | 2,128 (-10%) | 0mo | $150,000 | $70 | 56 |
| 203 Keyes Ave | 0.22mi | 4/2.5 (-1) | 2,057 (-13%) | 4mo | $241,000 | $117 | 56 |
| 158 Haley St | 0.39mi | 4/2.0 (-1) | 2,105 (-11%) | 2mo | $241,000 | $114 | 56 |
| 1141 State St | 0.70mi | 4/2.0 (-1) | 2,272 (-4%) | 1mo | $299,900 | $132 | 54 |
| 142 Haley St | 0.41mi | 4/2.0 (-1) | 2,104 (-11%) | 4mo | $279,900 | $133 | 53 |
| 150 Bishop St | 0.51mi | 4/2.0 (-1) | 2,008 (-15%) | 5mo | $240,000 | $120 | 41 |
Match score weights: distance 35% · size 25% · config 20% · recency 20%. Top-matched comps best support the ARV.
Projected returns pro-forma
-3.0% appreciation · 8.0% rent growth · sell at horizon
- IRR
- 5.0%
- Equity multiple
- 1.20×
- Total profit
- $8,517
- Equity at exit
- $22,351
- IRR
- 18.5%
- Equity multiple
- 2.91×
- Total profit
- $80,127
- Equity at exit
- $12,961
Cash invested: $41,972 (down + closing). Projections, not guarantees.
Landlord ↔ Tenant lean methodology
- Overall (STATE)
- 15 Strongly Tenant-Friendly
- State New York
- 15 Strongly Tenant-Friendly · D+10
- County
- — inherits STATE
- City
- — inherits STATE
ZIP-level market 13601
- Home prices YoY
- -5.6%
- Rents YoY
- 10.0%
- Active inventory
- 224
- Price-to-rent
- 7.1×
Monthly cashflow live
- Estimated rent
- $1,763 medium interval (Pro) →
- Mortgage (P&I)
- −$786
- Tax from tax record
- −$176 /mo · $2,110/yr
- Insurance
- −$62
- HOA
- −$0
- Vacancy / Maint / Mgmt
- −$370
- Net cashflow
- $369
Break-even live
Sensitivity live
| Price | -10% $453 | -5% $411 | +0% $369 | +5% $326 | +10% $284 |
|---|---|---|---|---|---|
| Rent | -10% $229 | -5% $299 | +0% $369 | +5% $438 | +10% $508 |
| Rate | -1.0pp $444 | -0.5pp $407 | base $369 | +0.5pp $330 | +1.0pp $290 |
UW: 25.0% down · 7.5% · 30yr · 1.5% tax · 5.0% vac · 8.0% maint · 8.0% mgmt
Financing live
Cash to close
- Down payment
- $37,475
- Closing costs
- $4,497
- Reserves months
- —
- Total cash needed
- —
Loan-product check · same deal, 3 products live
Conventional
25% down · 7.5% · 30yr
- Down + closing
- —
- Monthly P&I
- —
- Monthly cashflow
- —
- DSCR
- —
- Eligible?
- —
Personal DTI + credit; lowest rate.
DSCR
20% down · 8.5% · 30yr
- Down + closing
- —
- Monthly P&I
- —
- Monthly cashflow
- —
- DSCR
- —
- Eligible?
- —
No personal income docs; deal must DSCR.
Hard money
10% down · 12.0% · 12mo
- Down + closing
- —
- Monthly P&I
- —
- Monthly cashflow
- —
- DSCR
- —
- Eligible?
- —
Short-term bridge; refi at stabilization.
Rent comps 3 comps
| Address | Beds | Baths | Sqft | Rent | $/sqft | DOM | Units | Dist |
|---|---|---|---|---|---|---|---|---|
| 156 N Meadow St Watertown, NY | 4.0 | 1.0 | 2535 | $1,500 | $0.59 | 45d | 1 | 1.00mi |
| 256 Michigan Ave Watertown, NY | 2.0–4.0 | 1.0–2.5 | 1435 | $1,626 | $1.13 | 45d | 9 | 1.07mi |
| 1815 Olmstead Dr Watertown, NY | 2.0–4.0 | 1.0–2.0 | 1380 | $1,676 | $1.21 | 45d | 6 | 1.39mi |
Listing history 27 events
-
2026-06-18days on market $149,900 Active 23 DOM
-
2026-06-17days on market $149,900 Active 22 DOM
-
2026-06-16days on market $149,900 Active 21 DOM
-
2026-06-15days on market $149,900 Active 20 DOM
-
2026-06-14days on market $149,900 Active 18 DOM
-
2026-06-13price $149,900 Active 17 DOM
-
2026-06-12days on market $159,900 Active 17 DOM
-
2026-06-09days on market $159,900 Active 14 DOM
-
2026-06-09price $159,900 Active 13 DOM
-
2026-06-08days on market $169,900 Active 13 DOM
-
2026-06-07days on market $169,900 Active 12 DOM
-
2026-06-05days on market $169,900 Active 9 DOM
-
2026-06-03days on market $169,900 Active 8 DOM
-
2026-06-02pricedays on market $169,900 Active 7 DOM
-
2026-06-01days on market $179,900 Active 6 DOM
-
2026-05-31days on market $179,900 Active 5 DOM
-
2026-05-30days on market $179,900 Active 4 DOM
-
2026-05-26$179,900 Active
-
2021-06-15soldstatus $123,600
-
2017-06-26historical
-
2017-06-02$130,000
-
2014-06-26historical
-
2014-02-17$144,800
-
2007-11-20soldstatus $127,000
-
2007-11-19soldstatus $127,000
-
2007-07-18$129,800
-
2001-10-31soldstatus $69,500
ⓘ Source: listings_history table (triggers on properties + properties_extension) + one-shot
backfill from property_details.listing_events for pre-trigger history.
Tax reassessment forecast NY · Partial reset (capped growth)
- Current annual tax
- $2,110 · $176/mo
- Projected year-2 tax
- $2,322 · $193/mo
- Expected delta
- +$212/yr (+$18/mo · 10.0%)
ⓘ Screening estimate from a state-policy table — verify with the county assessor before closing.
Climate risk First Street
- Flood 1/10 Low FEMA zone X · 0% chance over 30 yrs
- Wildfire 1/10 Low
- Heat 2/10 Low 7 d/yr ≥91°F today · 15 d/yr by 30 yrs out
- Wind 1/10 Low 0% chance of damaging wind over 30 yrs
- Air quality 2/10 Low 1 unhealthy d/yr today · 1 by 30 yrs out
Nearby sold comps map
Loading sold comps map…
Walkable amenities ~0.75 mi
Loading nearby amenities…
Taxation est. · year 1
- Rental income
- $21,158
- − Mortgage interest
- −$8,397
- − Property taxes
- −$2,110
- − Insurance
- −$750
- − Repairs & maintenance
- −$1,693
- − Management
- −$1,693
- − Depreciation
- −$4,361
- Taxable income
- $2,156
- Est. tax owed @ 24.0%
- −$517
- After-tax cash flow
- $3,905/yr
For passive investors: Depreciation is non-cash, so a rental often shows a tax loss while cash-flowing — sheltering income. Rental losses are passive: they offset passive income freely, and up to $25,000/yr can offset ordinary (W-2) income if you actively participate and your MAGI is under $100k (phasing out to $0 by $150k); unused losses carry forward. On sale, claimed depreciation is recaptured at up to 25%, and gains may owe capital-gains tax (a 1031 exchange can defer both). Figures are a year-1 estimate at your 24.0% rate — not tax advice; consult a CPA.
Schools (NCES district)
- District
- Watertown City School District
- NCES district ID
- 3630120
- Math proficiency
- 34% ▼ -10.00%
- Reading proficiency
- 54% ▲ 12.00%
- Median HH income
- $40,919
- Composite
- 36.86/100
- National rank
- #4551
- State rank
- #481 of 590 in NY
Livability — Watertown
- Score
- 68/100
- State rank
- #540
- US rank
- #9700
Category grades
Schools grade is shown separately in the Schools card above.
Census & demographics
- Census place
- Watertown, NY
- County
- Jefferson County · 47,417 people
- City population
- 36,839
- Metro
- Watertown-Fort Drum, NY
- Population (ZIP)
- 36,839
- Household income
- $58,791
- Rent vs Own
- Severe rent burden
- 1634.0
Population outlook (Jefferson County) Hauer SSP2
- Today (2025)
- 111,748 people
- By 2030
- 109,370 · -2.1%
- By 2040
- 103,828 · -7.1%
- By 2050
- 98,523 · -11.8%
- By 2075
- 91,422 · -18.2%
- By 2100
- 78,214 · -30.0%
Race, ethnicity, and origin ACS 2023
- Neighborhood character
- Predominantly White (82%)
- Race & ethnicity
- White 82% Two or more races 7% Hispanic / Latino 6% Black 4% Asian 2%
- Hispanic origin (detail)
- Mexican 2% Puerto Rican 2%
- Common ancestry
- Lithuanian 7% Romanian 3% Slovak 2%
- Foreign-born
- 4% · Canada
- Languages at home
- 94% English-only · Spanish 3% Other Indo-European 1% German/W. Germanic 1%
Political lean MEDSL · Jefferson
- 2024 margin
- Strong R (+23.6) · D 38.2% · R 61.8%
- 2008→2024 swing
- -18.3pp toward R · 2008: -5.3pp · 2024: -23.6pp
- All cycles
- 2024: R+23.6 2020: R+19.0 2016: R+22.4 2012: R+2.9 2008: R+5.3
Not yet ingested
- Civics
- —
Market trends
- HPI YoY
- ▼ -18.86%
- Current HPI
- 316.636
- Rent YoY
- ▲ 9.96%
- Metro
- Watertown-Fort Drum, NY
- State GDP YoY
- ▲ 2.60%
- F500 in state
- 92
Industry mix (Fortune 500 HQ in NY)
| Industry | F500 HQs | Revenue |
|---|---|---|
| Financial Services | 10 | $950B |
|
||
| Consumer Goods | 9 | $162B |
|
||
| Insurance | 4 | $225B |
|
||
| Telecommunications | 2 | $144B |
|
||
| Pharmaceuticals | 2 | $112B |
|
||
| Media / Entertainment | 2 | $69B |
|
||
Price history
+158.8% since first listed10 events — show timeline
- 2026-05-26 Listed $179,900 CNYIS
- 2021-06-15 Sold (Public Records) $123,600 Public Records
- 2017-06-26 Listing Removed — CNYIS
- 2017-06-02 Listed $130,000 CNYIS
- 2014-06-26 Listing Removed — CNYIS
- 2014-02-17 Listed $144,800 CNYIS
- 2007-11-20 Sold (Public Records) $127,000 Public Records
- 2007-11-19 Sold (MLS) $127,000 CNYIS
- 2007-07-18 Listed $129,800 CNYIS
- 2001-10-31 Sold (Public Records) $69,500 Public Records
Property tax history
+18.7%/yrLatest (2025): $2,110 · +3.9% YoY. Source: county tax records.
Cash-flow waterfall
monthlySold comps — $/sqft
last 12 mo · ≤1 miLoading sold comps…