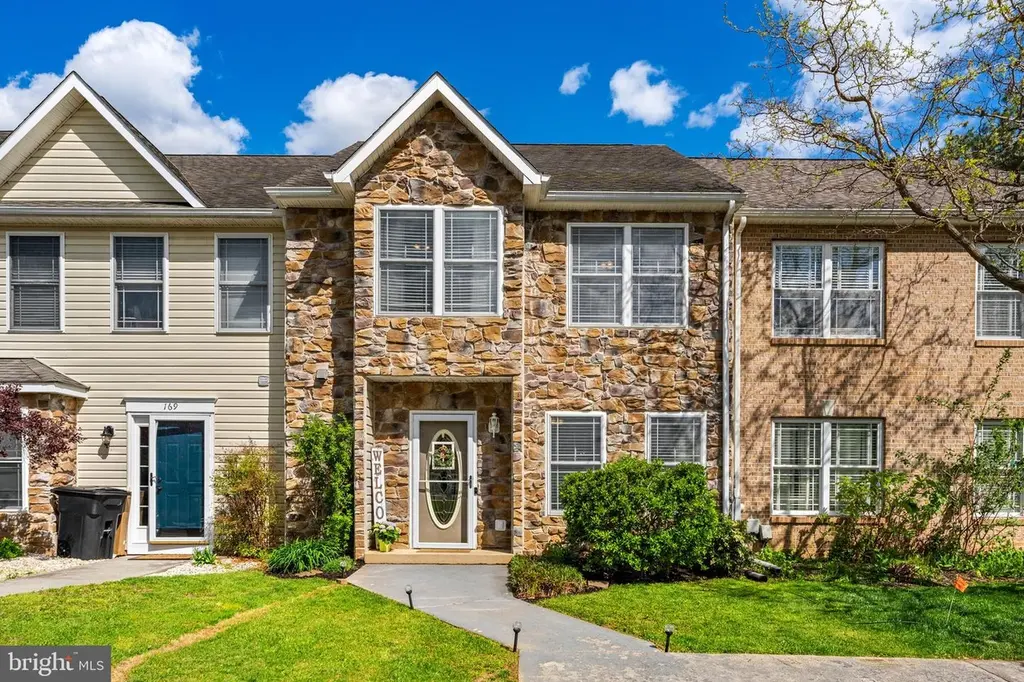
173 Baltusrol Dr · Charles Town, WV
Flood risk 1/10 · Minimal
- FEMA flood zone
- X (unshaded)
- Chance of flooding over 30 yrs
- 0.0%
- Est. flood insurance / yr
- $507 – $1,088
Fire risk 2/10 · Minimal
- Est. fire insurance / yr
- $787 – $1,461
Heat risk 6/10 · Moderate
- Hot days now (above 103°F)
- 7 days/yr
- Hot days in 30 yrs
- 17 days/yr
Wind risk 2/10 · Minimal
- Chance of severe wind over 30 yrs
- 3.0%
Air-quality risk 2/10 · Minimal
- Unhealthy air days now
- 1 days/yr
- Unhealthy air days in 30 yrs
- 1 days/yr
Risk factors via First Street. Map © Google.
Why this score? — see what drove the D- grade
The composite is a weighted blend of 9 inputs, each scored 0–100. Each bar is that input's sub-score; the figure is the points it added to the 100-point composite (weight × sub-score).
- Cash flow +8.1/30.0
- ARV discount +8.1/15.0
- Appreciation +6.3/10.0
- Livability +3.8/5.0
- Rent growth +3.6/5.0
- Schools +3.4/10.0
- Condition / age +2.5/5.0
- DSCR +2.1/10.0
- 1% rule +1.7/10.0
$295,000
🖨 Deal sheet 📄 Offer letter ✓ Due diligence
Listing remarks MLS
Maintenance free and energy efficient. Stone front townhouse w/ back yard view of golf course/fairway. Three bedrooms, two and half baths. Fully equipped kitchen w/ island. Spacious master bedroom w/ double closets and master bathroom. Back patio for entertaining.
Key facts
- $44 HOA
- Built 2003
- Listed 4 days
Neighborhood map
What this means for you Summary
Snapshot
- This is a 3-bed/2.5-bath townhouse listed at $295k.
Deal economics
- At list price, monthly cash flow is $-288 ($-3k/yr) — negative.
- To cash-flow at today's rent, offer at most $244k (17.3% below list).
- To meet the 1% rule (rent ≥ 1% of price), the offer needs to be $198k (32.9% below list).
- Recommended offer: $198k (32.9% below list) — sets the bar for 1% rule.
- Cap rate 5.1% vs local median 3.4% in Charles Town — top-decile yield for the area; either an underpriced asset or a hidden risk that comps aren't pricing in. Stress-test before assuming the spread holds.
Location & tenants
- Location reads 76/100 on livability (#22 in WV, #3,460 nationally) — a middle-class / working-renter tenant base. Strengths: crime A+, housing A+, health & safety A+; Watch: schools D+, amenities D+, commute F.
- Jefferson County Schools (rural): math 29% / reading 46% proficiency, ranked #6 of 55 in WV (top 11%) — families likely to look elsewhere, expect single-tenant / working-renter base with shorter leases.
- Market conditions: Rents rising fast (+4.3%/yr); 382 active listings in the ZIP; solid renter incomes; 1,162 units permitted in Jefferson County in 2024 (360 in 5+ unit buildings).
Forward outlook
- In year one you build about $10k of equity ($2k loan paydown + $8k appreciation (2.7% local appreciation)).
- Jefferson County population projected at +13% by 2050 — modest demand growth; plan on rents tracking national, not racing it.
- By year 4, paydown + projected appreciation supports a ~$34k cash-out refi (75% LTV) — recoverable capital for the next deal without selling this one.
Negotiation context
- Only 4 days on market — expect competitive offers; lowballing is unlikely to land.
- 3 sale attempts since 19y ago with the ask held roughly flat each time — persistent listings suggest the price (not the market) is what's stuck; bring a comps-based counter.
- Current owner paid $195k; list at $295k implies a 51% gain — meaningful room to come down on a strong offer.
Risks & watch-outs
- Climate carrying-cost: extreme-heat days projected 7→17/yr by 2055 (HVAC capex compounding) — expect insurance premiums to compound above CPI over the hold.
Questions for the listing agent
- What do current leases actually rent for vs. the listed asking? Can we see a recent rent roll and the last 12 months of T-12 income?
- What does the HOA fee cover, when was the last increase, and are there any pending special assessments or reserve-fund shortfalls?
- Is there a deadline driving the sale (1031 exchange, divorce, estate, relocation)? That informs how much negotiation room exists.
- Schools are D-rated, which usually means shorter tenancies and higher turnover. Who's the typical renter profile here, and what's been the actual vacancy rate?
- The area grade is low — what's the realistic commute time and amenity access for the typical tenant pool here? Any planned neighborhood developments (good or bad) we should know about?
- What's the average days-on-market for RENTAL listings here right now (not sales)? A rising rental-DOM trend means longer vacancies and softer asking-rent achievability than the comps imply.
- What's the recent tenant-quality profile in this submarket — average credit score on applications, eviction rate, late-payment / NSF rate, and stable-employment percentage? A property-management company in the area should have these aggregated.
- How much new for-sale + rental construction is in the pipeline within 1–3 miles? Heavy new supply typically softens prices + rents 12–24 months out; constrained supply supports both.
Investment metrics
- 1% rule
- 0.67% ✗
- Cap rate
- 5.12%
- Cash-on-cash
- -4.19%
- DSCR
- 0.81
- GRM
- 12.4
CMA / ARV
- ARV (on-the-fly)
- $299,208
- Comps found
- 12
Show comp detail 12 sales within ~0.75 mi
| Address | Dist | Beds/Ba | Sqft | Sold | Price | $/sf | Match |
|---|---|---|---|---|---|---|---|
| 173 Baltusrol Dr | 0.00mi | 3/2.5 | 1,644 (0%) | 1mo | $300,000 | $182 | 99 |
| 169 Baltusrol Dr | 0.01mi | 3/2.5 | 1,644 (0%) | 6mo | $283,000 | $172 | 95 |
| 89 Baltusrol Dr | 0.09mi | 2/2.5 (-1) | 1,612 (-2%) | 0mo | $286,900 | $178 | 87 |
| 127 Baltusrol Dr | 0.04mi | 3/2.5 | 1,584 (-4%) | 18mo | $290,000 | $183 | 76 |
| 22 Brookline Cir | 0.27mi | 2/2.5 (-1) | 1,684 (+2%) | 3mo | $360,000 | $214 | 76 |
| 123 Baltusrol Dr | 0.05mi | 3/2.5 | 1,780 (+8%) | 21mo | $280,000 | $157 | 67 |
| 284 Baltusrol Dr | 0.11mi | 2/2.0 (-1) | 1,748 (+6%) | 20mo | $360,000 | $206 | 61 |
| 23 Berkeley | 0.41mi | 3/1.5 | 1,504 (-8%) | 4mo | $268,000 | $178 | 60 |
| 136 Brookline Dr | 0.31mi | 2/2.5 (-1) | 1,448 (-12%) | 1mo | $350,000 | $242 | 59 |
| 28 Newington Ct N | 0.36mi | 3/1.5 | 1,408 (-14%) | 5mo | $255,000 | $181 | 51 |
| 17 Beekman Pl | 0.49mi | 3/2.0 | 1,560 (-5%) | 20mo | $280,000 | $179 | 50 |
| 86 Westhall Dr | 0.44mi | 2/2.0 (-1) | 1,414 (-14%) | 22mo | $280,000 | $198 | 31 |
Match score weights: distance 35% · size 25% · config 20% · recency 20%. Top-matched comps best support the ARV.
Projected returns pro-forma
2.67% appreciation · 4.35% rent growth · sell at horizon
- IRR
- 3.2%
- Equity multiple
- 1.18×
- Total profit
- $14,779
- Equity at exit
- $127,277
- IRR
- 7.2%
- Equity multiple
- 2.07×
- Total profit
- $88,783
- Equity at exit
- $192,073
Cash invested: $82,600 (down + closing). Projections, not guarantees.
Landlord ↔ Tenant lean methodology
- Overall (STATE)
- 83 Strongly Landlord-Friendly
- State West Virginia
- 83 Strongly Landlord-Friendly · R+22
- County
- — inherits STATE
- City
- — inherits STATE
ZIP-level market 25414
- Home prices YoY
- 0.9%
- Rents YoY
- 4.3%
- Active inventory
- 382
- Price-to-rent
- 12.4×
Monthly cashflow live
- Estimated rent
- $1,980 medium interval (Pro) →
- Mortgage (P&I)
- −$1,547
- Tax from tax record
- −$138 /mo · $1,658/yr
- Insurance
- −$123
- HOA
- −$44
- Vacancy / Maint / Mgmt
- −$416
- Net cashflow
- $-288
Break-even live
UW: 25.0% down · 7.5% · 30yr · 1.5% tax · 5.0% vac · 8.0% maint · 8.0% mgmt
Financing live
Cash to close
- Down payment
- $73,750
- Closing costs
- $8,850
- Reserves months
- —
- Total cash needed
- —
Loan-product check · same deal, 3 products live
Conventional
25% down · 7.5% · 30yr
- Down + closing
- —
- Monthly P&I
- —
- Monthly cashflow
- —
- DSCR
- —
- Eligible?
- —
Personal DTI + credit; lowest rate.
DSCR
20% down · 8.5% · 30yr
- Down + closing
- —
- Monthly P&I
- —
- Monthly cashflow
- —
- DSCR
- —
- Eligible?
- —
No personal income docs; deal must DSCR.
Hard money
10% down · 12.0% · 12mo
- Down + closing
- —
- Monthly P&I
- —
- Monthly cashflow
- —
- DSCR
- —
- Eligible?
- —
Short-term bridge; refi at stabilization.
HOA detail
- Monthly dues
- $44 · $528/yr
Listing history 11 events
-
2026-04-25status Pending
-
2026-04-21$295,000 Active
-
2026-04-17historical $295,000
-
2019-12-06soldstatus $195,000
-
2008-06-23soldstatus $184,150
-
2008-06-19soldstatus $184,150 264-char remark
Show marketing remark (264 chars)
Maintenance free and energy efficient. Stone front townhouse w/ back yard view of golf course/fairway. Three bedrooms, two and half baths. Fully equipped kitchen w/ island. Spacious master bedroom w/ double closets and master bathroom. Back patio for entertaining.
-
2008-05-16historical 264-char remark
Show marketing remark (264 chars)
Maintenance free and energy efficient. Stone front townhouse w/ back yard view of golf course/fairway. Three bedrooms, two and half baths. Fully equipped kitchen w/ island. Spacious master bedroom w/ double closets and master bathroom. Back patio for entertaining.
-
2007-11-09historical
Show marketing remark (264 chars)
Maintenance free and energy efficient. Stone front townhouse w/ back yard view of golf course/fairway. Three bedrooms, two and half baths. Fully equipped kitchen w/ island. Spacious master bedroom w/ double closets and master bathroom. Back patio for entertaining.
-
2007-11-09$189,999 264-char remark
Show marketing remark (264 chars)
Maintenance free and energy efficient. Stone front townhouse w/ back yard view of golf course/fairway. Three bedrooms, two and half baths. Fully equipped kitchen w/ island. Spacious master bedroom w/ double closets and master bathroom. Back patio for entertaining.
-
2007-07-06
-
2003-12-05soldstatus $169,600
ⓘ Source: listings_history table (triggers on properties + properties_extension) + one-shot
backfill from property_details.listing_events for pre-trigger history.
Tax reassessment forecast WV · Resets to sale price
- Current annual tax
- $1,658 · $138/mo
- Projected year-2 tax
- $1,740 · $145/mo
- Expected delta
- +$82/yr (+$7/mo · 5.0%)
ⓘ Screening estimate from a state-policy table — verify with the county assessor before closing.
Climate risk First Street
- Flood 1/10 Low FEMA zone X (unshaded) · 0% chance over 30 yrs
- Wildfire 2/10 Low
- Heat 6/10 Major 7 d/yr ≥103°F today · 17 d/yr by 30 yrs out
- Wind 2/10 Low 3% chance of damaging wind over 30 yrs
- Air quality 2/10 Low 1 unhealthy d/yr today · 1 by 30 yrs out
Nearby sold comps map
Loading sold comps map…
Walkable amenities ~0.75 mi
Loading nearby amenities…
Taxation est. · year 1
- Rental income
- $23,756
- − Mortgage interest
- −$16,525
- − Property taxes
- −$1,658
- − Insurance
- −$1,475
- − Repairs & maintenance
- −$1,901
- − Management
- −$1,901
- − HOA
- −$528
- − Depreciation
- −$8,582
- Taxable loss
- −$8,812
- Est. tax savings @ 24.0%
- +$2,115
- After-tax cash flow
- $-1,343/yr
For passive investors: Depreciation is non-cash, so a rental often shows a tax loss while cash-flowing — sheltering income. Rental losses are passive: they offset passive income freely, and up to $25,000/yr can offset ordinary (W-2) income if you actively participate and your MAGI is under $100k (phasing out to $0 by $150k); unused losses carry forward. On sale, claimed depreciation is recaptured at up to 25%, and gains may owe capital-gains tax (a 1031 exchange can defer both). Figures are a year-1 estimate at your 24.0% rate — not tax advice; consult a CPA.
Schools (NCES district)
- District
- Jefferson County Schools
- NCES district ID
- 5400570
- Math proficiency
- 29% ▼ -13.00%
- Reading proficiency
- 46% ▼ -7.00%
- Median HH income
- $67,038
- Composite
- 33.98/100
- National rank
- #5322
- State rank
- #6 of 55 in WV
Livability — Charles Town
- Score
- 76/100
- State rank
- #22
- US rank
- #3460
Category grades
Schools grade is shown separately in the Schools card above.
Census & demographics
- County
- Jefferson County · 28,403 people
- City population
- 21,073
- Metro
- Washington-Arlington-Alexandria, DC-VA-MD-WV
- Population (ZIP)
- 21,073
- Household income
- $105,500
- Rent vs Own
- Severe rent burden
- 290.0
Population outlook (Jefferson County) Hauer SSP2
- Today (2025)
- 61,715 people
- By 2030
- 64,052 · +3.8%
- By 2040
- 67,713 · +9.7%
- By 2050
- 69,843 · +13.2%
- By 2075
- 72,679 · +17.8%
- By 2100
- 71,872 · +16.5%
Race, ethnicity, and origin ACS 2023
- Neighborhood character
- Predominantly White (78%)
- Race & ethnicity
- White 78% Two or more races 10% Black 7% Hispanic / Latino 7% Asian 1%
- Hispanic origin (detail)
- Mexican 2% Puerto Rican 1%
- Common ancestry
- Romanian 3% Slovak 2% Lithuanian 2%
- Foreign-born
- 5% · Canada, Jamaica
- Languages at home
- 93% English-only · Spanish 5% Other Indo-European 1%
Political lean MEDSL · Jefferson
- 2024 margin
- R (+15.8) · D 41.0% · R 56.8% · Other 2.1%
- 2008→2024 swing
- -20.6pp toward R · 2008: 4.8pp · 2024: -15.8pp
- All cycles
- 2024: R+15.8 2020: R+10.5 2016: R+15.3 2012: R+4.0 2008: D+4.8
Not yet ingested
- Civics
- —
Market trends
- HPI YoY
- ▲ 2.67%
- Current HPI
- 296.8007
- Rent YoY
- ▲ 4.35%
- Metro
- Washington-Arlington-Alexandria, DC-VA-MD-WV
- State GDP YoY
- —
- F500 in state
- 0
Price history
+73.9% since first listed11 events — show timeline
- 2026-04-25 Pending — BRIGHT MLS
- 2026-04-21 Listed $295,000 BRIGHT MLS
- 2026-04-17 Coming Soon $295,000 BRIGHT MLS
- 2019-12-06 Sold (Public Records) $195,000 Public Records
- 2008-06-23 Sold (Public Records) $184,150 Public Records
- 2008-06-19 Sold (MLS) $184,150 MRIS
- 2008-05-16 Delisted — MRIS
- 2007-11-09 Listed $189,999 MRIS
- 2007-11-09 Delisted — MRIS
- 2007-07-06 Listed — MRIS
- 2003-12-05 Sold (Public Records) $169,600 Public Records
Property tax history
+0.6%/yrLatest (2025): $1,658 · +6.5% YoY. Source: county tax records.
Cash-flow waterfall
monthlySold comps — $/sqft
last 12 mo · ≤1 miLoading sold comps…