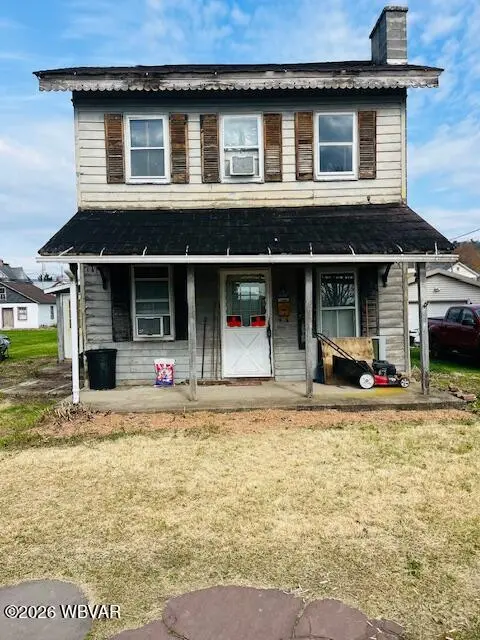
111 N 2nd St · Hughesville, PA
Flood risk 4/10 · Minor
- FEMA flood zone
- X (unshaded)
- Chance of flooding over 30 yrs
- 0.24%
- Est. flood insurance / yr
- $473 – $860
Fire risk 1/10 · Minimal
- Est. fire insurance / yr
- $511 – $949
Heat risk 4/10 · Minor
- Hot days now (above 96°F)
- 7 days/yr
- Hot days in 30 yrs
- 16 days/yr
Wind risk 2/10 · Minimal
- Chance of severe wind over 30 yrs
- 3.0%
Air-quality risk 2/10 · Minimal
- Unhealthy air days now
- 0 days/yr
- Unhealthy air days in 30 yrs
- 1 days/yr
Risk factors via First Street. Map © Google.
Why this score? — see what drove the C- grade
The composite is a weighted blend of 9 inputs, each scored 0–100. Each bar is that input's sub-score; the figure is the points it added to the 100-point composite (weight × sub-score).
- ARV discount +15.0/15.0
- Cash flow +11.6/30.0
- Appreciation +6.0/10.0
- Schools +4.9/10.0
- Livability +4.0/5.0
- 1% rule +3.7/10.0
- DSCR +3.4/10.0
- Rent growth +2.5/5.0
- Condition / age +2.5/5.0
$125,000
🖨 Deal sheet 📄 Offer letter ✓ Due diligence
Listing remarks MLS
Location!! Location!! Bring your imagination to this 2 story house or start fresh and take it down. Double lot, goes from 2nd Street all the way to the alley.
Key facts
- Double lot
- 2 story house
- 0.24 acre lot
Tags
Neighborhood map
What this means for you Summary
Snapshot
- This is a 3-bed/1.0-bath single-family listed at $125k.
Deal economics
- At list price, monthly cash flow is $-39 ($-473/yr) — negative.
- To cash-flow at today's rent, offer at most $118k (5.6% below list).
- To meet the 1% rule (rent ≥ 1% of price), the offer needs to be $109k (12.9% below list).
- Recommended offer: $109k (12.9% below list) — sets the bar for 1% rule.
Location & tenants
- Location reads 80/100 on livability (#225 in PA, #1,956 nationally) — a professional / high-income tenant draw. Strengths: crime A+, cost of living A+, housing A+; Watch: amenities F, commute F.
- East Lycoming SD (town): math 52% / reading 62% proficiency, ranked #93 of 539 in PA (top 17%) — acceptable for families but not a draw, mixed tenant base, ~2y average lease.
- Market conditions: 21 active listings in the ZIP; 73 units permitted in Lycoming County in 2024 (15 in 5+ unit buildings).
Forward outlook
- In year one you build about $3k of equity ($864 loan paydown + $2k appreciation (2.0% local appreciation)).
- Lycoming County population projected to shrink 10% by 2050 — rents likely to lag national; underwrite the cash flow, not the appreciation.
- At projected returns (2.0% appreciation + 3.0% rent growth), your $35k cash investment doubles in ~9 years — after that, you're playing with house money.
- By year 10, paydown + projected appreciation supports a ~$32k cash-out refi (75% LTV) — recoverable capital for the next deal without selling this one.
Negotiation context
- It's been on market 33 days — a 3% lower offer ($121k) is reasonable based on typical stale-listing flexibility.
Risks & watch-outs
- Watch-outs: built in 1901 — expect roof / HVAC / electrical / plumbing capex.
Questions for the listing agent
- What do current leases actually rent for vs. the listed asking? Can we see a recent rent roll and the last 12 months of T-12 income?
- It's been on market 33 days. Have you received any prior offers? Is the seller open to a 13% concession, seller financing, or rate buy-down credit?
- Built in 1901 — when were the roof, HVAC, electrical panel, plumbing, and water heater last replaced?
- Is there a deadline driving the sale (1031 exchange, divorce, estate, relocation)? That informs how much negotiation room exists.
- Schools are A-rated — typically a magnet for longer-tenancy family renters. What's the average tenant stay here, and is there a school-zone premium baked into asking?
- What's the average days-on-market for RENTAL listings here right now (not sales)? A rising rental-DOM trend means longer vacancies and softer asking-rent achievability than the comps imply.
- What's the recent tenant-quality profile in this submarket — average credit score on applications, eviction rate, late-payment / NSF rate, and stable-employment percentage? A property-management company in the area should have these aggregated.
- How much new for-sale + rental construction is in the pipeline within 1–3 miles? Heavy new supply typically softens prices + rents 12–24 months out; constrained supply supports both.
Investment metrics
- 1% rule
- 0.87% ✗
- Cap rate
- 5.91%
- Cash-on-cash
- -1.35%
- DSCR
- 0.94
- GRM
- 9.6
CMA / ARV
- ARV (median comp)
- $217,373
- List price
- $125,000
- Delta
- -42.50%
- Verdict
- UNDERPRICED
- Comps
- 20 within 1.0 mi
Show comp detail 11 sales within ~0.75 mi
| Address | Dist | Beds/Ba | Sqft | Sold | Price | $/sf | Match |
|---|---|---|---|---|---|---|---|
| 56 N Broad St | 0.23mi | 3/1.0 | 1,473 (+8%) | 2mo | $218,000 | $148 | 74 |
| 146 N 4th St | 0.19mi | 3/1.0 | 1,488 (+9%) | 9mo | $218,000 | $147 | 68 |
| 158 N 2nd St | 0.09mi | 3/2.0 | 1,512 (+11%) | 13mo | $298,000 | $197 | 62 |
| 54 S Broad St | 0.33mi | 3/1.5 | 1,320 (-3%) | 20mo | $230,000 | $174 | 62 |
| 172 S 4th St | 0.42mi | 4/1.0 (+1) | 1,278 (-6%) | 6mo | $250,000 | $196 | 60 |
| 374 E Water St | 0.22mi | 3/1.0 | 1,498 (+10%) | 22mo | $133,000 | $89 | 55 |
| 103 N Main St | 0.08mi | 2/1.0 (-1) | 1,188 (-13%) | 18mo | $125,000 | $105 | 55 |
| 1 Price Dr | 0.62mi | 3/1.0 | 1,344 (-1%) | 22mo | $240,000 | $179 | 51 |
| 50 N Broad St | 0.24mi | 2/1.0 (-1) | 1,233 (-9%) | 22mo | $168,000 | $136 | 50 |
| 366 S Second St | 0.67mi | 4/2.0 (+1) | 1,440 (+6%) | 18mo | $100,000 | $69 | 35 |
| 344 S 2nd St | 0.61mi | 3/1.5 | 1,550 (+14%) | 18mo | $225,000 | $145 | 31 |
Match score weights: distance 35% · size 25% · config 20% · recency 20%. Top-matched comps best support the ARV.
Projected returns pro-forma
1.96% appreciation · 3.0% rent growth · sell at horizon
- IRR
- 3.1%
- Equity multiple
- 1.17×
- Total profit
- $5,869
- Equity at exit
- $49,057
- IRR
- 7.0%
- Equity multiple
- 1.95×
- Total profit
- $33,205
- Equity at exit
- $70,454
Cash invested: $35,000 (down + closing). Projections, not guarantees.
Landlord ↔ Tenant lean methodology
- Overall (STATE)
- 62 Landlord-Friendly
- State Pennsylvania
- 62 Landlord-Friendly · EVEN
- County
- — inherits STATE
- City
- — inherits STATE
ZIP-level market 17737
- Home prices YoY
- 0.9%
- Active inventory
- 21
- Price-to-rent
- 9.6×
Monthly cashflow live
- Estimated rent
- $1,089 medium interval (Pro) →
- Mortgage (P&I)
- −$656
- Tax from tax record
- −$192 /mo · $2,302/yr
- Insurance
- −$52
- HOA
- −$0
- Vacancy / Maint / Mgmt
- −$229
- Net cashflow
- $-39
Break-even live
UW: 25.0% down · 7.5% · 30yr · 1.5% tax · 5.0% vac · 8.0% maint · 8.0% mgmt
Financing live
Cash to close
- Down payment
- $31,250
- Closing costs
- $3,750
- Reserves months
- —
- Total cash needed
- —
Loan-product check · same deal, 3 products live
Conventional
25% down · 7.5% · 30yr
- Down + closing
- —
- Monthly P&I
- —
- Monthly cashflow
- —
- DSCR
- —
- Eligible?
- —
Personal DTI + credit; lowest rate.
DSCR
20% down · 8.5% · 30yr
- Down + closing
- —
- Monthly P&I
- —
- Monthly cashflow
- —
- DSCR
- —
- Eligible?
- —
No personal income docs; deal must DSCR.
Hard money
10% down · 12.0% · 12mo
- Down + closing
- —
- Monthly P&I
- —
- Monthly cashflow
- —
- DSCR
- —
- Eligible?
- —
Short-term bridge; refi at stabilization.
Listing history 3 events
-
2026-05-17status Pending 158-char remark
Show marketing remark (158 chars)
Location!! Location!! Bring your imagination to this 2 story house or start fresh and take it down. Double lot, goes from 2nd Street all the way to the alley.
-
2026-04-28price $125,000 158-char remark
Show marketing remark (158 chars)
Location!! Location!! Bring your imagination to this 2 story house or start fresh and take it down. Double lot, goes from 2nd Street all the way to the alley.
-
2026-04-13$145,000 Active 158-char remark
Show marketing remark (158 chars)
Location!! Location!! Bring your imagination to this 2 story house or start fresh and take it down. Double lot, goes from 2nd Street all the way to the alley.
ⓘ Source: listings_history table (triggers on properties + properties_extension) + one-shot
backfill from property_details.listing_events for pre-trigger history.
Tax reassessment forecast PA · Partial reset (capped growth)
- Current annual tax
- $2,302 · $192/mo
- Projected year-2 tax
- $2,302 · $192/mo
- Expected delta
- $0/yr ($0/mo · 0.0%)
ⓘ Screening estimate from a state-policy table — verify with the county assessor before closing.
Climate risk First Street
- Flood 4/10 Moderate FEMA zone X (unshaded) · 24% chance over 30 yrs
- Wildfire 1/10 Low
- Heat 4/10 Moderate 7 d/yr ≥96°F today · 16 d/yr by 30 yrs out
- Wind 2/10 Low 3% chance of damaging wind over 30 yrs
- Air quality 2/10 Low 0 unhealthy d/yr today · 1 by 30 yrs out
Nearby sold comps map
Loading sold comps map…
Walkable amenities ~0.75 mi
Loading nearby amenities…
Taxation est. · year 1
- Rental income
- $13,064
- − Mortgage interest
- −$7,002
- − Property taxes
- −$2,302
- − Insurance
- −$625
- − Repairs & maintenance
- −$1,045
- − Management
- −$1,045
- − Depreciation
- −$3,636
- Taxable loss
- −$2,591
- Est. tax savings @ 24.0%
- +$622
- After-tax cash flow
- $149/yr
For passive investors: Depreciation is non-cash, so a rental often shows a tax loss while cash-flowing — sheltering income. Rental losses are passive: they offset passive income freely, and up to $25,000/yr can offset ordinary (W-2) income if you actively participate and your MAGI is under $100k (phasing out to $0 by $150k); unused losses carry forward. On sale, claimed depreciation is recaptured at up to 25%, and gains may owe capital-gains tax (a 1031 exchange can defer both). Figures are a year-1 estimate at your 24.0% rate — not tax advice; consult a CPA.
Schools (NCES district)
- District
- East Lycoming SD
- NCES district ID
- 4208490
- Math proficiency
- 52% ▼ -12.00%
- Reading proficiency
- 62% ▼ -12.00%
- Median HH income
- $53,360
- Composite
- 48.88/100
- National rank
- #2083
- State rank
- #93 of 539 in PA
Livability — Hughesville
- Score
- 80/100
- State rank
- #225
- US rank
- #1956
Category grades
Schools grade is shown separately in the Schools card above.
Census & demographics
- Census place
- Hughesville, PA
- Population (ZIP)
- 6,476
Population outlook (Lycoming County) Hauer SSP2
- Today (2025)
- 114,164 people
- By 2030
- 112,221 · -1.7%
- By 2040
- 107,613 · -5.7%
- By 2050
- 102,950 · -9.8%
- By 2075
- 92,987 · -18.5%
- By 2100
- 80,924 · -29.1%
Race, ethnicity, and origin ACS 2023
- Neighborhood character
- Predominantly White (89%)
- Race & ethnicity
- White 89% Two or more races 8% Hispanic / Latino 2%
- Common ancestry
- Romanian 3% Lithuanian 2% Polish 2%
- Foreign-born
- 1% · Canada
- Languages at home
- 98% English-only · Spanish 1%
Political lean MEDSL · Lycoming
- 2024 margin
- Solid R (+41.5) · D 28.8% · R 70.3%
- 2008→2024 swing
- -17.3pp toward R · 2008: -24.2pp · 2024: -41.5pp
- All cycles
- 2024: R+41.5 2020: R+41.3 2016: R+44.8 2012: R+33.3 2008: R+24.2
Not yet ingested
- Civics
- —
Market trends
- HPI YoY
- ▲ 1.96%
- Current HPI
- 215.8872
- Rent YoY
- —
- Metro
- —
- State GDP YoY
- ▲ 1.68%
- F500 in state
- 34
Industry mix (Fortune 500 HQ in PA)
| Industry | F500 HQs | Revenue |
|---|---|---|
| Healthcare | 2 | $309B |
|
||
| Insurance | 2 | $27B |
|
||
| Telecommunications / Media | 1 | $124B |
|
||
| Industrial Distribution | 1 | $22B |
|
||
| Financial Services | 1 | $20B |
|
||
| Chemicals / Materials | 1 | $18B |
|
||
Price history
-13.8% since first listed3 events — show timeline
- 2026-05-17 Pending — WBVAR
- 2026-04-28 Price Changed $125,000 WBVAR
- 2026-04-13 Listed $145,000 WBVAR
Property tax history
+2.5%/yrLatest (2026): $2,302 · +6.7% YoY. Source: county tax records.
Cash-flow waterfall
monthlySold comps — $/sqft
last 12 mo · ≤1 miLoading sold comps…