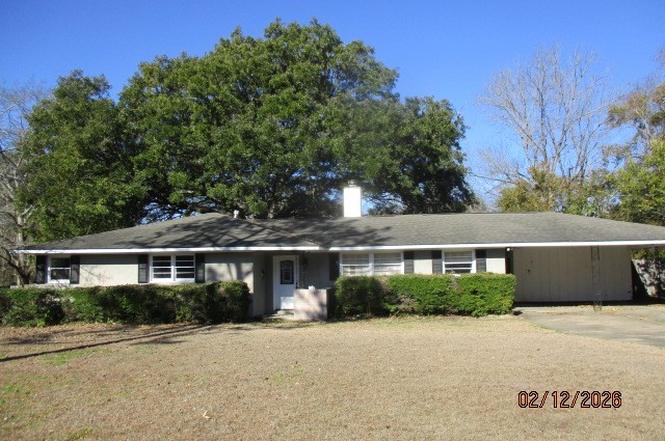
2708 Ashlawn Dr · Montgomery, AL
Flood risk 1/10 · Minimal
- FEMA flood zone
- X (unshaded)
- Chance of flooding over 30 yrs
- 0.0%
- Est. flood insurance / yr
- $507 – $1,088
Fire risk 1/10 · Minimal
- Est. fire insurance / yr
- $916 – $1,700
Heat risk 7/10 · Major
- Hot days now (above 108°F)
- 7 days/yr
- Hot days in 30 yrs
- 19 days/yr
Wind risk 8/10 · Major
- Chance of severe wind over 30 yrs
- 80.0%
Air-quality risk 2/10 · Minimal
- Unhealthy air days now
- 1 days/yr
- Unhealthy air days in 30 yrs
- 1 days/yr
Risk factors via First Street. Map © Google.
Why this score? — see what drove the B grade
The composite is a weighted blend of 9 inputs, each scored 0–100. Each bar is that input's sub-score; the figure is the points it added to the 100-point composite (weight × sub-score).
- Cash flow +30.0/30.0
- ARV discount +15.0/15.0
- DSCR +10.0/10.0
- 1% rule +9.5/10.0
- Livability +3.2/5.0
- Rent growth +2.5/5.0
- Condition / age +2.5/5.0
- Schools +1.7/10.0
- Appreciation +0.0/10.0
$89,500
🖨 Deal sheet (PDF) 📄 Offer letter ✓ Due diligence
Listing remarks MLS
3 Bedroom / 2 bath with large sunroom, pool and double carport. Additional detached storage. Hardwood floors with Berber over wood in bedrooms. Sunroom has mexican tile with glorious windows overlooking the pool and rear garden.
Key facts
- Slab foundation
- Eat in kitchen
- Two carport attached
Tags
Neighborhood map
What this means for you Summary
Snapshot
- This is a 3-bed/2.0-bath single-family listed at $90k.
Deal economics
- At list price, monthly cash flow is $444 ($5k/yr) — positive.
- The deal already cash-flows at list — no discount required.
- Meets the 1% rule at list price ($1k rent vs $90k).
- Recommended offer: $87k (3.0% below list) — sets the bar for market timing.
- Cap rate 12.2% vs local median 6.0% in Montgomery — top-decile yield for the area; either an underpriced asset or a hidden risk that comps aren't pricing in. Stress-test before assuming the spread holds.
Location & tenants
- Location reads 65/100 on livability (#138 in AL) — a middle-class / working-renter tenant base. Strengths: cost of living A+, housing A+; Watch: employment D, crime F, amenities D-.
- Montgomery County (urban): math 9% / reading 31% proficiency, ranked #106 of 129 in AL (top 82%) — low school quality limits family demand, transient renter base, plan for 1-2y turnover; 70% free/reduced lunch — lower-income household profile, screen leases tightly.
- Zoned schools: Dannelly Elementary School (math 2% / reading 21%, grade F, #556 of 627 statewide, top 89%, 622 students, 88% FRL); Brewbaker Middle School (math 0% / reading 19%, grade F, #227 of 257 statewide, top 90%, 838 students, 91% FRL); Jefferson Davis High School (math 3% / reading 16%, grade F, #258 of 305 statewide, top 85%, 1,522 students, 83% FRL) — zoned schools average 87% FRL vs 70% district-wide (17 pts higher); higher-poverty schools than district average — tighter screening recommended.
- Market conditions: 114 active listings in the ZIP; 23 comparable units currently listed for rent nearby; rentals at typical pace (median 23d on market — plan ~3-4 weeks tenant-placement turnaround); 43% of comp listings sitting > 30 days — soft ceiling on asking rent; 460 units permitted in Montgomery County in 2024 (37 in 5+ unit buildings).
Forward outlook
- Local home prices are declining (-3.0%/yr); year-one equity from $619 of loan paydown is wiped out by about $3k of value loss. Plan a longer hold.
- Montgomery County population projected to shrink 8% by 2050 — rents likely to lag national; underwrite the cash flow, not the appreciation.
- At projected returns (-3.0% appreciation + 3.0% rent growth), your $25k cash investment doubles in ~6 years — after that, you're playing with house money.
Negotiation context
- It's been on market 52 days — a 3% lower offer ($87k) is reasonable based on typical stale-listing flexibility.
- 6 sale attempts since 26y ago with the ask held roughly flat each time — persistent listings suggest the price (not the market) is what's stuck; bring a comps-based counter.
Risks & watch-outs
- Watch-outs: built in 1957 — expect roof / HVAC / electrical / plumbing capex.
- Climate carrying-cost: severe wind risk, 80% chance of damaging wind over 30y; extreme-heat days projected 7→19/yr by 2055 (HVAC capex compounding) — expect insurance premiums to compound above CPI over the hold.
Questions for the listing agent
- It's been on market 52 days. Have you received any prior offers? Is the seller open to a 3% concession, seller financing, or rate buy-down credit?
- Built in 1957 — when were the roof, HVAC, electrical panel, plumbing, and water heater last replaced?
- Is there a deadline driving the sale (1031 exchange, divorce, estate, relocation)? That informs how much negotiation room exists.
- Crime grade is F in this area — have there been break-ins, vandalism, or insurance claims at this property in the last 3 years? What carrier currently insures it and at what premium?
- What's the average days-on-market for RENTAL listings here right now (not sales)? A rising rental-DOM trend means longer vacancies and softer asking-rent achievability than the comps imply.
- What's the recent tenant-quality profile in this submarket — average credit score on applications, eviction rate, late-payment / NSF rate, and stable-employment percentage? A property-management company in the area should have these aggregated.
- How much new for-sale + rental construction is in the pipeline within 1–3 miles? Heavy new supply typically softens prices + rents 12–24 months out; constrained supply supports both.
Investment metrics
- 1% rule
- 1.45% ✓
- Cap rate
- 12.25%
- Cash-on-cash
- 21.27%
- DSCR
- 1.95
- GRM
- 5.7
CMA / ARV
- ARV (on-the-fly)
- $135,270
- Comps found
- 12
Show comp detail 12 sales within ~0.75 mi
| Address | Dist | Beds/Ba | Sqft | Sold | Price | $/sf | Match |
|---|---|---|---|---|---|---|---|
| 2708 Ashlawn Dr | 0.00mi | 3/2.0 | 1,670 (0%) | 1mo | $88,000 | $53 | 99 |
| 2603 Fairmont Rd | 0.31mi | 3/2.0 | 1,613 (-3%) | 0mo | $129,900 | $81 | 79 |
| 2764 S Colonial Dr | 0.24mi | 3/2.0 | 1,732 (+4%) | 7mo | $139,900 | $81 | 77 |
| 2656 Fisk Rd | 0.23mi | 3/2.0 | 1,584 (-5%) | 8mo | $100,000 | $63 | 74 |
| 2614 Fisk Rd | 0.31mi | 3/2.0 | 1,772 (+6%) | 3mo | $139,900 | $79 | 73 |
| 3026 Guymar Rd | 0.29mi | 3/2.0 | 1,794 (+7%) | 2mo | $80,000 | $45 | 72 |
| 3055 N Colonial Dr | 0.52mi | 3/2.0 | 1,620 (-3%) | 8mo | $170,000 | $105 | 64 |
| 2816 Newport Rd | 0.55mi | 3/2.0 | 1,738 (+4%) | 7mo | $162,000 | $93 | 62 |
| 3036 Sutton Dr | 0.33mi | 2/2.0 (-1) | 1,502 (-10%) | 4mo | $116,000 | $77 | 60 |
| 2632 Burkelaun Dr | 0.56mi | 3/2.0 | 1,853 (+11%) | 2mo | $185,000 | $100 | 54 |
| 3212 Mcgehee Rd | 0.70mi | 4/2.0 (+1) | 1,858 (+11%) | 10mo | $199,900 | $108 | 35 |
| 3114 Woodley Rd | 0.65mi | 4/2.0 (+1) | 1,419 (-15%) | 6mo | $129,000 | $91 | 35 |
Match score weights: distance 35% · size 25% · config 20% · recency 20%. Top-matched comps best support the ARV.
Projected returns pro-forma
-3.0% appreciation · 3.0% rent growth · sell at horizon
- IRR
- 13.8%
- Equity multiple
- 1.55×
- Total profit
- $13,783
- Equity at exit
- $13,345
- IRR
- 22.6%
- Equity multiple
- 2.93×
- Total profit
- $48,421
- Equity at exit
- $7,738
Cash invested: $25,060 (down + closing). Projections, not guarantees.
Landlord ↔ Tenant lean methodology
- Overall (STATE)
- 90 Strongly Landlord-Friendly
- State Alabama
- 90 Strongly Landlord-Friendly · R+15
- County
- — inherits STATE
- City
- — inherits STATE
ZIP-level market 36111
- Home prices YoY
- -6.9%
- Active inventory
- 114
- Price-to-rent
- 5.7×
Monthly cashflow live
- Estimated rent
- $1,302 high interval (Pro) →
- Mortgage (P&I)
- −$469
- Tax from tax record
- −$77 /mo · $930/yr
- Insurance
- −$37
- HOA
- −$0
- Vacancy / Maint / Mgmt
- −$273
- Net cashflow
- $444
Break-even live
Sensitivity live
| Price | -10% $495 | -5% $469 | +0% $444 | +5% $419 | +10% $393 |
|---|---|---|---|---|---|
| Rent | -10% $341 | -5% $393 | +0% $444 | +5% $496 | +10% $547 |
| Rate | -1.0pp $489 | -0.5pp $467 | base $444 | +0.5pp $421 | +1.0pp $397 |
UW: 25.0% down · 7.5% · 30yr · 1.5% tax · 5.0% vac · 8.0% maint · 8.0% mgmt
Financing live
Cash to close
- Down payment
- $22,375
- Closing costs
- $2,685
- Reserves months
- —
- Total cash needed
- —
Loan-product check · same deal, 3 products live
Conventional
25% down · 7.5% · 30yr
- Down + closing
- —
- Monthly P&I
- —
- Monthly cashflow
- —
- DSCR
- —
- Eligible?
- —
Personal DTI + credit; lowest rate.
DSCR
20% down · 8.5% · 30yr
- Down + closing
- —
- Monthly P&I
- —
- Monthly cashflow
- —
- DSCR
- —
- Eligible?
- —
No personal income docs; deal must DSCR.
Hard money
10% down · 12.0% · 12mo
- Down + closing
- —
- Monthly P&I
- —
- Monthly cashflow
- —
- DSCR
- —
- Eligible?
- —
Short-term bridge; refi at stabilization.
Rent comps 23 comps
| Address | Beds | Baths | Sqft | Rent | $/sqft | DOM | Units | Dist |
|---|---|---|---|---|---|---|---|---|
| 2656 Fisk Rd Montgomery, AL | 4.0 | 2.0 | 1584 | $1,400 | $0.88 | 45d | 1 | 0.24mi |
| 3050 Sutton Dr Montgomery, AL | 2.0 | 2.0 | 1719 | $1,450 | $0.84 | 22d | 1 | 0.41mi |
| 2440 Price St Unit C Montgomery, AL | 3.0 | 2.0 | 1800 | $1,050 | $0.58 | 45d | 1 | 0.51mi |
| 2441 Price St Unit D Montgomery, AL | 3.0 | 2.0 | 1264 | $900 | $0.71 | 22d | 1 | 0.52mi |
| 2430 Price St Montgomery, AL | 2.0 | 1.5 | 1275 | $1,175 | $0.92 | 15d | 1 | 0.53mi |
| 3543 Carter Hill Rd Montgomery, AL | 1.0–3.0 | 1.0–2.0 | 1120 | $925 | $0.83 | 15d | 16 | 0.55mi |
| 2230 Woodley Sq W Montgomery, AL | 1.0–2.0 | 1.0–2.0 | 902 | $898 | $1.00 | 15d | 11 | 0.59mi |
| 2619 Brantford Pl Montgomery, AL | 3.0 | 2.0 | 1323 | $1,200 | $0.91 | 45d | 1 | 0.70mi |
| 2651 Clement Curv Montgomery, AL | 3.0 | 2.0 | 1402 | $1,550 | $1.11 | 22d | 1 | 0.70mi |
| 3770 Maclamar Rd Montgomery, AL | 3.0 | 1.0 | 1129 | $950 | $0.84 | 22d | 1 | 0.95mi |
| 3252 Cheltenham Dr Montgomery, AL | 3.0 | 2.0 | 1705 | $1,200 | $0.70 | 45d | 1 | 0.99mi |
| 2724 Forsyth Ln Montgomery, AL | 4.0 | 2.0 | 1794 | $1,400 | $0.78 | 45d | 1 | 1.00mi |
| 1434 E Audubon Rd Montgomery, AL | 4.0 | 2.0 | 2237 | $1,475 | $0.66 | 45d | 1 | 1.05mi |
| 1437 Beaumont Dr Montgomery, AL | 4.0 | 2.0 | 2029 | $1,500 | $0.74 | 45d | 1 | 1.07mi |
| 2983 Old Farm Rd Montgomery, AL | 3.0 | 2.0 | 2000 | $1,725 | $0.86 | 22d | 1 | 1.22mi |
| 1067 Roslyn Dr Montgomery, AL | 4.0 | 2.0 | 1760 | $1,125 | $0.64 | 22d | 1 | 1.22mi |
| 1114 Druid Hills Dr Montgomery, AL | 3.0 | 1.0 | 1192 | $1,250 | $1.05 | 22d | 1 | 1.24mi |
| 1355 Buckingham Dr Montgomery, AL | 4.0 | 2.0 | 1620 | $1,650 | $1.02 | 15d | 1 | 1.25mi |
| 4220 Strathmore Dr Montgomery, AL | 1.0–3.0 | 1.0–2.0 | 931 | $1,099 | $1.18 | 45d | 1 | 1.27mi |
| 3352 Ridgefield Dr Montgomery, AL | 3.0 | 2.0 | 1932 | $1,761 | $0.91 | 22d | 1 | 1.33mi |
| 3580 McGehee Pl Dr S Montgomery, AL | 3.0 | 2.0 | 1200 | $1,205 | $1.00 | 45d | 1 | 1.35mi |
| 1814 Sylvan Dr Montgomery, AL | 3.0 | 2.0 | 1785 | $1,400 | $0.78 | 22d | 1 | 1.43mi |
| 3510 Bankhead Ave Montgomery, AL | 3.0 | 3.0 | 2210 | $2,250 | $1.02 | 45d | 1 | 1.47mi |
Listing history 10 events
-
2026-04-16status Pending
-
2026-03-25status Active
-
2026-02-18status Active
-
2026-02-14$89,500 Active
-
2025-06-11price $103,500
-
2025-06-02$107,500 Active
-
2005-08-31soldstatus $121,500 228-char remark
Show marketing remark (228 chars)
3 Bedroom / 2 bath with large sunroom, pool and double carport. Additional detached storage. Hardwood floors with Berber over wood in bedrooms. Sunroom has mexican tile with glorious windows overlooking the pool and rear garden.
-
2005-08-31$123,000 228-char remark
Show marketing remark (228 chars)
3 Bedroom / 2 bath with large sunroom, pool and double carport. Additional detached storage. Hardwood floors with Berber over wood in bedrooms. Sunroom has mexican tile with glorious windows overlooking the pool and rear garden.
-
2000-07-31soldstatus $118,000
-
2000-06-12$124,900
ⓘ Source: listings_history table (triggers on properties + properties_extension) + one-shot
backfill from property_details.listing_events for pre-trigger history.
Tax reassessment forecast AL · Resets to sale price
- Current annual tax
- $930 · $77/mo
- Projected year-2 tax
- $930 · $77/mo
- Expected delta
- $0/yr ($0/mo · -0.0%)
ⓘ Screening estimate from a state-policy table — verify with the county assessor before closing.
Climate risk First Street
- Flood 1/10 Low FEMA zone X (unshaded) · 0% chance over 30 yrs
- Wildfire 1/10 Low
- Heat 7/10 Severe 7 d/yr ≥108°F today · 19 d/yr by 30 yrs out
- Wind 8/10 Severe 80% chance of damaging wind over 30 yrs
- Air quality 2/10 Low 1 unhealthy d/yr today · 1 by 30 yrs out
Nearby sold comps map
Loading sold comps map…
Walkable amenities ~0.75 mi
Loading nearby amenities…
Taxation est. · year 1
- Rental income
- $15,619
- − Mortgage interest
- −$5,013
- − Property taxes
- −$930
- − Insurance
- −$448
- − Repairs & maintenance
- −$1,250
- − Management
- −$1,250
- − Depreciation
- −$2,604
- Taxable income
- $4,126
- Est. tax owed @ 24.0%
- −$990
- After-tax cash flow
- $4,340/yr
For passive investors: Depreciation is non-cash, so a rental often shows a tax loss while cash-flowing — sheltering income. Rental losses are passive: they offset passive income freely, and up to $25,000/yr can offset ordinary (W-2) income if you actively participate and your MAGI is under $100k (phasing out to $0 by $150k); unused losses carry forward. On sale, claimed depreciation is recaptured at up to 25%, and gains may owe capital-gains tax (a 1031 exchange can defer both). Figures are a year-1 estimate at your 24.0% rate — not tax advice; consult a CPA.
Schools (NCES district)
- District
- Montgomery County
- NCES district ID
- 0102430
- Math proficiency
- 9% ▼ -21.00%
- Reading proficiency
- 31% ▼ -1.00%
- Median HH income
- $43,902
- Composite
- 17.24/100
- National rank
- #9093
- State rank
- #106 of 129 in AL
Livability — Montgomery
- Score
- 65/100
- State rank
- #138
- US rank
- #13416
Category grades
Schools grade is shown separately in the Schools card above.
Census & demographics
- Census place
- Montgomery, AL
- City population
- 175,913
- Population (ZIP)
- 12,196
Population outlook (Montgomery County) Hauer SSP2
- Today (2025)
- 224,008 people
- By 2030
- 221,460 · -1.1%
- By 2040
- 214,179 · -4.4%
- By 2050
- 204,912 · -8.5%
- By 2075
- 177,821 · -20.6%
- By 2100
- 145,134 · -35.2%
Race, ethnicity, and origin ACS 2023
- Neighborhood character
- Majority Black (60%)
- Race & ethnicity
- Black 60% White 34% Asian 3% Hispanic / Latino 2% Two or more races 2%
- Common ancestry
- Slovak 2% Serbian 2% Italian 1%
- Foreign-born
- 3% · China, Canada
- Languages at home
- 95% English-only · Other Indo-European 2% Spanish 1% Chinese 1%
Political lean MEDSL · Montgomery
- 2024 margin
- Solid D (+30.7) · D 64.8% · R 34.1% · Other 1.1%
- 2008→2024 swing
- +11.5pp toward D · 2008: 19.2pp · 2024: 30.7pp
- All cycles
- 2024: D+30.7 2020: D+31.5 2016: D+26.2 2012: D+24.3 2008: D+19.2
Not yet ingested
- Civics
- —
Market trends
- HPI YoY
- ▼ -11.63%
- Current HPI
- 156.4412
- Rent YoY
- —
- Metro
- —
- State GDP YoY
- ▲ 2.94%
- F500 in state
- 4
Industry mix (Fortune 500 HQ in AL)
| Industry | F500 HQs | Revenue |
|---|---|---|
| Financial Services | 1 | $8B |
|
||
| Healthcare | 1 | $5B |
|
||
Price history
-28.3% since first listed10 events — show timeline
- 2026-04-16 Pending — MAAR
- 2026-03-25 Relisted — MAAR
- 2026-02-18 Relisted — MAAR
- 2026-02-14 Listed $89,500 MAAR
- 2025-06-11 Price Changed $103,500 MAAR
- 2025-06-02 Listed $107,500 MAAR
- 2005-08-31 Listed $123,000 MAAR
- 2005-08-31 Sold (MLS) $121,500 MAAR
- 2000-07-31 Sold (MLS) $118,000 MAAR
- 2000-06-12 Listed $124,900 MAAR
Property tax history
+7.5%/yrLatest (2025): $930 · +3.2% YoY. Source: county tax records.
Cash-flow waterfall
monthlySold comps — $/sqft
last 12 mo · ≤1 miLoading sold comps…